. 2024 Jan 30;15(1):894.
doi: 10.1038/s41467-024-45209-y.

Longitudinal quantification of Bifidobacterium longum subsp. infantis reveals late colonization in the infant gut independent of maternal milk HMO composition

Affiliations

Longitudinal quantification of Bifidobacterium longum subsp. infantis reveals late colonization in the infant gut independent of maternal milk HMO composition

Dena Ennis et al. Nat Commun. .

Abstract

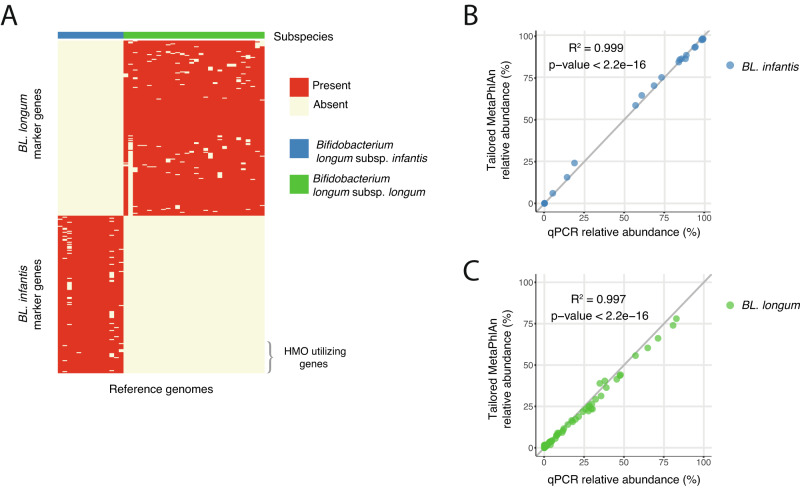
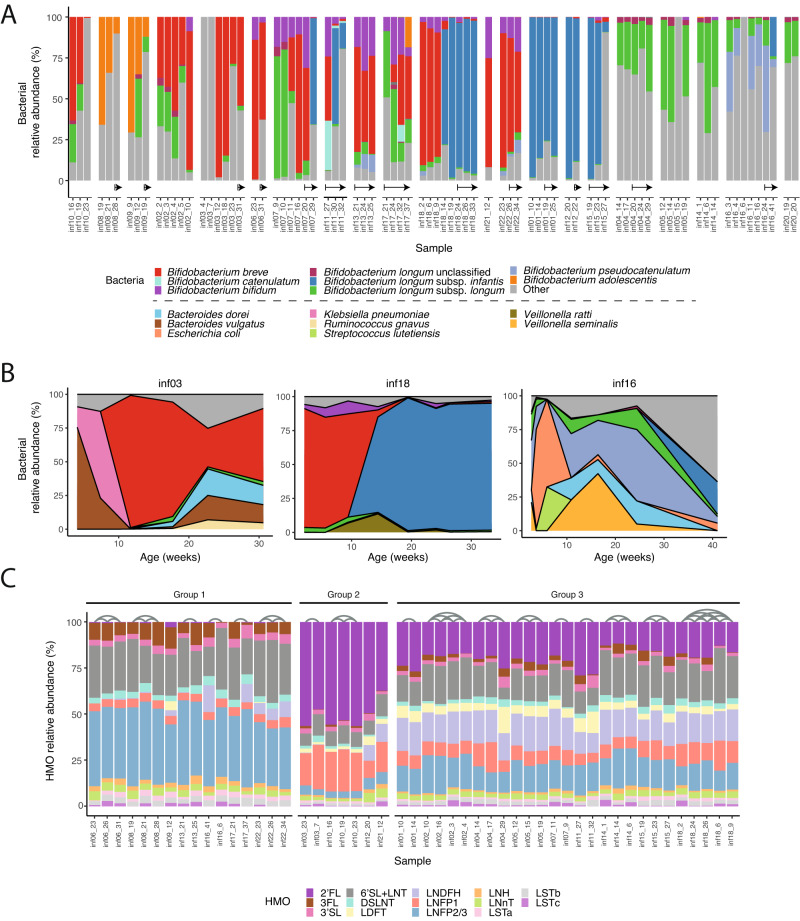
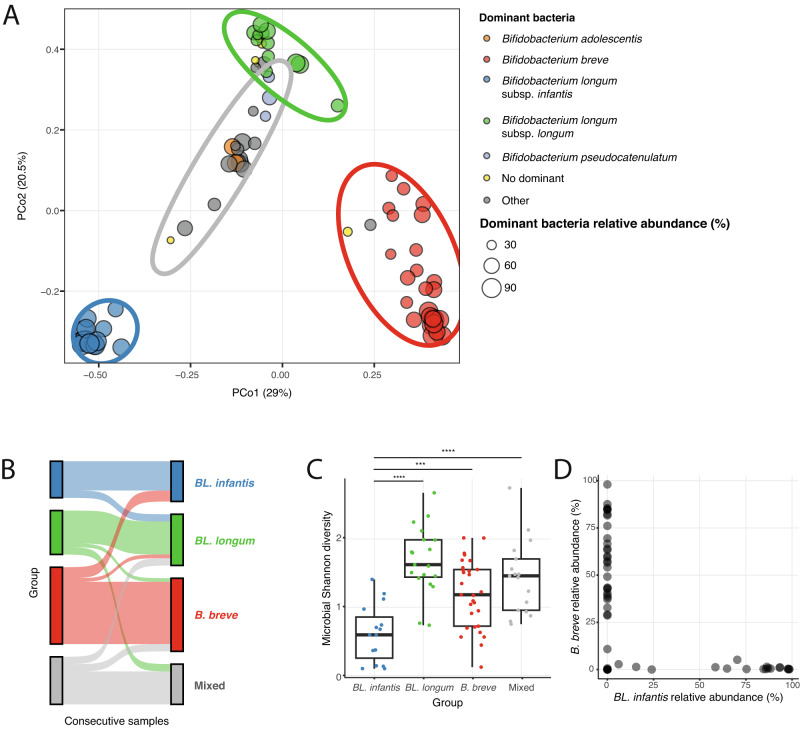
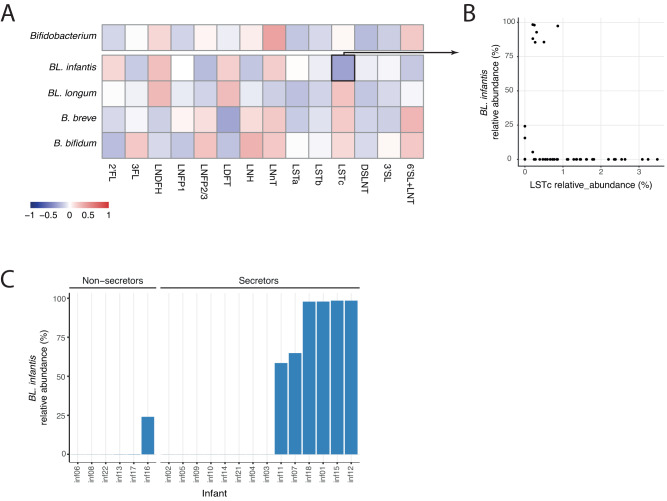
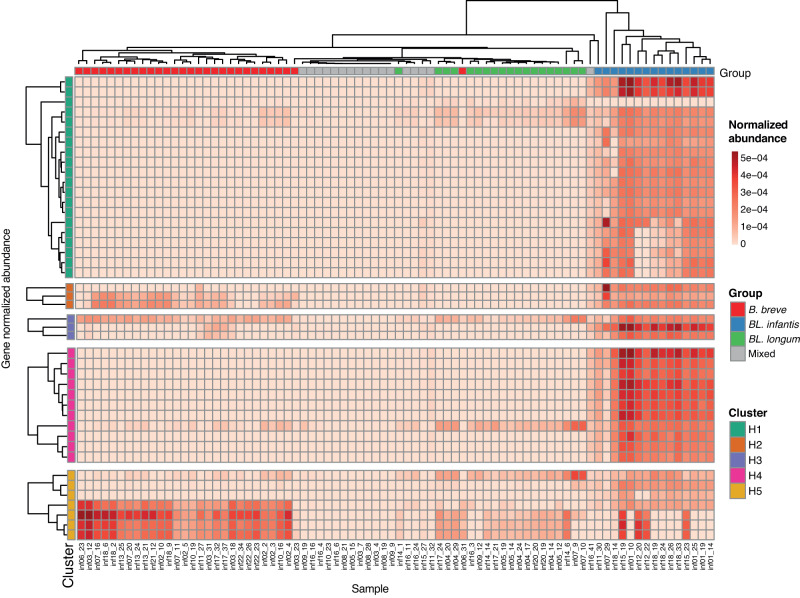
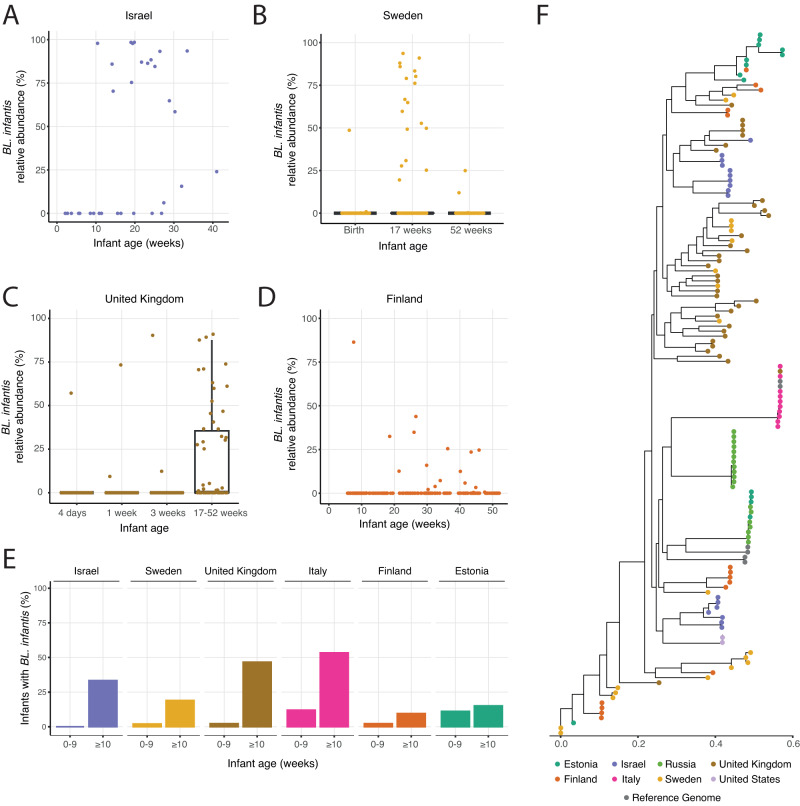
Breast milk contains human milk oligosaccharides (HMOs) that cannot be digested by infants, yet nourish their developing gut microbiome. While Bifidobacterium are the best-known utilizers of individual HMOs, a longitudinal study examining the evolving microbial community at high-resolution coupled with mothers' milk HMO composition is lacking. Here, we developed a high-throughput method to quantify Bifidobacterium longum subsp. infantis (BL. infantis), a proficient HMO-utilizer, and applied it to a longitudinal cohort consisting of 21 mother-infant dyads. We observed substantial changes in the infant gut microbiome over the course of several months, while the HMO composition in mothers' milk remained relatively stable. Although Bifidobacterium species significantly influenced sample variation, no specific HMOs correlated with Bifidobacterium species abundance. Surprisingly, we found that BL. infantis colonization began late in the breastfeeding period both in our cohort and in other geographic locations, highlighting the importance of focusing on BL. infantis dynamics in the infant gut.


Conflict of interest statement

The authors declare no competing interests.

Figures

Fig. 1
Fig. 1. Quantification of Bifidobacterium longum subspecies using marker-genes enables subspecies-level detection.
A Identification of unique genes in BL. infantis (blue) and BL. longum (green) reference genomes that can serve as marker-genes in the quantification of B. longum subspecies. HMO utilizing genes (HUGs) are marked on the bottom right and constitute only a small fraction of BL. infantis marker genes. B, C Validation of the computational approach, comparing the tailored MetaPhlAn marker-gene quantification results to the experimental qPCR results of B BL. infantis and C BL. longum. P-value for regression was calculated using a two-sided t-test.
Fig. 2
Fig. 2. Composition and dynamics of Bifidobacterium species in the infant gut and HMOs in mothers’ milk.
A Relative abundance of Bifidobacterium species in the infant gut (colorful) with all other species classified as “other” (gray). Samples from the same infant are grouped together, sorted by age. Arrows indicate samples taken after the introduction of solid food. B Temporal changes in the relative abundance of the microbial community in three infants (inf03, inf16, and inf18) in the first 30–40 weeks of life. The most prevalent bacteria are colored, and the remaining are indicated as “Other” (gray). Colors as in (A), with additional colors for the non-Bifidobacterium species. C Relative abundance of 16 HMOs measured in mothers’ milk. Samples are categorized into three groups based on their HMO profiles, and arches connect samples obtained from the same mother (Methods).
Fig. 3
Fig. 3. Variation across samples is highly impacted by the dominant Bifidobacterium species.
A Principal Coordinate Analysis (PCoA) of infant gut microbiome samples using Bray-Curtis dissimilarity. Points are color-coded based on the dominant Bifidobacterium species in each sample, and non-Bifidobacterium dominated samples are colored in gray. Samples without a dominant species (>30% relative abundance) are labeled as “No dominant” (yellow). The size of each point represents the relative abundance of the dominant bacteria in that sample. Ellipses encompass four groups identified using k-means clustering. Each group represents a primary dominant species (indicated by the ellipse color): BL. infantis (blue), BL. longum (green), B. breve (red), and “Mixed” (gray). B Changes in group assignment observed in consecutive samples from the same infant (colors as in A). C Microbial diversity of samples within each group (measured by the Shannon index; colors as in A; two sided t-test, n = 80 samples from 21 infants, ***p ≤ 0.001, ****p ≤ 0.0001). Box boundaries are the 25th and 75th percentiles, and the median is highlighted. Whiskers represent 1.5 * IQR and points past them are outliers. D Relative abundance of BL. infantis (x-axis) versus the relative abundance of B. breve (y-axis) in each sample, indicating the mutual exclusiveness of the two species.
Fig. 4
Fig. 4. Mothers’ milk HMO composition shows no signieficant correlation with infant gut Bifidobacterium.
A Pearson correlations between all measured HMOs and the Bifidobacterium genus, as well as the main individual species and subspecies (BL. infantis, BL. longum, B. breve and B. bifidum). None of these correlations were found to be statistically significant (t-test). B Comparison of the relative abundance of LSTc in mothers’ milk (x-axis) with the relative abundance of BL. infant is in the infant gut microbiome (y-axis). C Maximum relative abundance of BL. infantis in each infant divided into two groups of infants with secretor and non-secretor mothers, highlighting the high abundance of BL. infantis only in infants to secretor mothers, but not in all of them.
Fig. 5
Fig. 5. Abundance of HMO utilization genes in metagenomic samples.
Normalized genes abundance of HMO utilization genes (HUGs) in all infant samples. Genes (rows) are categorized and labeled according to their respective gene cluster (H1-H5). Samples (columns) are annotated based on their assigned dominant-species group.
Fig. 6
Fig. 6. Late colonization and low prevalence of BL. infantis in the infant gut in multiple geographic locations.
A Relative abundance of BL. infantis in our Israeli cohort, among infants where BL. infantis was detected at any time point. B–D Relative abundance of BL. infantis at different time points in samples from B Sweden (n = 300 samples from 100 infants) C UK (n = 376 samples from 169 infants) and D Finland (n = 228 samples from 108 infants). For Sweden and the United Kingdom where samples were collected at defined time points box plots are shown, with box boundaries at the 25th and 75th percentiles, and the median highlighted. Whiskers represent 1.5 * IQR and points past them are outliers. E The percentage of infants in multiple geographical locations harboring BL. infantis in the first 10 weeks of life and at 10 weeks and later. F Phylogenetic tree displaying BL. infantis strains found across all cohorts. The dominant strain from each sample is represented, and strains are color-coded based on their corresponding cohort, highlighting that some countries (like Italy) have very similar strains in all samples.

Similar articles

Cited by

References

    1. Westerfield KL, Koenig K, Oh R. Breastfeeding: Common questions and answers. Am. Fam. Physician. 2018;98:368–373. - PubMed
    1. Sela DA, Mills DA. Nursing our microbiota: molecular linkages between bifidobacteria and milk oligosaccharides. Trends Microbiol. 2010;18:298–307. doi: 10.1016/j.tim.2010.03.008. - DOI - PMC - PubMed
    1. Marcobal A, et al. Consumption of human milk oligosaccharides by gut-related microbes. J. Agric. Food Chem. 2010;58:5334–5340. doi: 10.1021/jf9044205. - DOI - PMC - PubMed
    1. Zivkovic AM, German JB, Lebrilla CB, Mills DA. Human milk glycobiome and its impact on the infant gastrointestinal microbiota. Proc. Natl Acad. Sci. USA. 2011;108:4653–4658. doi: 10.1073/pnas.1000083107. - DOI - PMC - PubMed
    1. Han, S. M. et al. Maternal and infant factors influencing human milk oligosaccharide composition: beyond maternal genetics. J. Nutr. 10.1093/jn/nxab028. (2021) - PubMed

Substances