. 2024 Jan 30;21(1):7.
doi: 10.1186/s12014-024-09450-3.

Frozen tissue coring and layered histological analysis improves cell type-specific proteogenomic characterization of pancreatic adenocarcinoma

Affiliations

Frozen tissue coring and layered histological analysis improves cell type-specific proteogenomic characterization of pancreatic adenocarcinoma

Sara R Savage et al. Clin Proteomics. .

Abstract

Background: Omics characterization of pancreatic adenocarcinoma tissue is complicated by the highly heterogeneous and mixed populations of cells. We evaluate the feasibility and potential benefit of using a coring method to enrich specific regions from bulk tissue and then perform proteogenomic analyses.

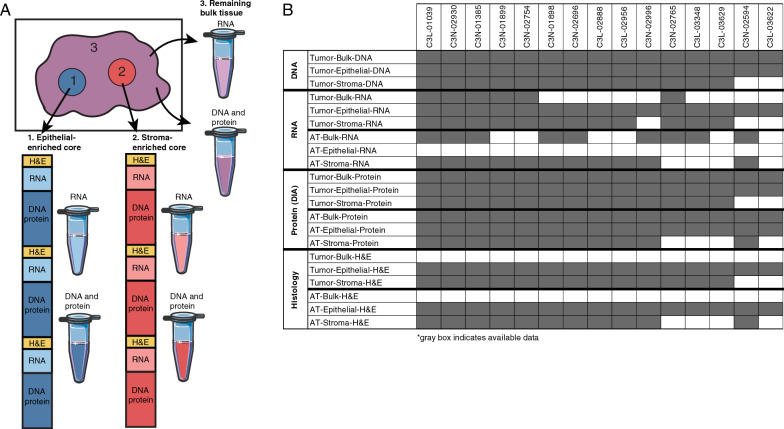
Methods: We used the Biopsy Trifecta Extraction (BioTExt) technique to isolate cores of epithelial-enriched and stroma-enriched tissue from pancreatic tumor and adjacent tissue blocks. Histology was assessed at multiple depths throughout each core. DNA sequencing, RNA sequencing, and proteomics were performed on the cored and bulk tissue samples. Supervised and unsupervised analyses were performed based on integrated molecular and histology data.

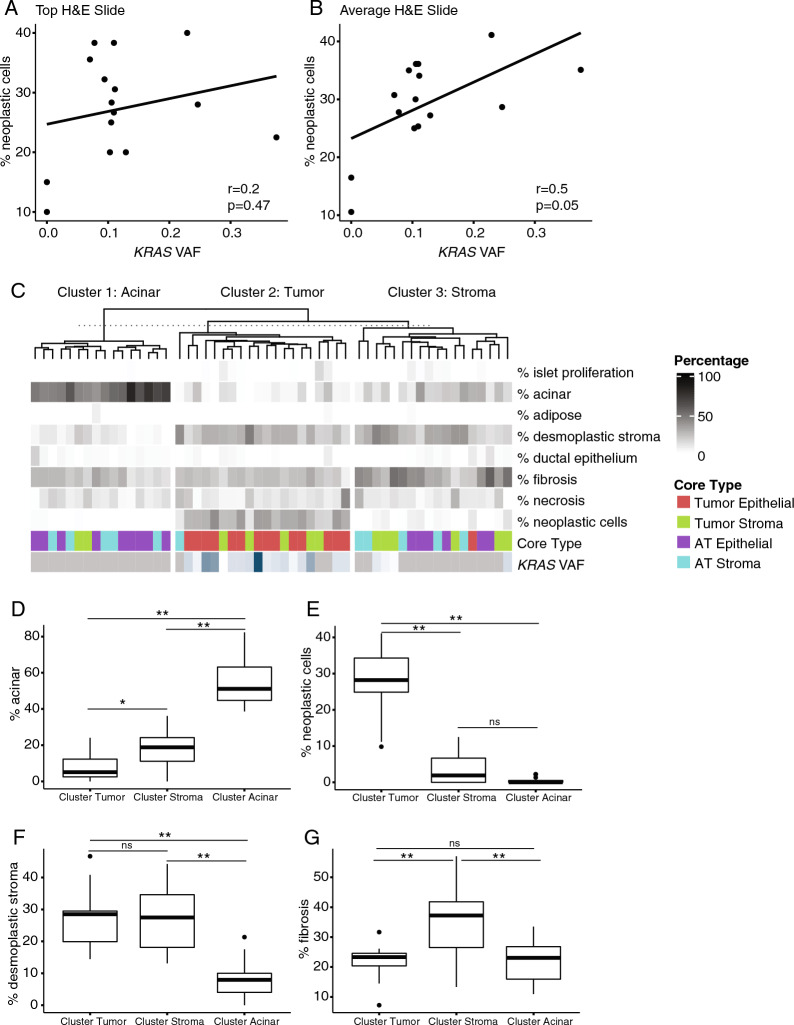
Results: Tissue cores had mixed cell composition at varying depths throughout. Average cell type percentages assessed by histology throughout the core were better associated with KRAS variant allele frequencies than standard histology assessment of the cut surface. Clustering based on serial histology data separated the cores into three groups with enrichment of neoplastic epithelium, stroma, and acinar cells, respectively. Using this classification, tumor overexpressed proteins identified in bulk tissue analysis were assigned into epithelial- or stroma-specific categories, which revealed novel epithelial-specific tumor overexpressed proteins.

Conclusions: Our study demonstrates the feasibility of multi-omics data generation from tissue cores, the necessity of interval H&E stains in serial histology sections, and the utility of coring to improve analysis over bulk tissue data.

Keywords: CPTAC; Microenvironment; Proteogenomic; Tissue coring.


Conflict of interest statement

The authors declare that they have no competing interests.

Figures

Fig. 1
Fig. 1
BioTExt protocol, data generation, and data availability. A Schematic of the BioTExt protocol. Using an H&E image from the surface of tumor tissue and adjacent tissue blocks, epithelial-enriched and stroma-enriched regions were selected for coring. The cores and the remaining bulk tissue were used for RNA, DNA, and proteomics analyses. B Available genomics, transcriptomics, proteomics, and histology data for tumor samples and AT samples
Fig. 2
Fig. 2
Coring enriched epithelial tissue but did not significantly differentiate tumor epithelial tissue from stromal tissue. A Principal component analysis for RNAseq data. All AT Epithelial samples had limited tissue availability and were not sequenced for RNA. B Principal component analysis for proteomics data. C Protein difference between tumor and AT in bulk tissue and epithelial-enriched cores. Some significantly enriched GO terms are highlighted. D Protein difference between tumor and AT in bulk tissue and stroma-enriched cores. E Difference in proteins between tumor epithelial-enriched cores and tumor stroma-enriched cores. F Percent increase of KRAS VAF from bulk tissue to epithelial-enriched cores and percent increase of KRAS VAF from stroma-enriched cores to epithelial-enriched cores
Fig. 3
Fig. 3
Tissue composition varies with core depth. A Percent neoplastic cells and desmoplastic stroma at the surface for each set of cores. B Average neoplastic cells percentage and desmoplastic stroma percent for each cored sample. Error bars are the standard deviation over at least three depths within the core. C (Top) OCT embedded PDAC frozen tissue cryosectioned at 5 µm and H&E stained with study pathologist selecting tumor rich (red, yellow) and stroma rich (blue) areas. (Bottom) Cryocores of selected regions 1.5 mm diameter with depths ranging from 4 to 7 mm placed en face in OCT
Fig. 4
Fig. 4
Sample clustering by average histology counts. A Percent neoplastic cells correlated with KRAS VAF for the surface H&E slide and B an average over 3 serial H&E slides. C Tumor clustering using percent cell types assessed by histology and averaged over multiple slides taken throughout the core. D Average percent acinar cells, E neoplastic cells, F desmoplastic stroma, and G fibrosis for the three histology clusters. *p < 0.005, **p < 0.0005
Fig. 5
Fig. 5
Proteomics differences in tumor vs stroma. A Proteomics abundance z score for proteins significantly different between the tumor and stroma clusters. B Protein abundance for four proteins that were identified as tumor-epithelial specific in the CPTAC PDAC study. C Protein abundance in tumor vs stroma clusters including proteins annotated as drug targets. D CEACAM1 protein abundance in the samples with a KRAS variant allele frequency increased > 20% in the epithelial-enriched core compared to the stroma-enriched core and bulk tissue. E CPOX protein abundance in the samples with a KRAS variant allele frequency increased > 20% in the epithelial-enriched core compared to the stroma-enriched core and bulk tissue

References

    1. American Cancer Society . Cancer facts and figures 2022. Atlanta: American Cancer Society; 2022. p. 80.
    1. Tang K, Lu W, Qin W, Wu Y. Neoadjuvant therapy for patients with borderline resectable pancreatic cancer: a systematic review and meta-analysis of response and resection percentages. Pancreatology. 2016;16:28–37. doi: 10.1016/j.pan.2015.11.007. - DOI - PubMed
    1. Cancer of the pancreas—cancer stat facts. SEER. 2023. https://seer.cancer.gov/statfacts/html/pancreas.html. Accessed on 14 Feb 2023.
    1. Cros J, Raffenne J, Couvelard A, Poté N. Tumor heterogeneity in pancreatic adenocarcinoma. Pathobiology. 2018;85:64–71. doi: 10.1159/000477773. - DOI - PubMed
    1. Cao L, Huang C, Zhou DC, Hu Y, Lih TM, Savage SR, et al. Proteogenomic characterization of pancreatic ductal adenocarcinoma. Cell. 2021;184:5031–5052.e26. doi: 10.1016/j.cell.2021.08.023. - DOI - PMC - PubMed

LinkOut - more resources