. 2024 Jan 31;24(1):156.
doi: 10.1186/s12885-024-11920-8.

Systematic analysis of the role of LDHs subtype in pan-cancer demonstrates the importance of LDHD in the prognosis of hepatocellular carcinoma patients

Affiliations

Systematic analysis of the role of LDHs subtype in pan-cancer demonstrates the importance of LDHD in the prognosis of hepatocellular carcinoma patients

Shengnan Wang et al. BMC Cancer. .

Abstract

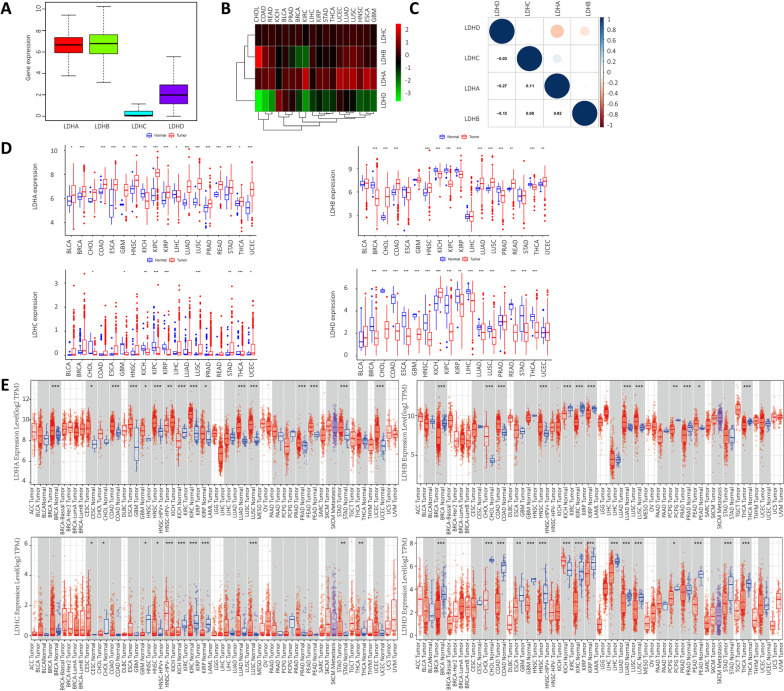
Background: Lactate dehydrogenase (LDHs) is an enzyme involved in anaerobic glycolysis, including LDHA, LDHB, LDHC and LDHD. Given the regulatory role in the biological progression of certain tumors, we analyzed the role of LDHs in pan-cancers.

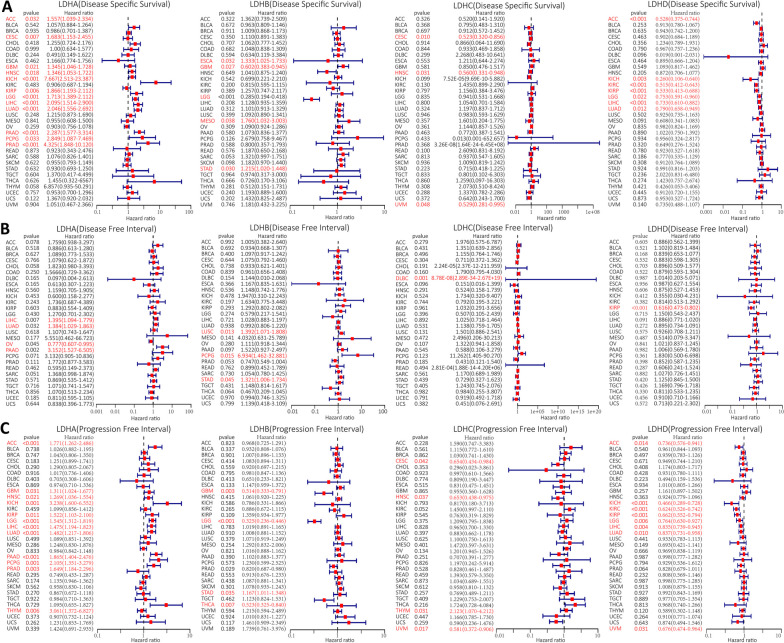
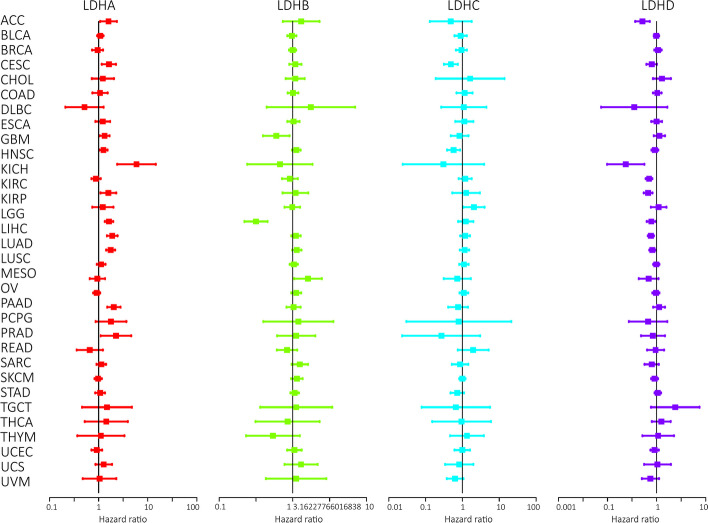
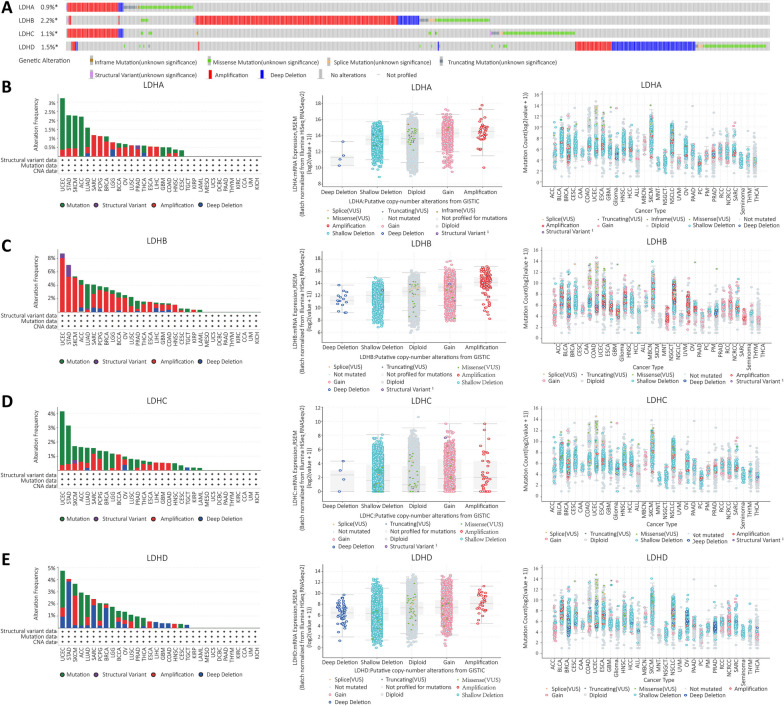
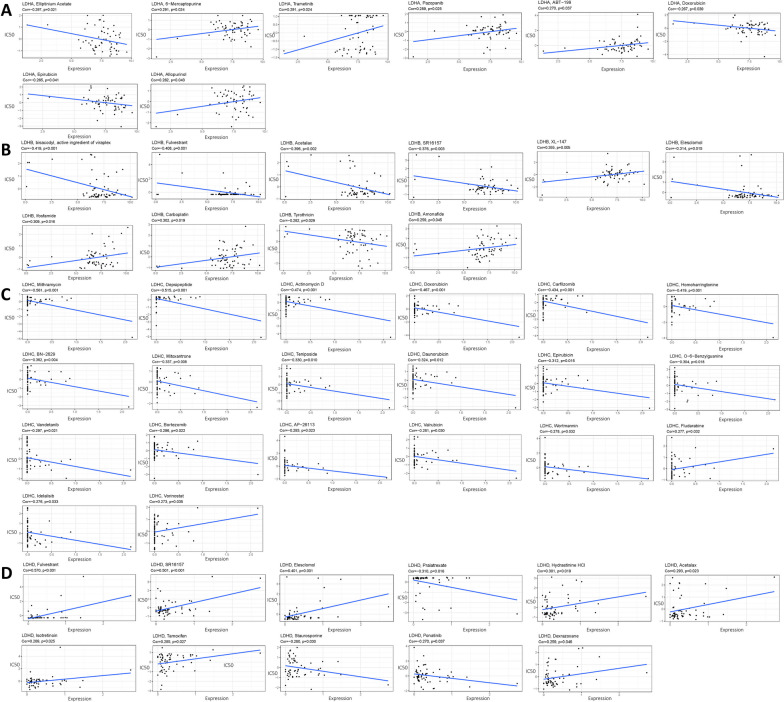
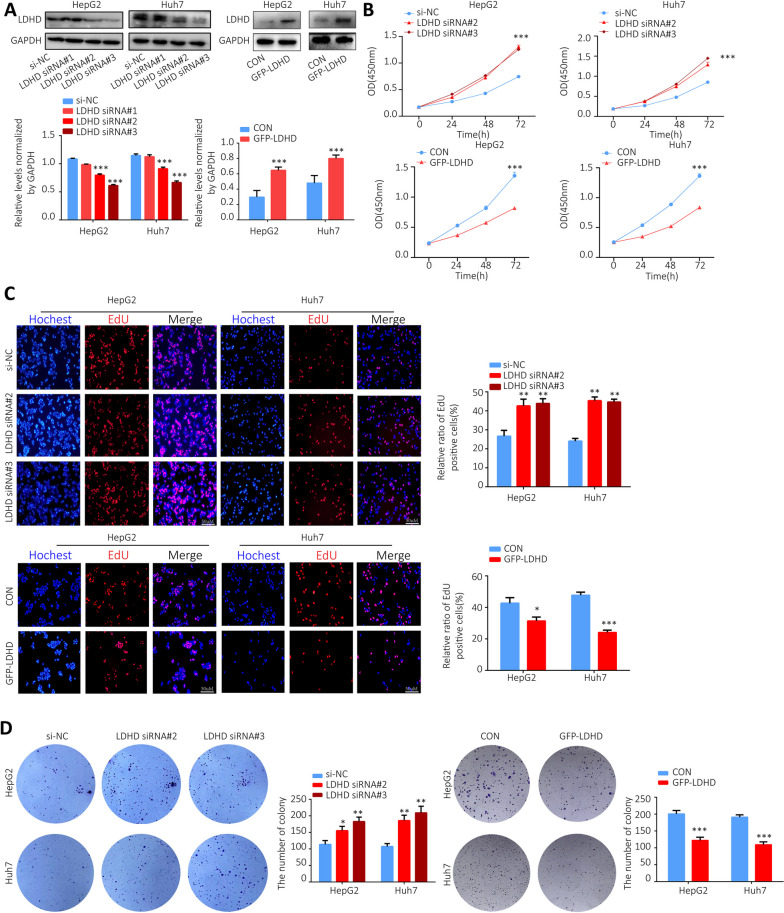
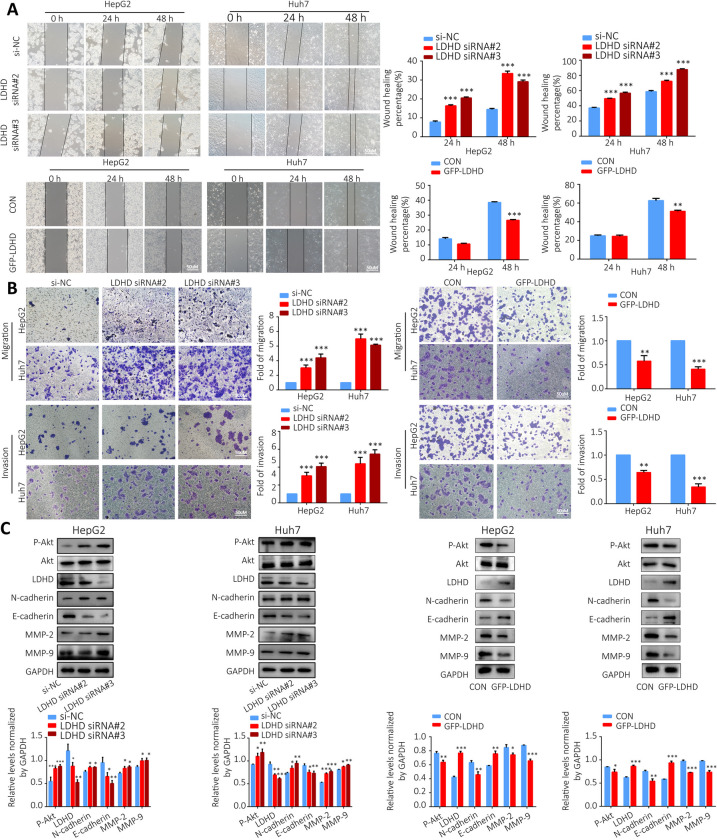
Methods: Cox regression, Kaplan-Meier curves, Receiver Operating Characteristic (ROC) curves, and correlation of clinical indicators in tumor patients were used to assess the prognostic significance of LDHs in pan-cancer. The TCGA, HPA, TIMER, UALCAN, TISIDB, and Cellminer databases were used to investigate the correlation between the expression of LDHs and immune subtypes, immune checkpoint genes, methylation levels, tumor mutational load, microsatellite instability, tumor-infiltrating immune cells and drug sensitivity. The cBioPortal database was also used to identify genomic abnormalities of LDHs in pan-cancer. A comprehensive assessment of the biological functions of LDHs was performed using GSEA. In vitro, HepG2 and Huh7 cells were transfected with LDHD siRNA and GFP-LDHD, the proliferation capacity of cells was examined using CCK-8, EdU, and colony formation assays; the migration and invasion of cells was detected by wound healing and transwell assays; western blotting was used to detect the levels of MMP-2, MMP-9, E-cadherin, N-cadherin and Akt phosphorylation.

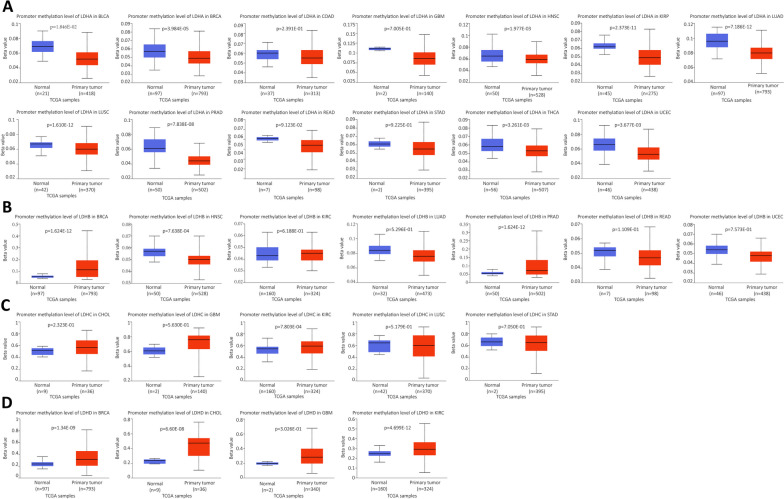
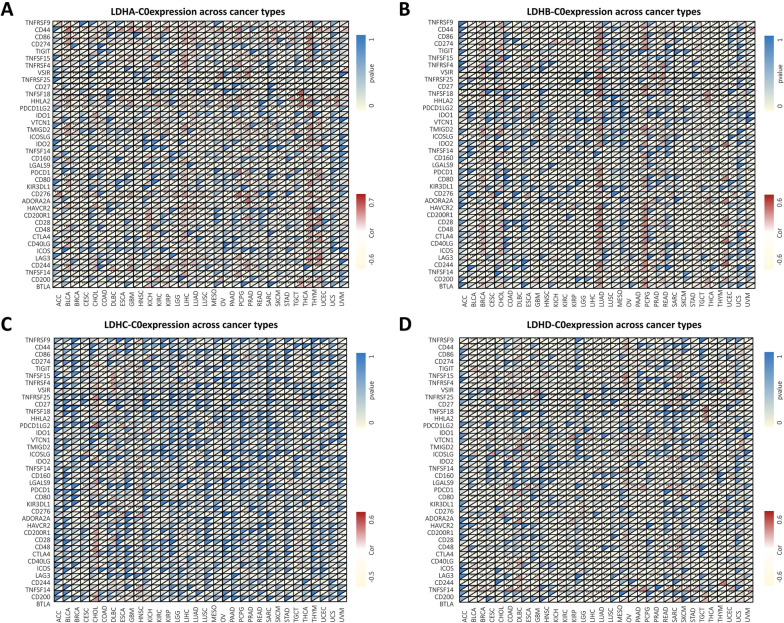
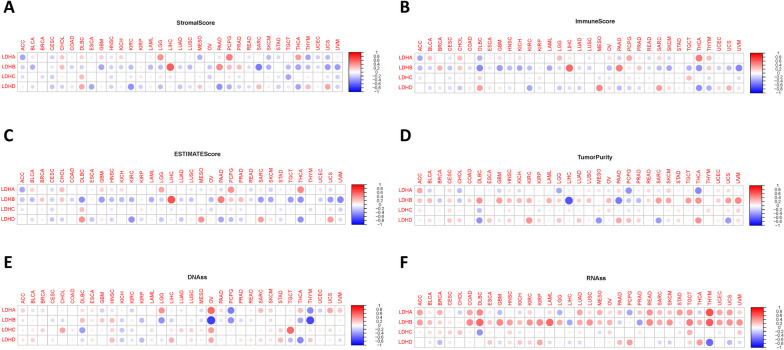
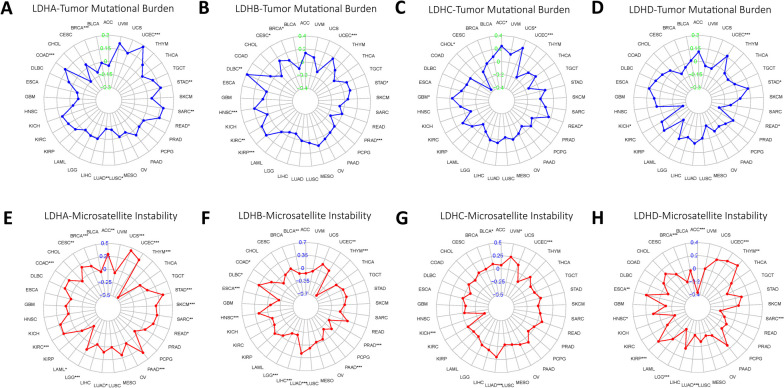
Results: LDHs were differentially expressed in a variety of human tumor tissues. LDHs subtypes can act as pro-oncogenes or anti-oncogenes in different types of cancer and have an impact on the prognosis of patients with tumors by influencing their clinicopathological characteristics. LDHs were differentially expressed in tumor immune subtypes and molecular subtypes. In addition, LDHs expression correlated with immune checkpoint genes, tumor mutational load, and microsatellite instability. LDHD was identified to play an important role in the prognosis of HCC patients, according to a comprehensive analysis of LDHs in pan-cancer. In HepG2 and Huh7 cells, knockdown of LDHD promoted cell proliferation, migration, and invasion, promoted the protein expression levels of MMP-2, MMP-9, N-cadherin, and Akt phosphorylation, but inhibited the protein expression level of E-cadherin. In addition, LDHD overexpression showed the opposite changes.

Conclusion: LDHs subtypes can be used as potential prognostic markers for certain cancers. Prognostic and immunotherapeutic analysis indicated that LDHD plays an important role in the prognosis of HCC patients. In vitro experiments revealed that LDHD can affect HCC proliferation, migration, and invasion by regulating MMPs expression and EMT via Akt signaling pathway, which provides a new perspective on the anti-cancer molecular mechanism of LDHD in HCC.

Keywords: Bioinformatics; HCC; LDHD; Pan-cancer; Prognostic biomarkers.


Conflict of interest statement

The authors declare no competing interests.

Figures

Fig. 1
Fig. 1
Expression levels and correlations of LDHs family genes in different cancer from the TCGA database. A Differential expression levels of LDHs family genes in different types of cancer; B Expression data from TCGA database showing expression of LDHs family genes in different cancers; color of each small matrix represents differential expression of LDHs family genes in different cancers, red and green represent high and low expression; C Correlation between LDHs family genes, red indicates negative positive correlation and blue indicates positive negative correlation; D The expression differences of LDHs family genes in different cancer tissues and normal tissues based on the UCSC-Xena database; E The difference expression of LDHs family genes in different cancer tissues and normal tissues from the TIMER database
Fig. 2
Fig. 2
Associations between LDHs expression levels and disease specific survival (DSS), disease free interval (DFI) and progression free interval (PFI). A Forest plot of LDHs family gene expression levels in pan-cancer in association with DSS; B Forest plot of LDHs family gene expression levels in pan-cancer associated with DFI; C Forest plot of LDHs family gene expression levels in pan-cancer associated with PFI
Fig. 3
Fig. 3
Different colored lines represent the risk values of different genes in the tumor in the cox regression analysis of the association between LDHs family gene expression and survival. A risk ratio < 1 indicates a low risk and a risk ratio > 1 indicates a high risk
Fig. 4
Fig. 4
Characterization of the genetic alterations in the LDHs families. A General profile of genetic alterations in LDHs families from the pan-cancer dataset in the cBioportal database; B Frequency of LDHA alterations from the cBioportal database, dot plots showing the correlation between LDHA copy number and mRNA expression in cBioportal and the number of LDHA mutations in the pan-cancer dataset; C Alteration frequency of LDHB from the cBioportal database, dot plots showing the correlation between copy number and mRNA expression of LDHB from cBioportal and the number of LDHB mutations in pan-cancer; D From the cBioportal database, the dot plot shows the correlation between copy number and mRNA expression of LDHC from cBioportal and the number of mutations in LDHC in pan-cancer; E The frequency of LDHD alterations from the cBioportal database, the dot plot shows the correlation between LDHD copy number and mRNA expression in cBioportal and the number of LDHD mutations in pan-cancer
Fig. 5
Fig. 5
Promoter methylation levels of LDHs in cancers. A The promoter methylation levels of LDHA in different types of cancer; B The promoter methylation levels of LDHB in different types of cancer; C LDHC promoter methylation in different cancers; D Promoter methylation levels of LDHD in different cancers
Fig. 6
Fig. 6
Relationship between the expression of LDHs in pan-cancer and genes of immune checkpoint (ICP). Co-expression relationship between immune checkpoint (ICP) genes and LDHA (A), LDHB (B), LDHC(C) and LDHD (D)
Fig. 7
Fig. 7
Correlation between the expression of LDHs family genes and the tumor microenvironment and stemness score in pan-cancer. A-D Correlation between LDHs family gene expression in pan-cancer and StromalScore, ImmuneScore, ESTIMATESocre and TumorPurity scores. Red dots indicate a positive correlation between expression in the tumor and StromalScore. Blue dots indicate a negative correlation between expression in the tumor and StromalScore; E–F Correlation between the expression of genes of the LDHs family in pan-cancer and DNAss and RNAss. Red dots indicate a positive correlation between oncogene expression and immune score, blue dots indicate a negative correlation
Fig. 8
Fig. 8
Correlation of TMB and MSI with LDHs family gene expression. A-D Correlation between TMB and LDHs family gene expression; EH Correlation between MSI and LDHs family gene expression
Fig. 9
Fig. 9
Correlation between LDHs family genes and Pearson's drug sensitivity scores in different tumor cell lines from the CellMiner database. drug sensitivity analysis of LDHs family genes. Drug sensitivity was analyzed with LDHA (A), LDHB (B), LDHC (C) and LDHD (D), the X-axis indicates the relative sensitivity to certain drugs, the Y-axis indicates the relative expression of LDHs
Fig. 10
Fig. 10
Knockdown or overexpression of LDHD affects the proliferation of HCC cell. A Western Blotting was used to detect the transfection efficiency of LDHD siRNA and GFP-LDHD in HepG2 and Huh7 cells; B CCK-8 assay was used to detect the cell viability; The effects of LDHD siRNA and GFP-LDHD on the proliferation of HepG2 and Huh7 cells were detected using EdU (C) and colony formation (D) assays. *P < 0.05, **P < 0.01, ***P < 0.001 vs. NC group
Fig. 11
Fig. 11
Knockdown or overexpression of LDHD affects HCC cell migration and invasion. A Wound healing assay was used to investigate the effects of LDHD siRNA and GFP-LDHD on HepG2 and Huh7 cell migration; B Transwell assay was used to determine the effects of LDHD siRNA and GFP-LDHD on HepG2 and Huh7 cell migration and invasion; C Western Blotting was performed to measure the expression levels of N-cadherin, E-cadherin, MMP-2, MMP-9 and Akt phosphorylation after LDHD siRNA and GFP-LDHD transfection in HepG2 and Huh7 cell lines. *P < 0.05, **P < 0.01, ***P < 0.001 vs. NC group

Similar articles

Cited by

References

    1. Siegel RL, Miller KD, Wagle NS, Jemal A. Cancer statistics, 2023. CA. 2023;73:17–48. - PubMed
    1. Sung H, Ferlay J, Siegel RL, Laversanne M, Soerjomataram I, Jemal A, et al. Global cancer statistics 2020: GLOBOCAN estimates of incidence and mortality worldwide for 36 cancers in 185 Countries. CA. 2021;71:209–49. - PubMed
    1. Onkar SS, Carleton NM, Lucas PC, Bruno TC, Lee AV, Vignali DAA, et al. The great immune escape: understanding the divergent immune response in breast cancer subtypes. Cancer Discov. 2023;13:23–40. doi: 10.1158/2159-8290.CD-22-0475. - DOI - PMC - PubMed
    1. Wang Q, Zhang X, Wei W, Cao M. PET imaging of lung cancers in precision medicine: current landscape and future perspective. Mol Pharm. 2022;19:3471–3483. doi: 10.1021/acs.molpharmaceut.2c00353. - DOI - PubMed
    1. Piawah S, Venook AP. Targeted therapy for colorectal cancer metastases: a review of current methods of molecularly targeted therapy and the use of tumor biomarkers in the treatment of metastatic colorectal cancer. Cancer. 2019;125:4139–4147. doi: 10.1002/cncr.32163. - DOI - PubMed