. 2024 Jan 30;29(1):21.
doi: 10.1186/s11658-024-00536-2.

New insights into the role of mitochondrial metabolic dysregulation and immune infiltration in septic cardiomyopathy by integrated bioinformatics analysis and experimental validation

Affiliations

New insights into the role of mitochondrial metabolic dysregulation and immune infiltration in septic cardiomyopathy by integrated bioinformatics analysis and experimental validation

Yukun Li et al. Cell Mol Biol Lett. .

Abstract

Background: Septic cardiomyopathy (SCM), a common cardiovascular comorbidity of sepsis, has emerged among the leading causes of death in patients with sepsis. SCM's pathogenesis is strongly affected by mitochondrial metabolic dysregulation and immune infiltration disorder. However, the specific mechanisms and their intricate interactions in SCM remain unclear. This study employed bioinformatics analysis and drug discovery approaches to identify the regulatory molecules, distinct functions, and underlying interactions of mitochondrial metabolism and immune microenvironment, along with potential interventional strategies in SCM.

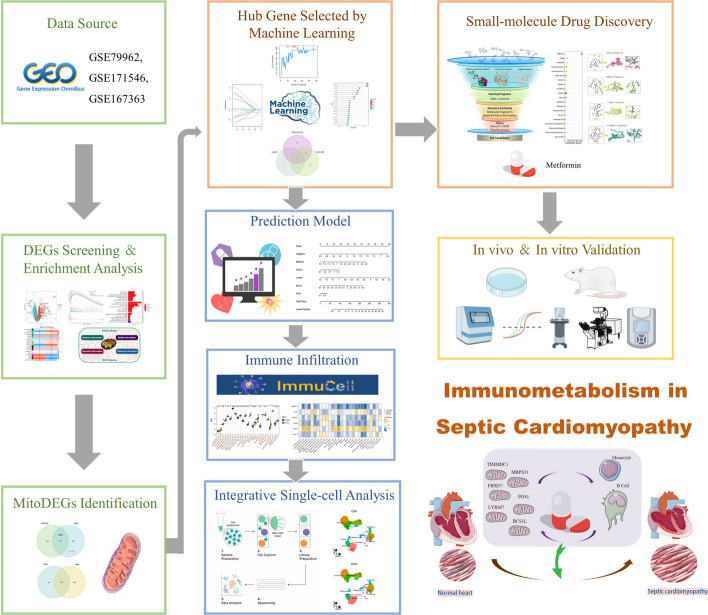
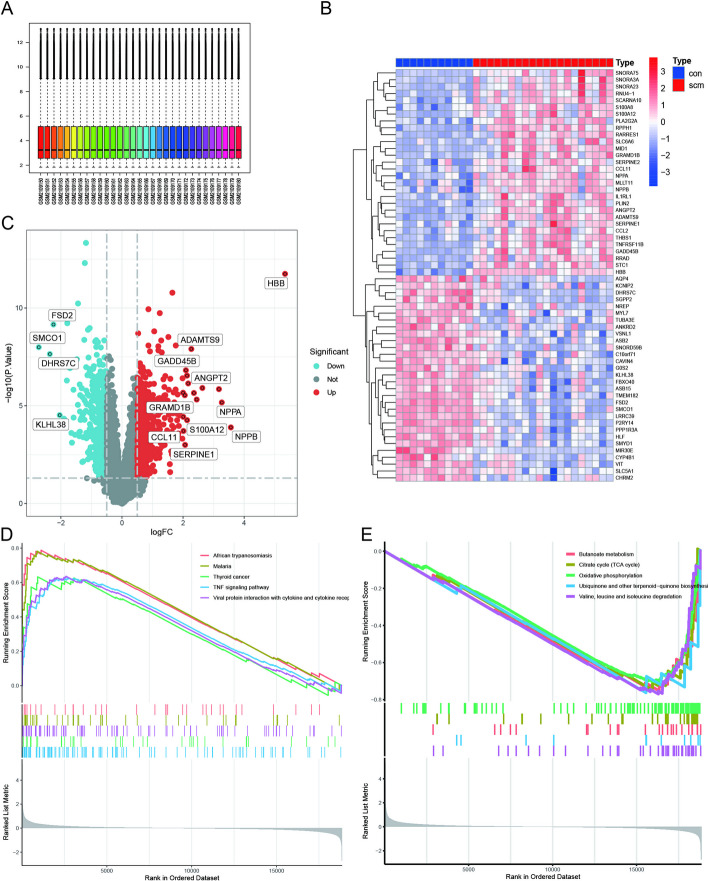
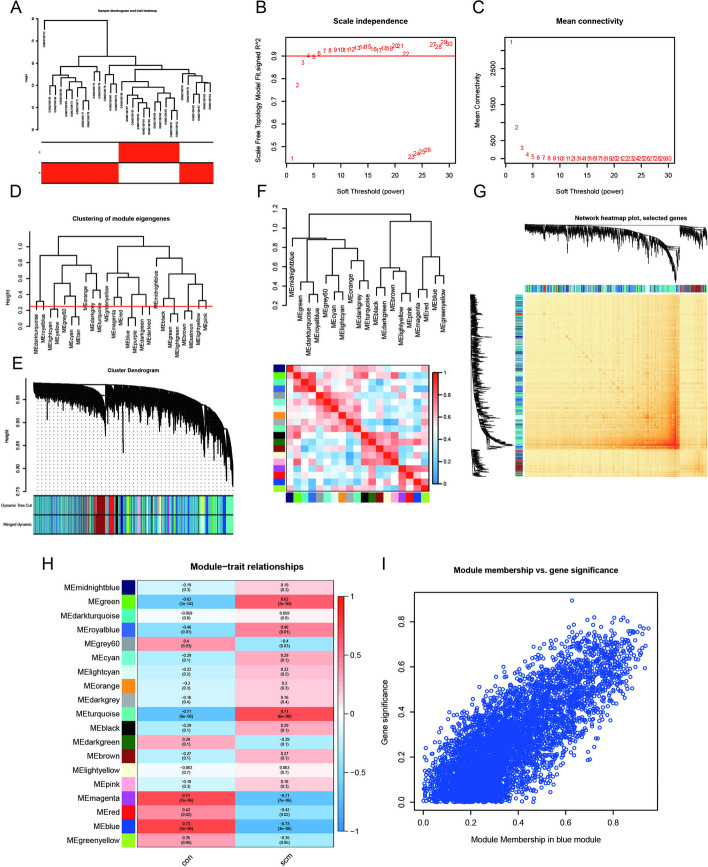
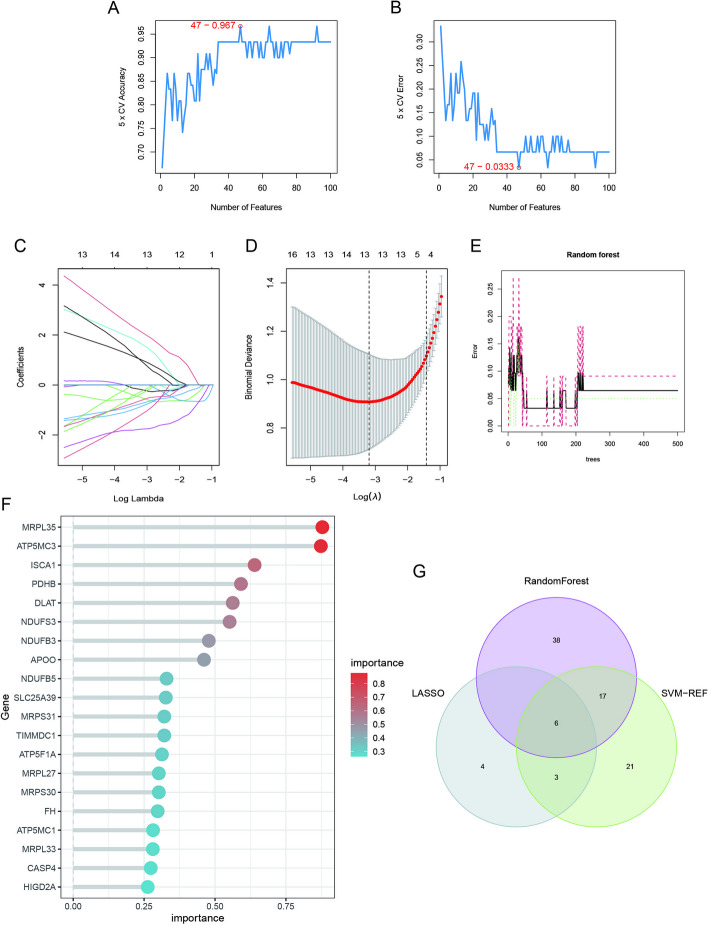
Methods: GSE79962, GSE171546, and GSE167363 datasets were obtained from the Gene Expression Omnibus (GEO) database. Differentially expressed genes (DEGs) and module genes were identified using Limma and Weighted Correlation Network Analysis (WGCNA), followed by functional enrichment analysis. Machine learning algorithms, including support vector machine-recursive feature elimination (SVM-RFE), least absolute shrinkage and selection operator (LASSO) regression, and random forest, were used to screen mitochondria-related hub genes for early diagnosis of SCM. Subsequently, a nomogram was developed based on six hub genes. The immunological landscape was evaluated by single-sample gene set enrichment analysis (ssGSEA). We also explored the expression pattern of hub genes and distribution of mitochondria/inflammation-related pathways in UMAP plots of single-cell dataset. Potential drugs were explored using the Drug Signatures Database (DSigDB). In vivo and in vitro experiments were performed to validate the pathogenetic mechanism of SCM and the therapeutic efficacy of candidate drugs.

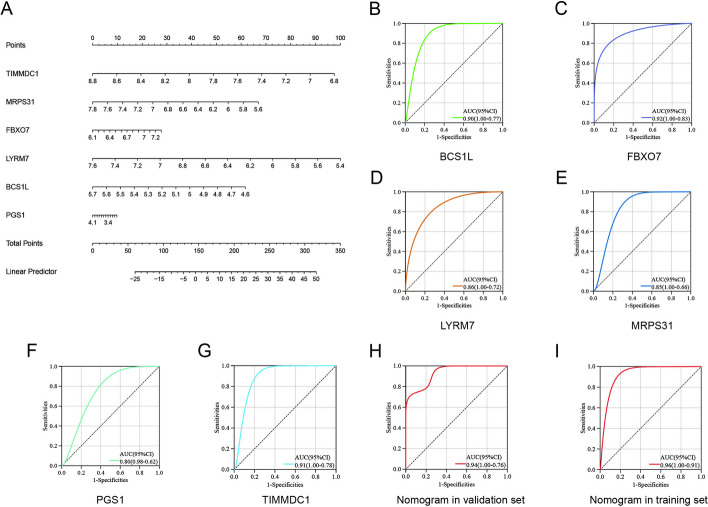
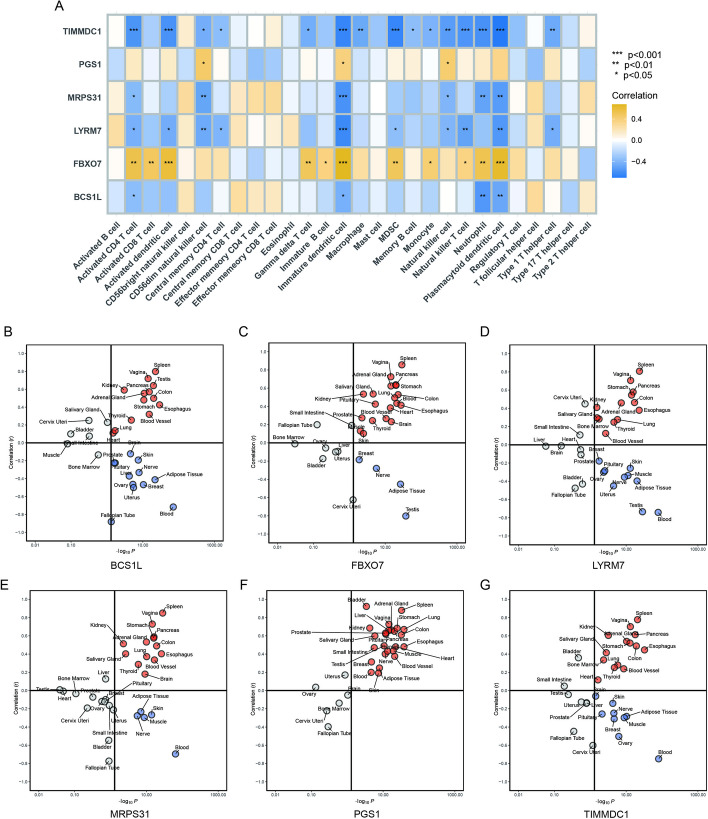
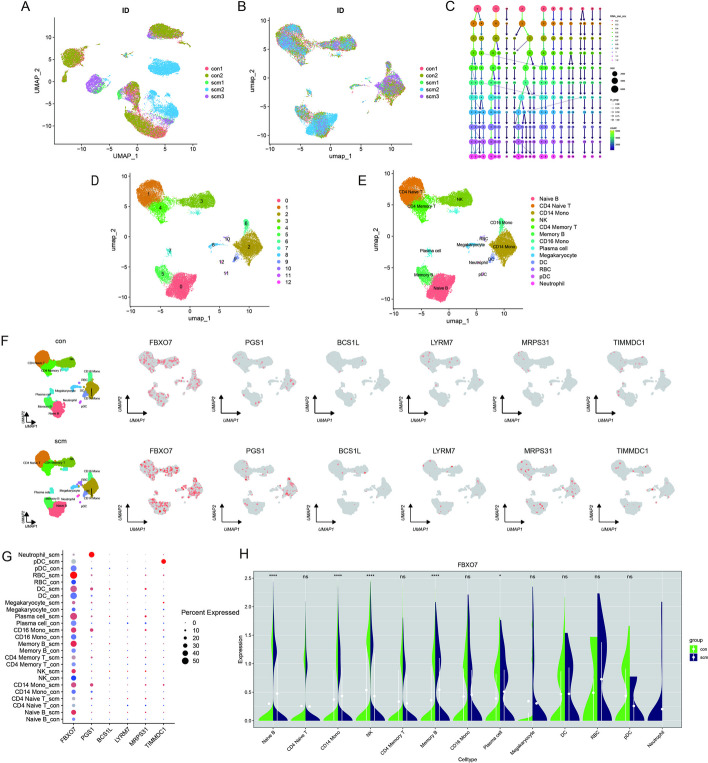
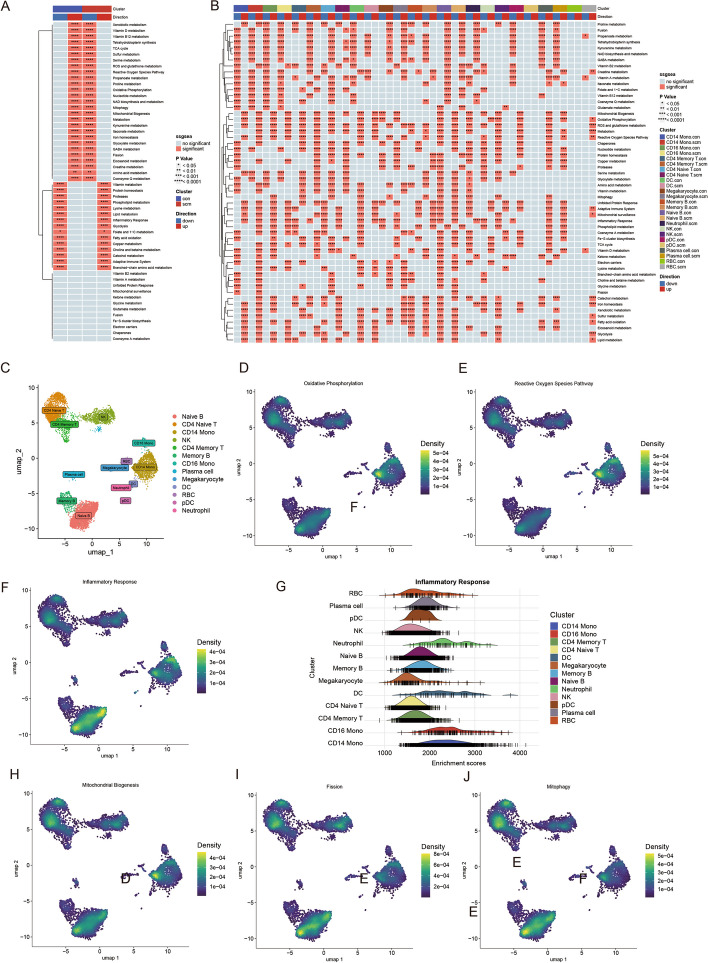
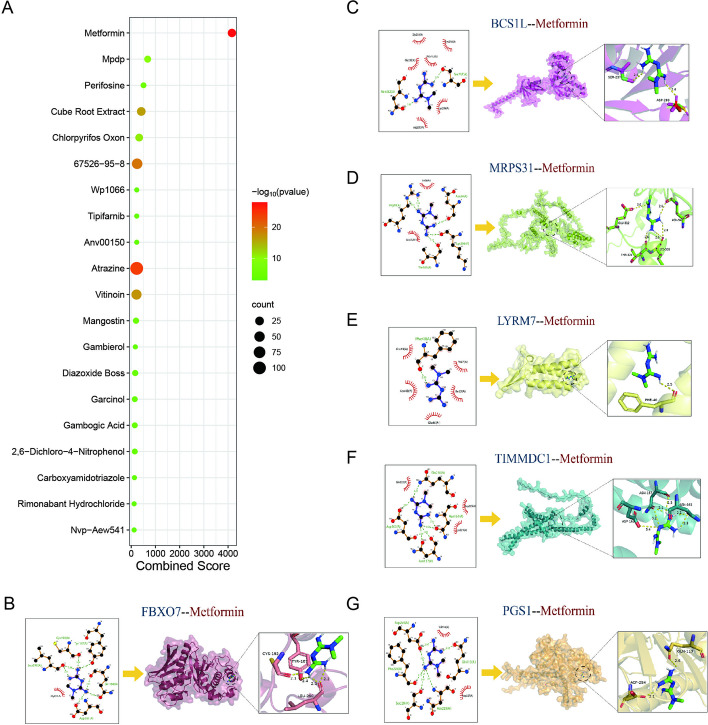
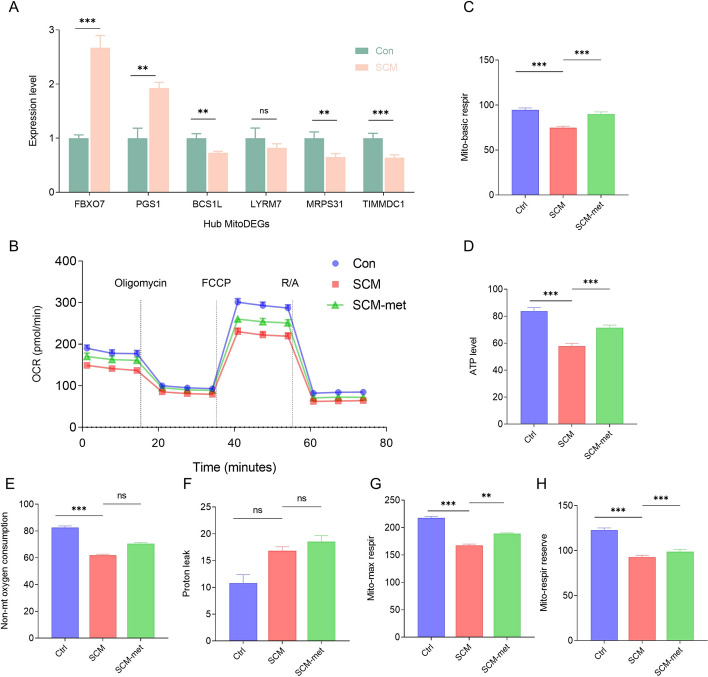
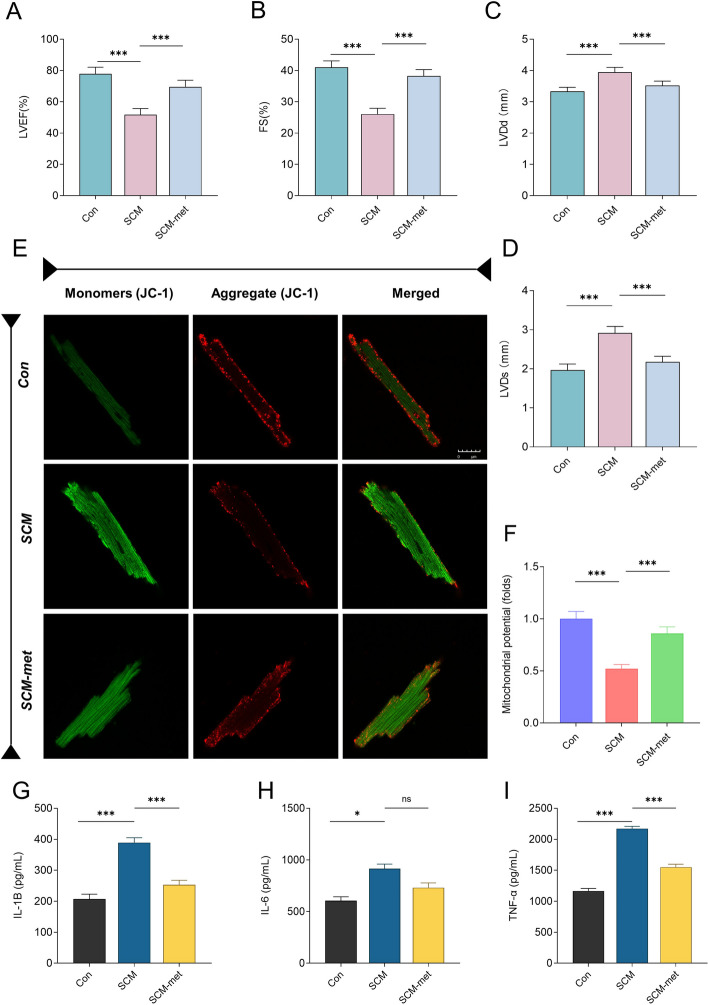
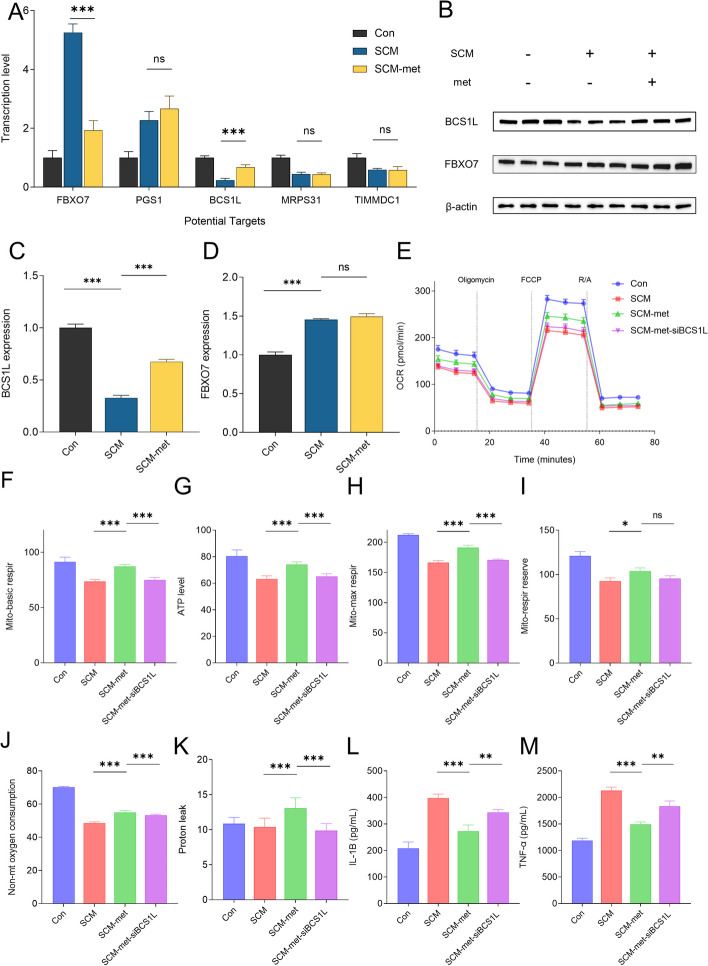
Results: Six hub mitochondria-related DEGs [MitoDEGs; translocase of inner mitochondrial membrane domain-containing 1 (TIMMDC1), mitochondrial ribosomal protein S31 (MRPS31), F-box only protein 7 (FBXO7), phosphatidylglycerophosphate synthase 1 (PGS1), LYR motif containing 7 (LYRM7), and mitochondrial chaperone BCS1 (BCS1L)] were identified. The diagnostic nomogram model based on the six hub genes demonstrated high reliability and validity in both the training and validation sets. The immunological microenvironment differed between SCM and control groups. The Spearman correlation analysis revealed that hub MitoDEGs were significantly associated with the infiltration of immune cells. Upregulated hub genes showed remarkably high expression in the naive/memory B cell, CD14+ monocyte, and plasma cell subgroup, evidenced by the feature plot. The distribution of mitochondria/inflammation-related pathways varied across subgroups among control and SCM individuals. Metformin was predicted to be the most promising drug with the highest combined score. Its efficacy in restoring mitochondrial function and suppressing inflammatory responses has also been validated.

Conclusions: This study presents a comprehensive mitochondrial metabolism and immune infiltration landscape in SCM, providing a potential novel direction for the pathogenesis and medical intervention of SCM.

Keywords: Drug discovery; Immune infiltration; Mitochondrial metabolism; Molecular mechanism; Septic cardiomyopathy.


Conflict of interest statement

The authors declare no potential competing interests.

Figures

Fig. 1
Fig. 1
Flowchart of multistep analysis and validation strategy for bioinformatics data
Fig. 2
Fig. 2
Data preprocessing for differentially expressed genes (DEGs). A Box plots of raw data normalized across samples. B Heatmap of DEG expression. C Volcano plot of DEG expression. D, E Gene set enrichment analysis (GSEA) identified the top five up- and downregulated pathways based on KEGG database
Fig. 3
Fig. 3
Enrichment levels in genomic weighted gene coexpression network analysis (WGCNA). A Sample clustering dendrogram with tree leaves representing each sample. B, C Soft thresholdβ = 7 and scale-free topological fit index (R2). D Similar modules were detected and combined by cutting clustered dendrograms at a height of 0.25. E Initial and merged modules within the clustering tree. F Collinear heat map of module feature genes. Red color represents a high correlation and blue color represents the opposite trend. G Clustering dendrogram of module feature genes. H Heat map of module-trait correlations. I scatter plot for the blue module
Fig. 4
Fig. 4
Feature gene selection. A, B Signature gene expression was screened based on the support vector machine recursive feature elimination (SVM-RFE) algorithm. C, D Adjusting feature selection using the least absolute shrinkage and selection operator (LASSO) algorithm. E Random forest error rate versus the number of classified trees. F The top 20 key genes. G Venn diagram of the six hub genes obtained from the intersection of results from SVM-RFE, RF, and LASSO algorithms
Fig. 5
Fig. 5
Nomogram construction and evaluating the diagnostic value. A Visualization of the nomogram for SCM diagnosis. BI ROC curve for each candidate gene (BCS1L, FBXO7, LYRM7, MRPS31, PGS1, and TIMMDC1) and the nomogram in both the training and validation sets show its significant diagnostic value for SCM
Fig. 6
Fig. 6
Correlation and pantissue analysis between six hub genes and inflammation disorder. A Correlation between hub genes and immune cells. BG Pantissue analysis of the correlation between the expression of six hub genes and hallmark-inflammatory responses in 31 types of tissues based on the GTEx database
Fig. 7
Fig. 7
Comparison of single-cell analysis before and after normalization. A UMAP plots representing batch effects from replicates before Harmony, B UMAP plots showing the correction of batch effects after Harmony. C Clustree plot for determining resolution with principal components (PCs). D Unified manifold approximation and projection clustering into 13 clusters. E Cells from human peripheral blood samples were annotated using CellMarker and singleR. F FeaturePlots showing the expression pattern of FBXO7, PGS1, BCS1L, LYRM7, MRPS31, and TIMMDC1 in peripheral blood mononuclear cells (PBMCs) from SCM and control groups. G Dot plot shows the expression levels of hub genes in each cell cluster. H The violin plot displays the gene expression of FBXO7 in each cell cluster. *p < 0.05, **p < 0.01, ***p < 0.001
Fig. 8
Fig. 8
Overview of the mitochondria/inflammation-related pathways of interest at single-cell resolution. A, B Heatmap of gene set enrichment analysis (GSEA) scores for mitochondria/inflammation-related pathways among different patient groups and cell subsets. C UMAP of SCM scRNA-seq datasets with cluster annotations. DJ Density scatterplot and ridge plot reflecting the distribution of mitochondria/inflammation-related pathways of interest in the SCM group. *p < 0.05; **p < 0.01; ***; p < 0.001
Fig. 9
Fig. 9
Prediction of the top 20 candidate drugs for SCM based on mitoDEGs. A The top 20 most significant candidate compounds were predicted for MitoDEGs using the DSigDB database. BG Molecular docking between MitoDEGs and metformin
Fig. 10
Fig. 10
Confirmation of hub MitoDEG expression and the key role of mitochondrial dysfunction in the pathogenesis of SCM. A mRNA expression of the hub MitoDEGs between the control and SCM groups. B Analysis of HL-1 mitochondrial metabolism with Seahorse XFe96 Analyzer. OCR was monitored continuously at baseline and after the addition of oligomycin (2 mM), FCCP (1 mM), and R/A (0.5 mM). CH Basal respiration, maximal respiration, nonmitochondrial oxygen consumption, spare respiratory capacity, proton leak, and ATP production levels. Mitochondrial metabolism is impaired in the SCM group. OCR, oxygen consumption rate; FCCP, carbonyl cyanide-4-phenylhydrazone; R/A, rotenone and antimycin A (N = 8 independent cell samples per group). *p < 0.05, **p < 0.01, ***p < 0.001
Fig. 11
Fig. 11
Metformin improves cardiac function by alleviating mitochondrial injury and inflammatory response in mice with SCM. AD Results of echocardiography. LVEF, left ventricular ejection fraction; FS, left ventricular fraction shortening; LVDd, left ventricular diastolic dimension; LVDs, left ventricular systolic dimension. E, F Analysis of the mitochondrial membrane potential in isolated cardiomyocytes loaded with JC-1. GI Comparison of expression of inflammation factors between different groups (N = 6 mice or eight independent cell samples per group). *p < 0.05, **p < 0.01, ***p < 0.001
Fig. 12
Fig. 12
Metformin can potentially regulate the immune-metabolic microenvironment in SCM by targeting BCS1L. A mRNA expression of potential targets in the control, SCM, and SCM–metformin groups. BD Proteins were isolated from cardiomyocytes in the control, SCM, and SCM–metformin groups, and the levels of BCS1L and FBXO7 were determined by western blotting. EK Analysis of HL-1 mitochondrial metabolism with Seahorse XFe96 Analyzer. OCR was monitored continuously at baseline and after adding oligomycin (2 mM), FCCP (1 mM), and R/A (0.5 mM) to compare basal respiration, maximal respiration, nonmitochondrial oxygen consumption, spare respiratory capacity, proton leak, and ATP production levels among the control, SCM, SCM–metformin, and SCM–metformin–siBCS1L groups. GI Comparison of levels of inflammation factors among different groups (N = 6 mice or eight independent cell samples per group). *p < 0.05, **p < 0.01, ***p < 0.001

Similar articles

Cited by

References

    1. Rudd KE, Johnson SC, Agesa KM, Shackelford KA, Tsoi D, Kievlan DR, et al. Global, regional, and national sepsis incidence and mortality, 1990–2017: analysis for the Global Burden of Disease Study. Lancet. 2020;395:200–211. doi: 10.1016/S0140-6736(19)32989-7. - DOI - PMC - PubMed
    1. Singer M, Deutschman CS, Seymour CW, Shankar-Hari M, Annane D, Bauer M, et al. The third international consensus definitions for sepsis and septic shock (sepsis-3) JAMA. 2016;315:801–810. doi: 10.1001/jama.2016.0287. - DOI - PMC - PubMed
    1. Lin H, Wang W, Lee M, Meng Q, Ren H. Current status of septic cardiomyopathy: basic science and clinical progress. Front Pharmacol. 2020;11:210. doi: 10.3389/fphar.2020.00210. - DOI - PMC - PubMed
    1. Parker MM, Shelhamer JH, Bacharach SL, Green MV, Natanson C, Frederick TM, et al. Profound but reversible myocardial depression in patients with septic shock. Ann Intern Med. 1984;100:483–490. doi: 10.7326/0003-4819-100-4-483. - DOI - PubMed
    1. Bloch A, Berger D, Takala J. Understanding circulatory failure in sepsis. Intensive Care Med. 2016;42:2077–2079. doi: 10.1007/s00134-016-4514-1. - DOI - PubMed

Substances