

Gender trends in Canadian medicine and surgery: the past 30 years
- PMID: 38291424
- PMCID: PMC10829244
- DOI: 10.1186/s12909-024-05071-4
Gender trends in Canadian medicine and surgery: the past 30 years
Abstract
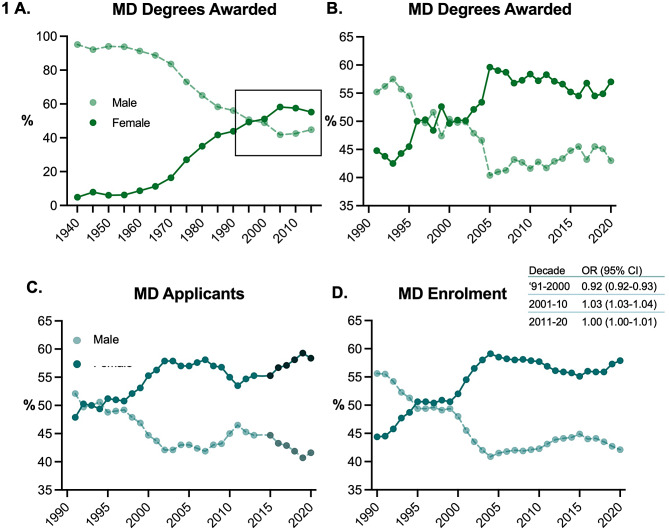
Background: While the number of women entering medicine has steadily increased since the 1970s in Canada, the gender composition along each stage of the medical training pathway has not been comprehensively reported. We therefore sought to systematically examine the gender composition of students, residents, and practicing physicians over the past 30 years in Canada.
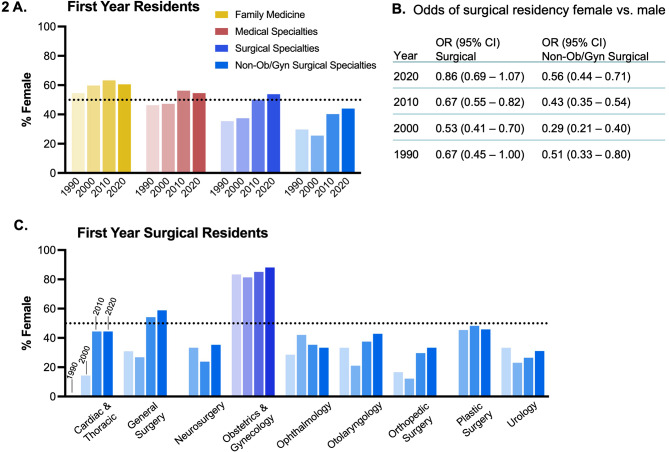
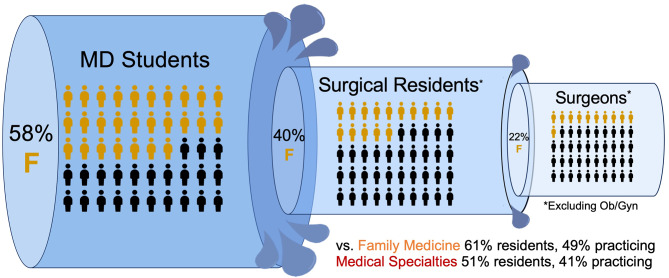
Results: In this cross-sectional analysis of Canadian medical trainees including MD applicants (137,096 male, 169,099 female), MD students (126,422 male, 152, 967 female), MD graduates (29,413 male, 34,173 female), residents by the decade (24,425 male, 28,506 female) and practicing surgeons (total 7,457 male, 3,457 female), we find that increased female representation in medicine is not matched by representation in surgery, with the key being the specialty choice process. The likelihood of female applicants matriculating to medical school was less than male applicants in the 90s (OR 0.92, 95% CI 0.92-0.93), greater in the early 2000s (OR 1.03, 95% CI 1.03-1.04), and has since balanced out (OR 1.00, 95% CI 1.00-1.01), with medical school classes being nearly 60% female for the past two decades. Despite this, females have remained underrepresented in most surgical residency programs, with odds of female medical students entering surgical residency other than Ob/Gyn being about half that of male students (OR 0.56, 95% CI 0.44-0.71), resulting in a slow increase in practicing female surgeons of less than 0.5% per year in many surgical disciplines and projected parity decades or centuries in the future.
Conclusions: While undergraduate medical education has been majority female in Canada for nearly three decades, females remain greatly underrepresented in the physician workforce within surgical specialties. To build a representative medical workforce equipped to care for diverse patient populations, factors influencing the specialty choices of early career physicians will need to be examined and addressed.
Keywords: Canada; Gender; History; Medical education; Medicine; Surgery; Women.
© 2024. The Author(s).
Conflict of interest statement
The authors declare no competing interests.
Figures

References
-
- Quick facts on Canada’s physicians [Internet]. Canadian Medical Association. [cited 2023 Mar 10]. Available from: https://www.cma.ca/quick-facts-canadas-physicians.
MeSH terms
LinkOut - more resources
Full Text Sources
Miscellaneous
