. 2024 Jan 31;43(1):36.
doi: 10.1186/s13046-024-02943-x.

Lactylation stabilizes DCBLD1 activating the pentose phosphate pathway to promote cervical cancer progression

Affiliations

Lactylation stabilizes DCBLD1 activating the pentose phosphate pathway to promote cervical cancer progression

Qingfei Meng et al. J Exp Clin Cancer Res. .

Abstract

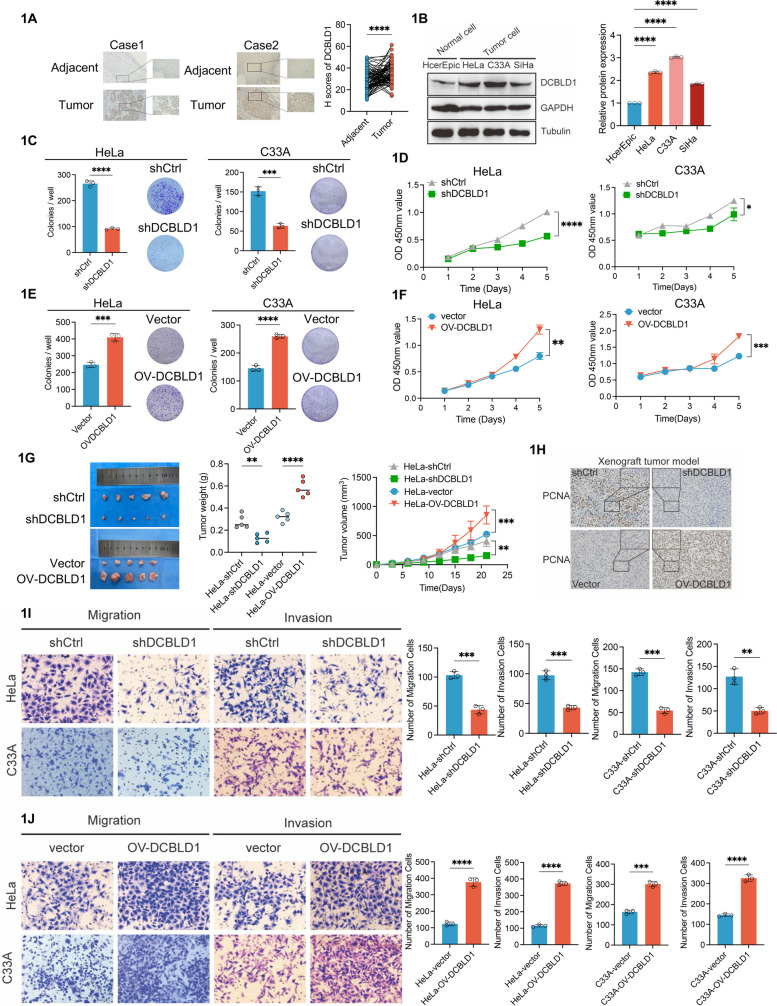
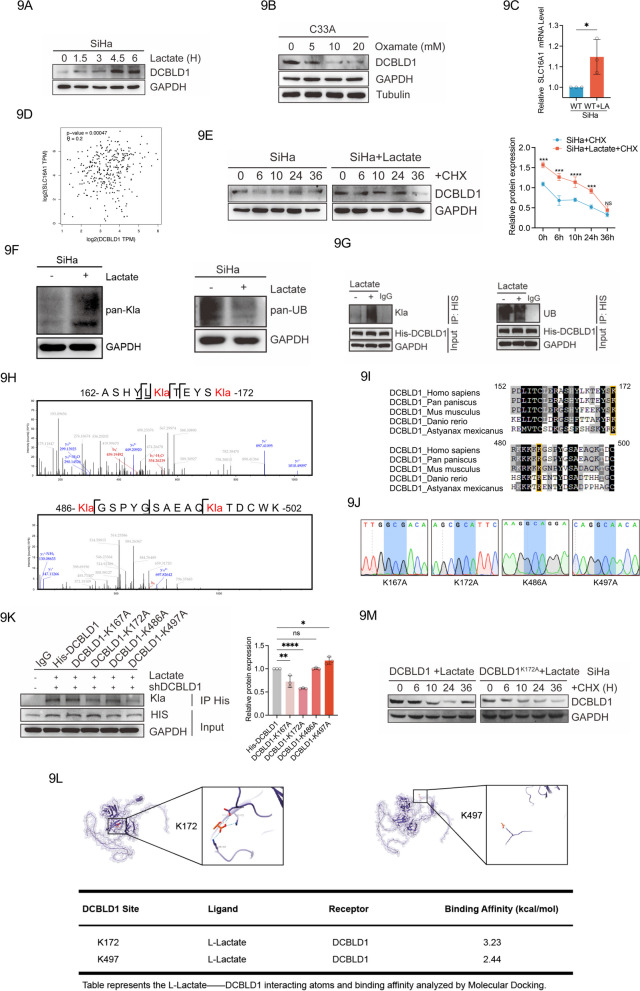
Background: Discoidin, CUB, and LCCL domain-containing type I (DCBLD1) is identified as an oncogene involved in multiple regulation of tumor progression, but specific mechanisms remain unclear in cervical cancer. Lactate-mediated lactylation modulates protein function. Whether DCBLD1 can be modified by lactylation and the function of DCBLD1 lactylation are unknown. Therefore, this study aims to investigate the lactylation of DCBLD1 and identify its specific lactylation sites. Herein, we elucidated the mechanism by which lactylation modification stabilizes the DCBLD1 protein. Furthermore, we investigated DCBLD1 overexpression activating pentose phosphate pathway (PPP) to promote the progression of cervical cancer.

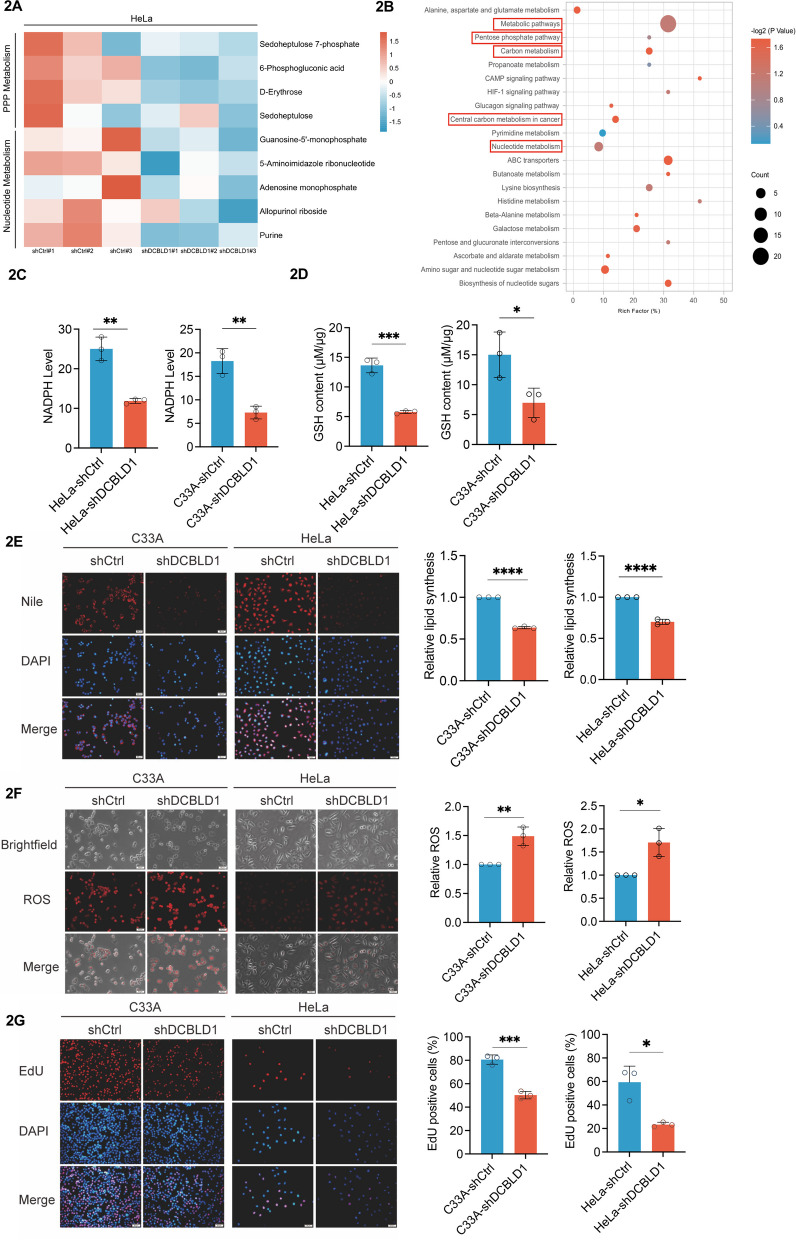
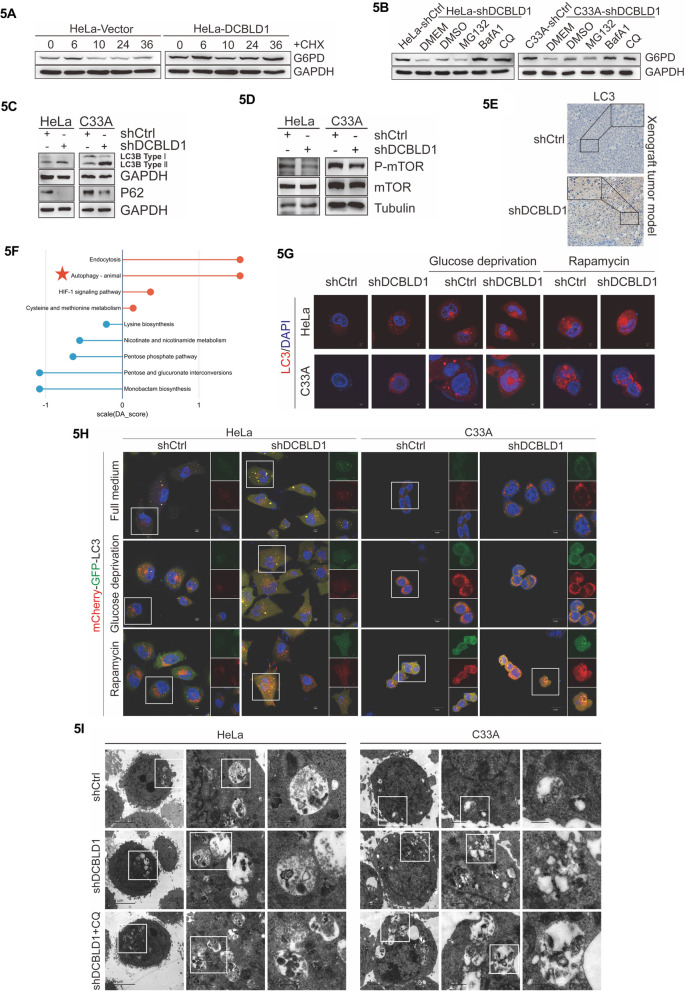
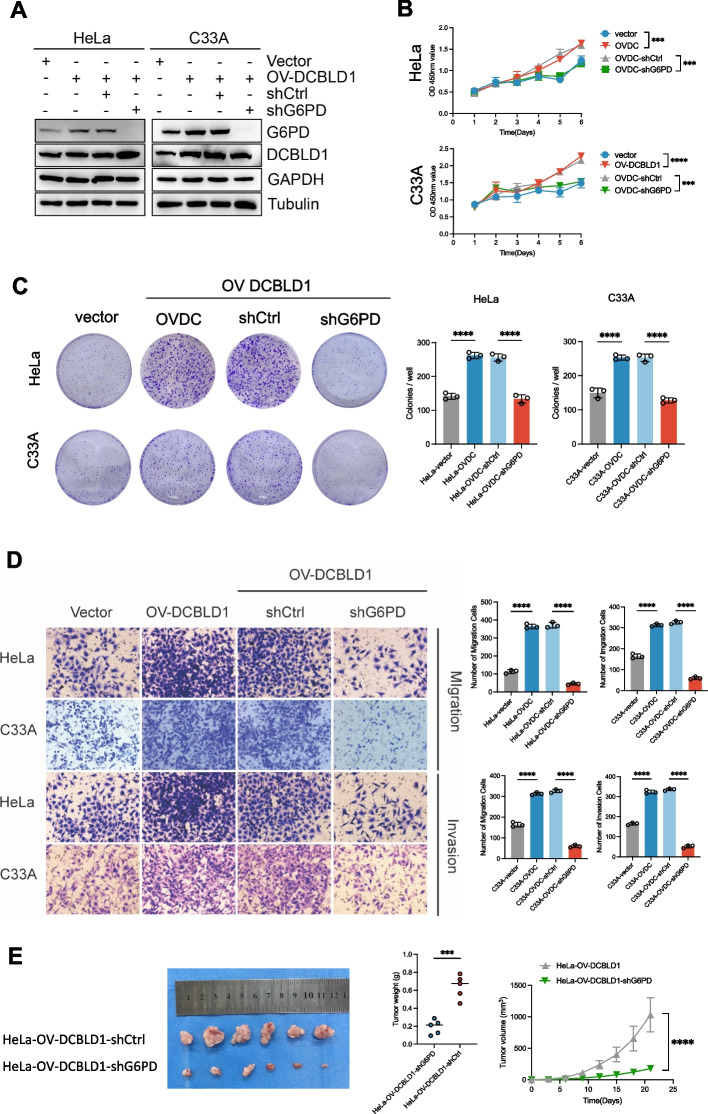
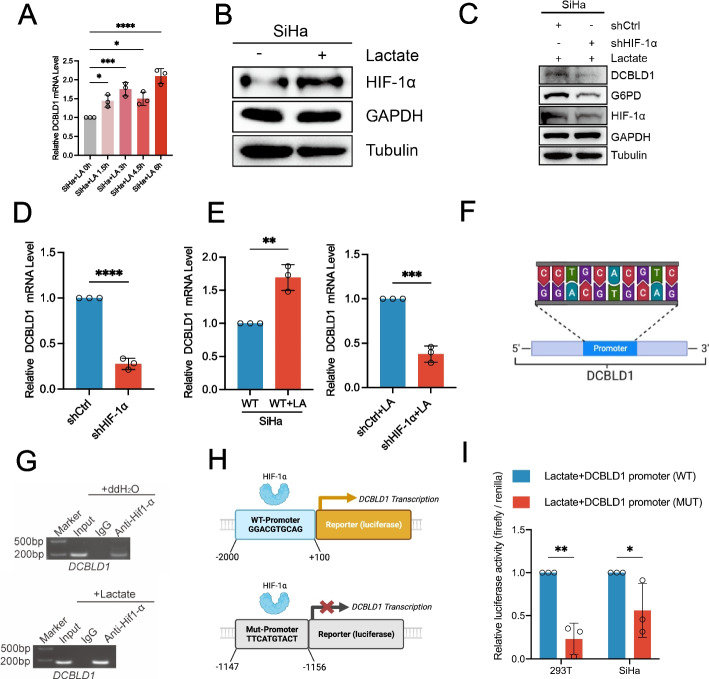
Methods: DCBLD1 expression was examined in human cervical cancer cells and adjacent non-tumorous tissues using quantitative reverse transcription-polymerase chain reaction, western blotting, and immunohistochemistry. In vitro and in vivo studies were conducted to investigate the impact of DCBLD1 on the progression of cervical cancer. Untargeted liquid chromatography-tandem mass spectrometry (LC-MS/MS) metabolomics studies were used to characterize DCBLD1-induced metabolite alterations. Western blot, immunofuorescence and transmission electron microscopy were performed to detect DCBLD1 degradation of G6PD by activating autophagy. Chromatin immunoprecipitation, dual luciferase reporter assay for detecting the mechanism by which lactate increases DCBLD1 transcription. LC-MS/MS was employed to verify specific modification sites within the DCBLD1 protein.

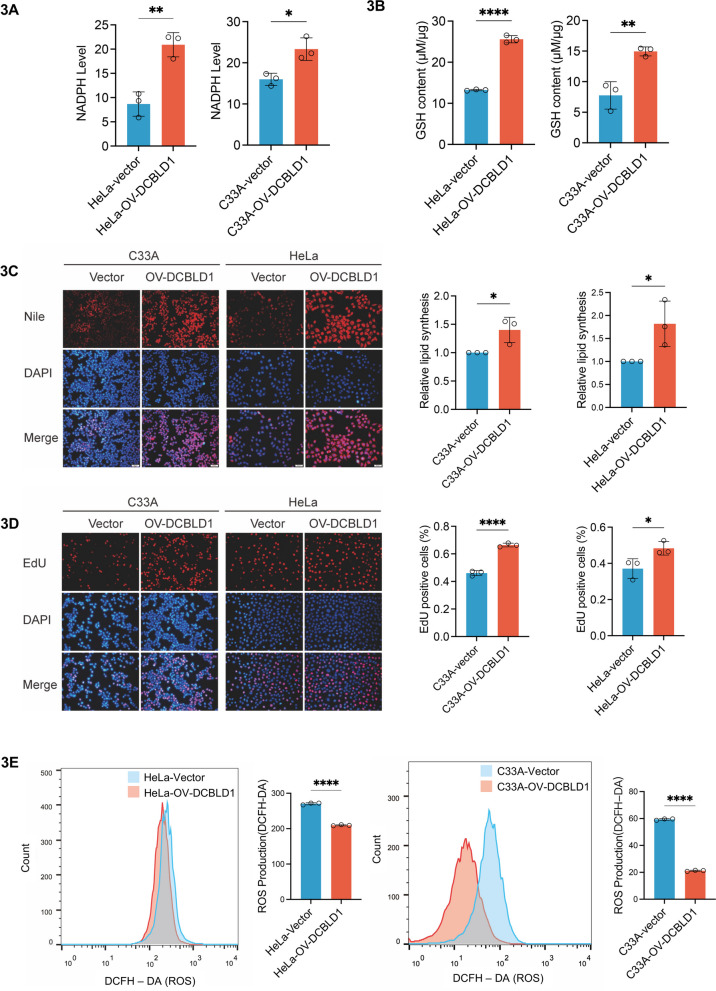
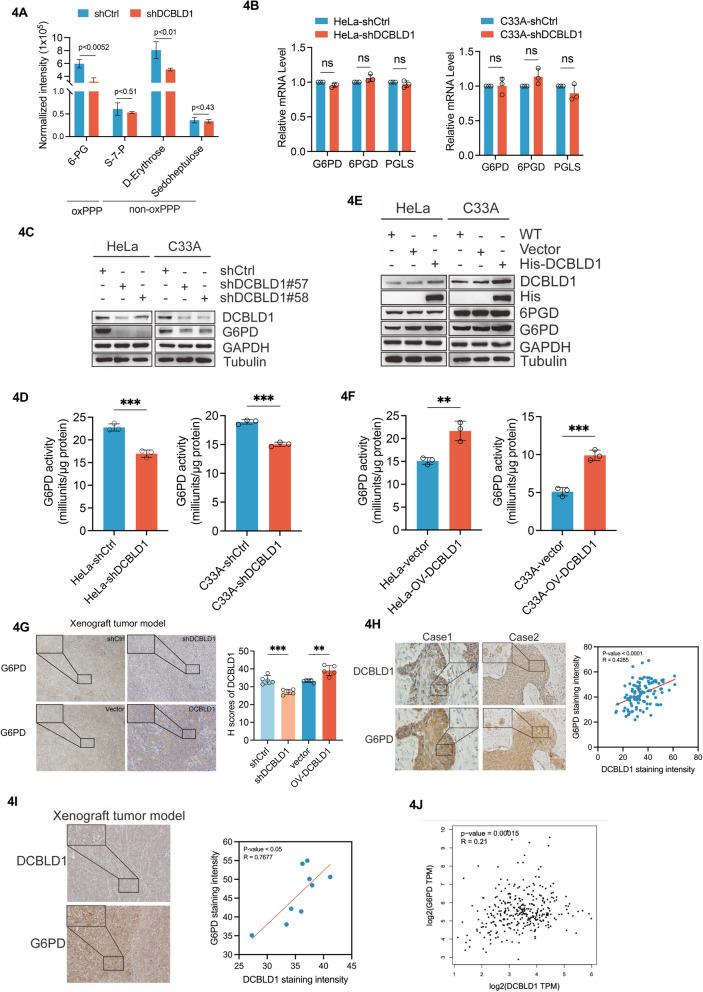
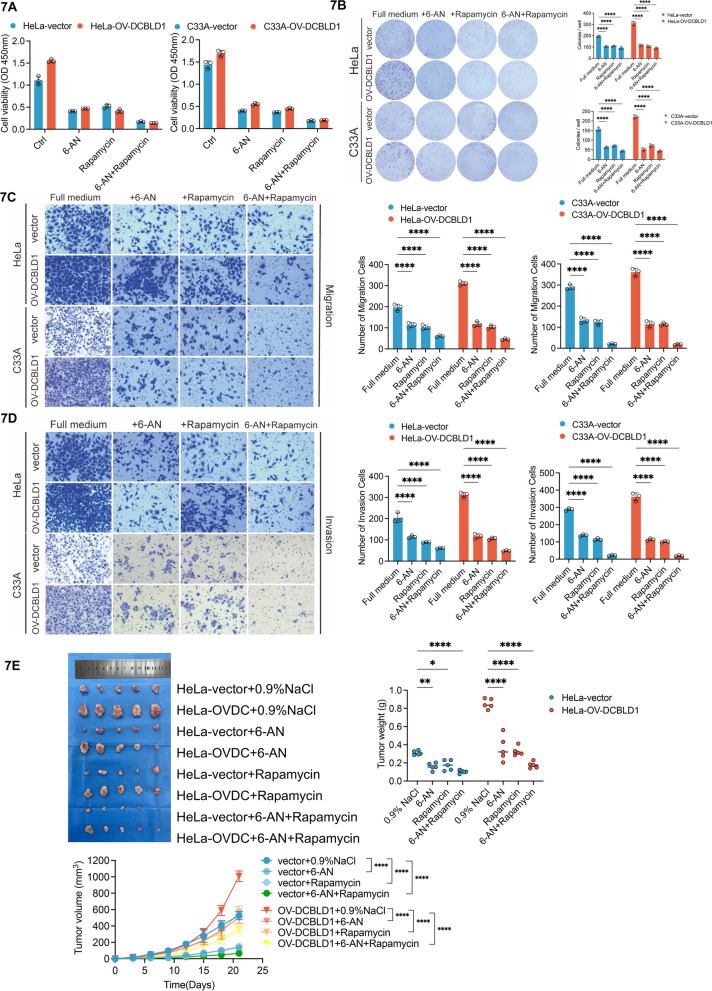
Results: We found that lactate increased DCBLD1 expression, activating the PPP to facilitate the proliferation and metastasis of cervical cancer cells. DCBLD1 primarily stimulated PPP by upregulating glucose-6-phosphate dehydrogenase (G6PD) expression and enzyme activity. The mechanism involved the increased enrichment of HIF-1α in the DCBLD1 promoter region, enhancing the DCBLD1 mRNA expression. Additionally, lactate-induced DCBLD1 lactylation stabilized DCBLD1 expression. We identified DCBLD1 as a lactylation substrate, with a predominant lactylation site at K172. DCBLD1 overexpression inhibited G6PD autophagic degradation, activating PPP to promote cervical cancer progression. In vivo, 6-An mediated inhibition of G6PD enzyme activity, inhibiting tumor proliferation.

Conclusions: Our findings revealed a novel post-translational modification type of DCBDL1, emphasizing the significance of lactylation-driven DCBDL1-mediated PPP in promoting the progression of cervical cancer.

Keywords: Autophagy; Cervical cancer; DCBLD1; G6PD; HIF-1α; Lactylation; Pentose phosphate pathway.


Conflict of interest statement

The authors declare that they have no competing interests.

Figures

Fig. 1
Fig. 1
DCBLD1 promotes cervical cancer progression in vivo and in vitro. A IHC staining for DCBLD1 was performed on tumor sections of human cervical cancer and adjacent normal tissue. Subsequently, H-scores were plotted. n = 50. B Immunoblotting was used to assess DCBLD1 levels in lysates extracted from various cell lines, including human normal cervical epithelial (HcerEpic) and cervical cancer (HeLa, C33A, and SiHa) cells. GAPDH and Tubulin are used as loading controls. The graph on the right is a statistical plot of the western blot. C, E The cell proliferation rate was determined using a clone formation assay. D, F Cell viability was determined using CCK8 assays. G Xenograft tumor images derived from HeLa cells. n = 5 mice per group. Tumor growth curves of the different groups. Weight of the excised tumors in each group. H Sections of tumor tissue from the xenograft tumor model were subjected to PCNA staining. IJ Transwell migration and invasion assays were performed on HeLa and C33A cells, stably expressing shCtrl, shDCBLD1, vector, and OV-DCBLD1. Data are presented as mean ± SD. Statistical significance was assessed using an unpaired t test (for panels A, CF, and G for tumor volume, as well as IJ), a one-way ANOVA with Dunnett's multiple comparisons test (B), or a one-way ANOVA with the Brown-Forsythe test (G for tumor weight). (****, p < 0.0001; ***, p < 0.001; **, p < 0.01; *, p < 0.05).Scale bar: 50 µm
Fig. 2
Fig. 2
DCBLD1 knockdown inhibits PPP. A A heatmap illustrating the down-regulated metabolites in HeLa cells expressing shDCBLD1 compared to shCtrl cells. B KEGG enrichment analysis of differential metabolites. CD Intracellular NADPH and GSH levels were assayed in HeLa and C33A cells expressing shCtrl or shDCBLD1. E Detection of lipid synthesis by Nile Red staining. Representative images (left) and average fluorescence quantification results (right) are shown. F Reactive oxygen species production levels were detected using ROS staining. Representative images (left) and the average fluorescence quantification results (right) are shown. G DNA synthesis in HeLa and C33A cells expressing shCtrl or shDCBLD1 was determined using EdU. EdU-positive cell proportion was analyzed using ImageJ. Representative images (left) and the quantification results (right) are shown. Data are presented as mean ± SD. Statistical significance was assessed using an unpaired t test (C-G). (****, p < 0.0001; ***, p < 0.001; ***, p < 0.001; **, p < 0.01; *, p < 0.05). Scale bar: 50 µm
Fig. 3
Fig. 3
DCBLD1 overexpression activates the PPP. A, B Intracellular NADPH and GSH levels were measured in HeLa and C33A cells expressing either the vector or OV-DCBLD1. C Lipid synthesis detection using Nile Red staining. Representative images (left) and the average fluorescence quantification results (right) are shown. D DNA synthesis in HeLa and C33A cells expressing the vector or OV-DCBLD1 was determined using EdU. EdU-positive cell proportion was analyzed using ImageJ. Representative images (left) and the quantification results (right) are shown. E DCFH-DA was used to examine ROS in the cytoplasm of HeLa and C33A cells. Representative images obtained through flow cytometry are shown (left), with corresponding histograms presented on the right side. Data are shown as mean ± SD. Statistical significance was assessed using an unpaired t test (A-E). (****, p < 0.0001; **, p < 0.01; *, p < 0.05). Scale bar: 50 µm
Fig. 4
Fig. 4
G6PD mediated PPP activation by DCBLD1. A A histogram depicting the downregulated levels of pentose phosphate pathway metabolites in HeLa cells expressing shDCBLD1 compared to shCtrl cells. B Determination of the mRNA levels of pentose phosphate pathway-related enzymes in transduced cells by qPCR. C, E Immunoblotting was used to detect DCBLD1, His, 6PGD, and G6PD levels in cell lysates. GAPDH was used as a loading control. D, F G6PD activity was examined in these cells. G IHC staining for DCBLD1 and G6PD was performed on tumor sections obtained from a xenograft tumor model. H IHC staining for DCBLD1 and G6PD was perform on tumor sections of human cervical cancer and corresponding adjacent normal tissue. I IHC staining for DCBLD1 and G6PD was performed on tumor tissue sections from the xenograft tumor model at the same site. The area of optical density/positive staining area was quantified using ImageJ and further analyzed using GraphPad Prism. J DCBLD1 and G6PD correlation analysis using TCGA database. Data are presented as mean ± SD. Statistical significance was assessed using the multiple unpaired t test (B), the unpaired t test (D and F), a one-way ANOVA with Tukey's multiple comparisons test (G), and correlation analysis (H and I). (***, p < 0.001; **, p < 0.01; NS, no significance). Scale bar: 50 µm
Fig. 5
Fig. 5
DCBLD1 inhibits the autophagic degradation of G6PD. A HeLa cells expressing both the vector and DCBLD1 were treated with 10 μg/ml CHX for the specified durations. Whole-cell extracts (WCE) were collected for immunoblotting to detect G6PD levels in the cells. GAPDH was used as a loading control. B HeLa and C33A cells expressing shDCBLD1 were treated with MG132 (10 μm), BafA1 (200 nM), and CQ (25 μm) for 24 h. WCE were collected for immunoblotting to detect G6PD in the cells. GAPDH was used as a loading control. C, D HeLa and C33A cells expressing shCtrl and shDCBLD1, and WCE were collected for immunoblotting to detect LC3 I, LC3 II, P62, and mTOR/P-mTOR levels in the cells. GAPDH and Tubulin were used as loading controls. E Tumor sections from the xenograft tumor model were stained with IHC for LC3. F A statistical plot illustrating metabolite changes in HeLa cells expressing shDCBLD1 than those expressing shCtrl. G HeLa and C33A cells expressing shCtrl and shDCBLD1 were cultured under conditions of glucose deprivation and treated with Rapamycin (25 nM) for 24 h. LC3 puncta formation was subsequently detected through immunostaining. Scale bar: 1 μm. H Representative confocal images of GFP-LC3 and mRFP-LC3 distribution in HeLa and C33A cells transfected with DCBLD1 shRNA vector, both with or without rapamycin treatment and glucose deprivation for 24 h. Scale bar: 5 μm. I Representative images illustrating the autophagic structures in HeLa and C33A cells transfected with the DCBLD1 shRNA vector, both with or without CQ treatment for 24 h (25 μM). Scale bar: 2 μm, 1 μm, and 0.5 μm
Fig. 6
Fig. 6
G6PD knockdown blocks DCBLD1-induced increases in cell proliferation, migration, and invasion. A Immunoblotting was used to detect DCBLD1 and G6PD levels in cell lysates. GAPDH was used as a loading control. B Cell viability was determined using CCK8 assays. C Cell proliferation rate was determined using clone formation assay. D Transwell migration and invasion assays were performed on HeLa and C33A cells, stably expressing vector, OV-DCBLD1, OV-DCBLD1-shCtrl, and OV-DCBLD1-shG6PD. E Xenograft tumor images derived from HeLa cells. n = 6 mice per group. Tumor growth curves of the different groups. Weight of the excised tumors in each group. Data are presented as mean ± SD. Statistical significance was assessed using a one-way ANOVA with the Brown-Forsythe test (B, C, and D) or an unpaired t test (E). (****, p < 0.0001; ***, p < 0.001). Scale bar: 50 µm
Fig. 7
Fig. 7
G6PD pharmacological inhibition blocks DCBLD1-induced increases in cell proliferation, migration, and invasion. A HeLa and C33A cells, which were stably expressing both the vector and OV-DCBLD1, were treated with 6-AN (120 nM) and rapamycin (25 nM) either individually or in combination. B Cell viability was determined through CCK8 assays, while the cell proliferation rate was determined using the clone formation assay. C, D Transwell migration and invasion assays were performed on HeLa and C33A cells, stably expressing the vector and OV-DCBLD1 after 24 h treatment with 6-AN (120 nM) and Rapamycin (25 nM) individually or in combination. E A total of 1 × 106 HeLa-vector and HeLa-OV-DCBLD1 cells were injected subcutaneously into the right abdomen of 4- to 5-week-old female nude mice (n = 5). Images show xenograft tumors in nude mice after treatment with 4 mg/kg/2d 6-An and 2 mg/kg/2d Rapamycin individually or in combination. Tumor size was measured every 5 days for 3 weeks. Scale bars: 10 mm. n = 6 mice per group. Tumor growth curves of the different groups. Weight of the excised tumors in each group. Data are presented as mean ± SD. Statistical significance was assessed using a one-way ANOVA with the Brown-Forsythe test (A), a two-way ANOVA with Šídák's multiple comparisons test (B, C, and D; E for tumor weight), and a one-way ANOVA with Tukey's multiple comparisons test (E for tumor volume). (****, p < 0.0001; **, p < 0.01; *, p < 0.05). Scale bar: 50 µm
Fig. 8
Fig. 8
L-lactate-activated Hif-1α promotes DCBLD1 transcription. A DCBLD1 mRNA levels in SiHa cells, treated with the addition of sodium L-lactate (25 mM) for varying durations, were determined using qPCR. B, C Immunoblotting was performed to determine the Hif-1α level after a 6 h treatment with sodium L-lactate (25 mM). GAPDH was used as a loading control. C Immunoblotting was performed to determine Hif-1α, G6PD, and DCBLD1 levels in SiHa cells transfected with DCBLD1 shRNA vector, both with or without treatment with sodium L-lactate (25 mM). D, E DCBLD1 mRNA levels were determined using qPCR. F JASPAR was used to predict Hif-1α binding sites to the DCBLD1 promoter. G Chip assay for Hif1α binding to the DCBLD1 promoter, with/without sodium L-lactate (25 mM) treatment. H Construction of plasmids for wild-type and mutant (at the 1147–1156) luciferase reporter genes region of the DCBLD1 promoter. I A luciferase reporter gene assay was performed to validate the Hif1α binding site on the DCBLD1 promoter. Data are presented as the mean ± SD. Statistical significance was assessed using a one-way ANOVA with the Brown-Forsythe test (A), an unpaired t test (D and E), or a two-way ANOVA with Šídák's multiple comparisons test (I). (****, p < 0.0001; ***, p < 0.001; **, p < 0.01; *, p < 0.05)
Fig. 9
Fig. 9
Lactylation stabilizes DCBLD1 expression. A Western blot analysis of the changes induced by sodium L-lactate (25 mM) on DCBLD1 at different times. B Western blot analysis of the changes induced by Oxamate (25 mM) on DCBLD1 at different times. C qPCR was performed to determine MCT1 (SLC16A1) mRNA levels in SiHa cells treated with sodium L-lactate (25 mM). D Analysis of the correlation between DCBLD1 and MCT1 (SLC16A1) using TCGA database. E Western blot analysis of DCBLD1 in SiHa cells treated with or without L-lactate (25 mM) and subsequently exposed to cyclohexane (CHX, 10 μg/ml) for the specified duration. The graph on the right is a statistical plot of the western blot. F Western blot analysis of pan-lactylation and pan-ubiquitination in SiHa cells, with and without sodium L-lactate. G Co-IP assay in SiHa cells transfected with the His-DCBLD1 plasmid, with or without L-lactate treatment for 6 h. H LC–MS/MS was performed to confirm the Kla of the DCBLD1 protein and identify specific lactylated modification sites. Specific lactylated modification sites (K167, K172, K486, and K497) were shown. I Species (Home sapiens, Pan paniscus, Mus musculus, Danio rerio, and Astyanax mexicanus) conservation analysis of potential lactylation modification sequence sites for DCBLD1. J Overlap-PCR was used for the construction of mutation plasmids. Sanger sequencing was used to verify whether lysine was mutated to alanine (GCG or GCA). (K) The mutant plasmid was re-expressed in SiHa cells knocked down for DCBLD1, and the DCBLD1 lactylation level was detected using immunoblotting. The graph on the right is a statistical plot of the western blot. (L) The 3D structure of DCBLD1 was predicted using the AlphaFold tool. Auto-Dock 4.0 was used to predict DCBLD1 binding to L-lactate. (M) Western blot analysis of DCBLD1 in SiHa-DCBLD1 KD re-expressing DCBLD1-WT or DCBLD1 K172A cell treated with L-lactate (25 mM) and subsequently exposed to cyclohexane (CHX, 10 μg/ml) for the specified duration. Data are presented as mean ± SD. Statistical significance was assessed using an unpaired t test (C), a two-way ANOVA with Šídák's multiple comparisons test (E), and a one-way ANOVA with Dunnett's multiple comparisons test (K). (****, p < 0.0001; ***, p < 0.001; **, p < 0.01; *, p < 0.05; ns, no significance)

References

    1. UniProt Consortium T UniProt: the universal protein knowledgebase. Nucleic Acids Res. 2018;46(5):2699. doi: 10.1093/nar/gky092. - DOI - PMC - PubMed
    1. Nielsen H. Predicting secretory proteins with signalP. Methods Mol Biol. 2017;1611:59–73. doi: 10.1007/978-1-4939-7015-5_6. - DOI - PubMed
    1. Schmoker AM, Ebert AM, Ballif BA. The DCBLD receptor family: emerging signaling roles in development, homeostasis and disease. Biochem J. 2019;476(6):931–950. doi: 10.1042/BCJ20190022. - DOI - PubMed
    1. Schmoker AM, Weinert JL, Markwood JM, Albretsen KS, Lunde ML, Weir ME, et al. FYN and ABL Regulate the Interaction Networks of the DCBLD Receptor Family. Mol Cell Proteomics. 2020;19(10):1586–1601. doi: 10.1074/mcp.RA120.002163. - DOI - PMC - PubMed
    1. Aten TM, Redmond MM, Weaver SO, Love CC, Joy RM, Lapp AS, et al. Tyrosine phosphorylation of the orphan receptor ESDN/DCBLD2 serves as a scaffold for the signaling adaptor CrkL. FEBS Lett. 2013;587(15):2313–2318. doi: 10.1016/j.febslet.2013.05.064. - DOI - PMC - PubMed