

Reduction of inflammation and mitochondrial degeneration in mutant SOD1 mice through inhibition of voltage-gated potassium channel Kv1.3
- PMID: 38292023
- PMCID: PMC10824952
- DOI: 10.3389/fnmol.2023.1333745
Reduction of inflammation and mitochondrial degeneration in mutant SOD1 mice through inhibition of voltage-gated potassium channel Kv1.3
Abstract
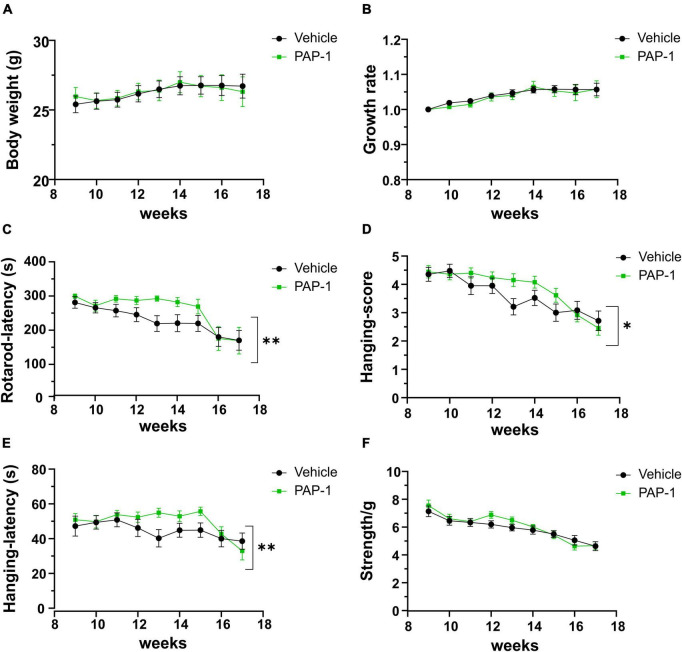
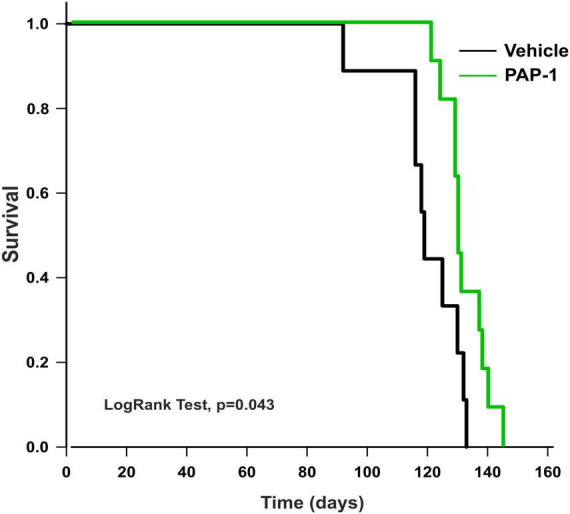
Amyotrophic lateral sclerosis (ALS) is a fatal neurodegenerative disease with no effective therapy, causing progressive loss of motor neurons in the spinal cord, brainstem, and motor cortex. Regardless of its genetic or sporadic origin, there is currently no cure for ALS or therapy that can reverse or control its progression. In the present study, taking advantage of a human superoxide dismutase-1 mutant (hSOD1-G93A) mouse that recapitulates key pathological features of human ALS, we investigated the possible role of voltage-gated potassium channel Kv1.3 in disease progression. We found that chronic administration of the brain-penetrant Kv1.3 inhibitor, PAP-1 (40 mg/Kg), in early symptomatic mice (i) improves motor deficits and prolongs survival of diseased mice (ii) reduces astrocyte reactivity, microglial Kv1.3 expression, and serum pro-inflammatory soluble factors (iii) improves structural mitochondrial deficits in motor neuron mitochondria (iv) restores mitochondrial respiratory dysfunction. Taken together, these findings underscore the potential significance of Kv1.3 activity as a contributing factor to the metabolic disturbances observed in ALS. Consequently, targeting Kv1.3 presents a promising avenue for modulating disease progression, shedding new light on potential therapeutic strategies for ALS.
Keywords: ALS; Kv1.3 channels; inflammation; mitochondria; mutant SOD1.
Copyright © 2024 Ratano, Cocozza, Pinchera, Busdraghi, Cantando, Martinello, Scioli, Rosito, Bezzi, Fucile, Wulff, Limatola and D’Alessandro.
Conflict of interest statement
The authors declare that the research was conducted in the absence of any commercial or financial relationships that could be construed as a potential conflict of interest. The author(s) declared that they were an editorial board member of Frontiers, at the time of submission. This had no impact on the peer review process and the final decision.
Figures


Similar articles
-
Toll-Like Receptor-4 Inhibitor TAK-242 Attenuates Motor Dysfunction and Spinal Cord Pathology in an Amyotrophic Lateral Sclerosis Mouse Model.Int J Mol Sci. 2017 Aug 1;18(8):1666. doi: 10.3390/ijms18081666. Int J Mol Sci. 2017. PMID: 28763002 Free PMC article.
-
Overexpression of human mutated G93A SOD1 changes dynamics of the ER mitochondria calcium cycle specifically in mouse embryonic motor neurons.Exp Neurol. 2013 Sep;247:91-100. doi: 10.1016/j.expneurol.2013.03.027. Epub 2013 Apr 8. Exp Neurol. 2013. PMID: 23578819
-
Human Cu/Zn superoxide dismutase (SOD1) overexpression in mice causes mitochondrial vacuolization, axonal degeneration, and premature motoneuron death and accelerates motoneuron disease in mice expressing a familial amyotrophic lateral sclerosis mutant SOD1.Neurobiol Dis. 2000 Dec;7(6 Pt B):623-43. doi: 10.1006/nbdi.2000.0299. Neurobiol Dis. 2000. PMID: 11114261
-
Potassium channel abnormalities are consistent with early axon degeneration of motor axons in the G127X SOD1 mouse model of amyotrophic lateral sclerosis.Exp Neurol. 2017 Jun;292:154-167. doi: 10.1016/j.expneurol.2017.03.008. Epub 2017 Mar 16. Exp Neurol. 2017. PMID: 28322742
-
Transgenic mice with human mutant genes causing Parkinson's disease and amyotrophic lateral sclerosis provide common insight into mechanisms of motor neuron selective vulnerability to degeneration.Rev Neurosci. 2007;18(2):115-36. doi: 10.1515/revneuro.2007.18.2.115. Rev Neurosci. 2007. PMID: 17593875 Review.
Cited by
-
Mitigating the Functional Deficit after Neurotoxic Motoneuronal Loss by an Inhibitor of Mitochondrial Fission.Int J Mol Sci. 2024 Jun 27;25(13):7059. doi: 10.3390/ijms25137059. Int J Mol Sci. 2024. PMID: 39000168 Free PMC article.
-
Rising Voltage-Gated Potassium Channel Antibody Level as a Possible Disease Progression Marker for Amyotrophic Lateral Sclerosis: A Case Report.Cureus. 2025 Jan 1;17(1):e76760. doi: 10.7759/cureus.76760. eCollection 2025 Jan. Cureus. 2025. PMID: 39748876 Free PMC article.
References
-
- Bednarczyk P. (2009). Potassium channels in brain mitochondria. Acta Biochim. Pol. 56 385–392. - PubMed
-
- Bielanska J., Hernandez-Losa J., Perez-Verdaguer M., Moline T., Somoza R., Cajal S., et al. (2009). Voltage-dependent potassium channels Kv1.3 and Kv1.5 in human cancer. Curr. Cancer Drug Targets 9 904–914. - PubMed
-
- Boillée S., Yamanaka K., Lobsiger C. S., Copeland N. G., Jenkins N. A., Kassiotis G., et al. (2006). Onset and progression in inherited ALS determined by motor neurons and microglia. Science 312 1389–1392. - PubMed
LinkOut - more resources
Full Text Sources
Molecular Biology Databases
Research Materials
Miscellaneous