

Machine Learning Bolsters Evidence That D1, Nef, and Tat Influence HIV Reservoir Dynamics
- PMID: 38292079
- PMCID: PMC10827039
- DOI: 10.20411/pai.v8i2.621
Machine Learning Bolsters Evidence That D1, Nef, and Tat Influence HIV Reservoir Dynamics
Abstract
Background: The primary hurdle to curing HIV is due to the establishment of a reservoir early in infection. In an effort to find new treatment strategies, we and others have focused on understanding the selection pressures exerted on the reservoir by studying how proviral sequences change over time.
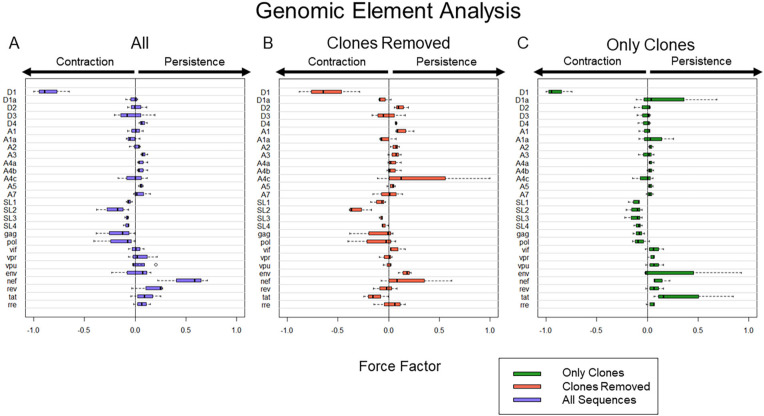
Methods: To gain insights into the dynamics of the HIV reservoir we analyzed longitudinal near full-length sequences from 7 people living with HIV between 1 and 20 years following the initiation of antiretroviral treatment. We used this data to employ Bayesian mixed effects models to characterize the decay of the reservoir using single-phase and multiphasic decay models based on near full-length sequencing. In addition, we developed a machine-learning approach utilizing logistic regression to identify elements within the HIV genome most associated with proviral decay and persistence. By systematically analyzing proviruses that are deleted for a specific element, we gain insights into their role in reservoir contraction and expansion.
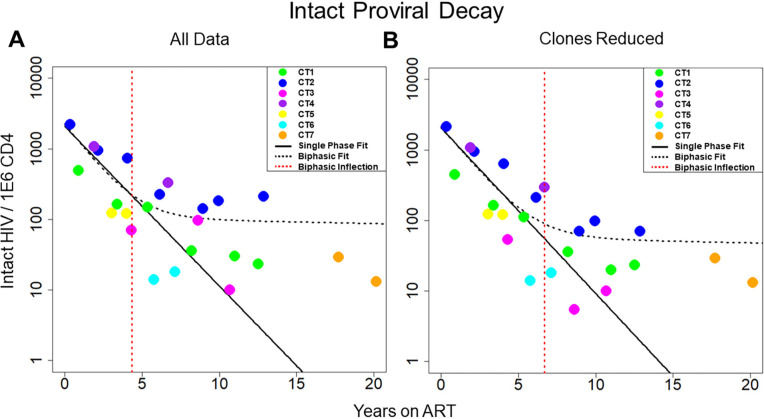
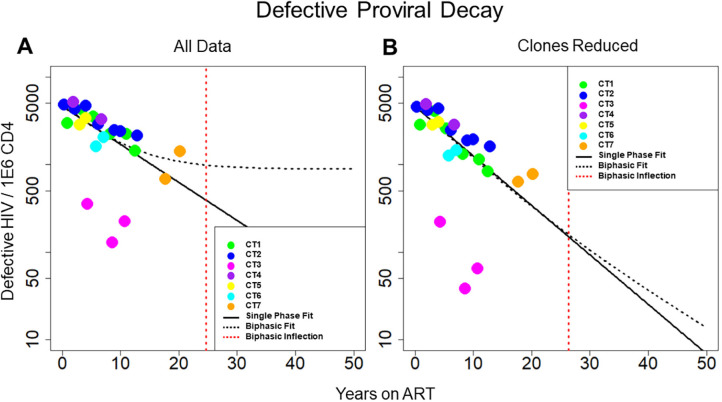
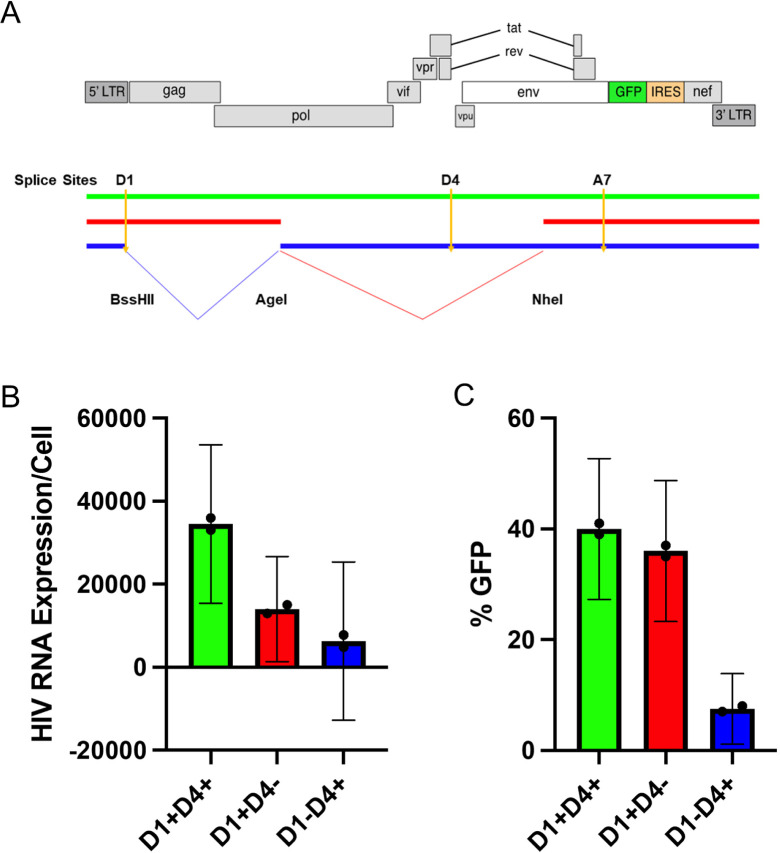
Results: Our analyses indicate that biphasic decay models of intact reservoir dynamics were better than single-phase models with a stronger statistical fit. Based on the biphasic decay pattern of the intact reservoir, we estimated the half-lives of the first and second phases of decay to be 18.2 (17.3 to 19.2, 95%CI) and 433 (227 to 6400, 95%CI) months, respectively.In contrast, the dynamics of defective proviruses differed favoring neither model definitively, with an estimated half-life of 87.3 (78.1 to 98.8, 95% CI) months during the first phase of the biphasic model. Machine-learning analysis of HIV genomes at the nucleotide level revealed that the presence of the splice donor site D1 was the principal genomic element associated with contraction. This role of D1 was then validated in an in vitro system. Using the same approach, we additionally found supporting evidence that HIV nef may confer a protective advantage for latently infected T cells while tat was associated with clonal expansion.
Conclusions: The nature of intact reservoir decay suggests that the long-lived HIV reservoir contains at least 2 distinct compartments. The first compartment decays faster than the second compartment. Our machine-learning analysis of HIV proviral sequences reveals specific genomic elements are associated with contraction while others are associated with persistence and expansion. Together, these opposing forces shape the reservoir over time.
Keywords: HIV Reservoir; Machine Learning; NFL Sequencing.
Copyright © 2024 Pathogens and Immunity.
Conflict of interest statement
The authors report no competing financial interests.
Figures
Similar articles
-
Longitudinal clonal dynamics of HIV-1 latent reservoirs measured by combination quadruplex polymerase chain reaction and sequencing.Proc Natl Acad Sci U S A. 2022 Jan 25;119(4):e2117630119. doi: 10.1073/pnas.2117630119. Proc Natl Acad Sci U S A. 2022. PMID: 35042816 Free PMC article.
-
Complex decay dynamics of HIV virions, intact and defective proviruses, and 2LTR circles following initiation of antiretroviral therapy.Proc Natl Acad Sci U S A. 2022 Feb 8;119(6):e2120326119. doi: 10.1073/pnas.2120326119. Proc Natl Acad Sci U S A. 2022. PMID: 35110411 Free PMC article.
-
Next-Generation Sequencing in a Direct Model of HIV Infection Reveals Important Parallels to and Differences from In Vivo Reservoir Dynamics.J Virol. 2020 Apr 16;94(9):e01900-19. doi: 10.1128/JVI.01900-19. Print 2020 Apr 16. J Virol. 2020. PMID: 32051279 Free PMC article.
-
New Approaches to Multi-Parametric HIV-1 Genetics Using Multiple Displacement Amplification: Determining the What, How, and Where of the HIV-1 Reservoir.Viruses. 2021 Dec 10;13(12):2475. doi: 10.3390/v13122475. Viruses. 2021. PMID: 34960744 Free PMC article. Review.
-
The role of integration and clonal expansion in HIV infection: live long and prosper.Retrovirology. 2018 Oct 23;15(1):71. doi: 10.1186/s12977-018-0448-8. Retrovirology. 2018. PMID: 30352600 Free PMC article. Review.
Cited by
-
HIV-1 Nef activates proviral DNA transcription by recruiting Src kinase to phosphorylate host protein Nef-associated factor 1 to compromise its viral restrictive function.J Virol. 2025 May 20;99(5):e0028025. doi: 10.1128/jvi.00280-25. Epub 2025 Apr 24. J Virol. 2025. PMID: 40272155 Free PMC article.
-
From network biology to immunity: potential longitudinal biomarkers for targeting the network topology of the HIV reservoir.J Transl Med. 2025 Aug 13;23(1):906. doi: 10.1186/s12967-025-06919-z. J Transl Med. 2025. PMID: 40804634 Free PMC article. Review.
-
Applications and limitations of the passenger hypothesis for HIV reservoir persistence and cure.J Virol. 2025 Jul 22;99(7):e0071425. doi: 10.1128/jvi.00714-25. Epub 2025 Jun 4. J Virol. 2025. PMID: 40464563 Free PMC article. Review.
References
-
- Trickey A, Sabin CA, Burkholder G, Crane H, d'Arminio Monforte A, Egger M, Gill MJ, Grabar S, Guest JL, Jarrin I, Lampe FC, Obel N, Reyes JM, Stephan C, Sterling TR, Teira R, Touloumi G, Wasmuth JC, Wit F, Wittkop L, Zangerle R, Silverberg MJ, Justice A, Sterne JAC.. Life expectancy after 2015 of adults with HIV on long-term antiretroviral therapy in Europe and North America: a collaborative analysis of cohort studies. The Lancet HIV. 2023;10(5): e295-e307. doi: 10.1016/S2352-3018(23)00028-0. Epub 2023 Mar 20. PMID: 36958365; PMCID: PMC10288029. - DOI - PMC - PubMed
-
- Finzi D, Hermankova M, Pierson T, Carruth LM, Buck C, Chaisson RE, Quinn TC, Chadwick K, Margolick J, Brookmeyer R, Gallant J, Markowitz M, Ho DD, Rich-man DD, Siliciano RF.. Identification of a reservoir for HIV-1 in patients on highly active antiretroviral therapy. Science. 1997;278(5341):1295-1300. doi: 10.1126/science.278.5341.1295. PMID: 9360927. - DOI - PubMed
-
- Chun TW, Carruth L, Finzi D, Shen X, DiGiuseppe JA, Taylor H, Hermankova M, Chadwick K, Margolick J, Quinn TC, Kuo YH, Brookmeyer R, Zeiger MA, Bar-ditch-Crovo P, Siliciano RF.. Quantification of latent tissue reservoirs and total body viral load in HIV-1 infection. Nature. 1997;387(6629):183-188. doi: 10.1038/387183a0. PMID: 9144289. - DOI - PubMed
-
- Laskey SB, Pohlmeyer CW, Bruner KM, Siliciano RF.. Evaluating Clonal Expansion of HIV-Infected Cells: Optimization of PCR Strategies to Predict Clonality. PLoS Pathogens. 2016;12(8):1-17. doi: 10.1371/journal.ppat.1005689. PMID: 27494508; PMCID: PMC4975415. - DOI - PMC - PubMed
Grants and funding
LinkOut - more resources
Full Text Sources