. 2023 Dec 18;10(1):163-175.
doi: 10.1021/acscentsci.3c01351. eCollection 2024 Jan 24.

Genetically Encoded Photocatalysis Enables Spatially Restricted Optochemical Modulation of Neurons in Live Mice

Affiliations

Genetically Encoded Photocatalysis Enables Spatially Restricted Optochemical Modulation of Neurons in Live Mice

Kaixing Zeng et al. ACS Cent Sci. .

Abstract

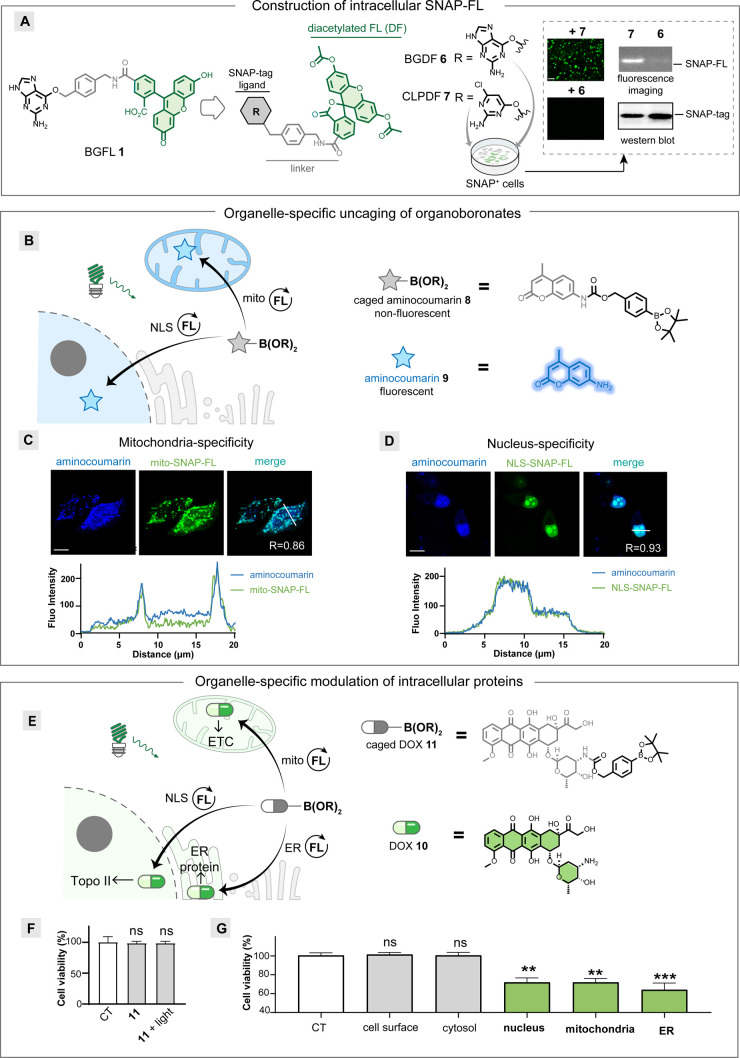
Light provides high temporal precision for neuronal modulations. Small molecules are advantageous for neuronal modulation due to their structural diversity, allowing them to suit versatile targets. However, current optochemical methods release uncaged small molecules with uniform concentrations in the irradiation area, which lack spatial specificity as counterpart optogenetic methods from genetic encoding for photosensitive proteins. Photocatalysis provides spatial specificity by generating reactive species in the proximity of photocatalysts. However, current photocatalytic methods use antibody-tagged heavy-metal photocatalysts for spatial specificity, which are unsuitable for neuronal applications. Here, we report a genetically encoded metal-free photocatalysis method for the optochemical modulation of neurons via deboronative hydroxylation. The genetically encoded photocatalysts generate doxorubicin, a mitochondrial uncoupler, and baclofen by uncaging stable organoboronate precursors. The mitochondria, nucleus, membrane, cytosol, and ER-targeted drug delivery are achieved by this method. The distinct signaling pathway dissection in a single projection is enabled by the dual optogenetic and optochemical control of synaptic transmission. The itching signaling pathway is investigated by photocatalytic uncaging under live-mice skin for the first time by visible light irradiation. The cell-type-specific release of baclofen reveals the GABABR activation on NaV1.8-expressing nociceptor terminals instead of pan peripheral sensory neurons for itch alleviation in live mice.


Conflict of interest statement

The authors declare no competing financial interest.

Figures

Figure 1
Figure 1
Neuronal modulation by photocatalysis. (A) Light provides spatiotemporal precision for neuronal modulation. (B) Challenges of neuronal modulation by photocatalysis. Heavy-metal photocatalysts for immune cell labeling with carbenes (established) vs metal-free photocatalysts for neuronal modulation with drug molecules (unknown). (C) Genetically encoded metal-free photocatalysis modulates neurons with spatial specificity.
Figure 2
Figure 2
Development of genetically encoded photocatalysts with SNAP-tag and organic dyes. (A) Genetically encoded SNAP-FL protein uncages photoinsensitive organoboronates by selective deboronative hydroxylation. (B) SNAP-FL protein is constructed from SNAP-tag and BGFL. (Left) Chemical structure of BGFL. (Middle) Gel analysis of SNAP-FL protein. (Right) Absorption (solid line) and emission (dashed line) spectrum of SNAP-FL protein and fluorescein. (C) Kinetic studies of the photocatalytic uncaging of organoboronates 2 (top) and 3 (bottom) by SNAP-FL protein and fluorescein. Reaction conditions: 500 nm light irradiation (2.9 mW/cm2) in pH 7.4 PBS buffer for 30 min. (D) Photostability of SNAP-FL protein under 500 nm light irradiation (4.5 mW/cm2) compared to that of fluorescein. (E) Singlet oxygen generation by SNAP-FL protein is minimal compared to that of fluorescein and Eosin Y under 500 nm light irradiation (4.5 mW/cm2).
Figure 3
Figure 3
Intracellular protein modulation with organelle-specific drug release. (A) Switch of small-molecule BGFL to CLPDF for intracellular SNAP-FL protein construction. The intracellular SNAP-FL protein was characterized by imaging and electrophoresis (right). (B) Schematic representation of aminocoumarin 9 release from organoboronates 8 by selective photocatalysis in the nucleus and mitochondria. (C) mito-SNAP-FL protein releases aminocoumarin 9 from organoboronates 8 with mitochondria specificity. The colocalization between 9 and mito-SNAP-FL protein shows R = 0.86. (D) NLS-SNAP-FL protein releases aminocoumarin 9 from organoboronates 8 with nucleus specificity. The colocalization between 9 and NLS-SNAP-FL protein shows R = 0.93. Overlays of line profiles at the bottom in (C) and (D) show the pixel intensities along the indicated thin white lines. Scale bar: 10 μm. (E) Schematic representation of DOX 10 release from organoboronate caged-DOX 11 for the Topo II inhibition in the nucleus and electron transport chain (ETC) modulation in mitochondria. (F) Cell viability of organoboronate caged-DOX 11. (G) Organelle-specific release of DOX 10 from organoboronate caged-DOX 11 in different subcellular compartments (n = 7). CT: control group. The statistical significance of differences between groups was evaluated with the unpaired Student’s t test. ns is not statistically significant. All p values were calculated with control cells treated without transfection, light, or small molecules. Data are shown as the mean ± S. E. M.
Figure 4
Figure 4
Neuronal activity modulation with organelle-specific DNP release. (A) Schematic representation of the organelle-specific release of DNP 12 for mitochondrial uncoupling in HeLa cells and cortical neurons. (B) TMRE indicates Δψm for mitochondrial uncoupling in HeLa cells. Scale bar: 10 μm. (C) TMRE indicates Δψm for mitochondrial uncoupling in cortical neurons. Scale bar: 10 μm. Arrows indicate cells expressing the mito-SNAP-FL protein. Quantification of TMRE fluorescence intensities of cells expressing mito-SNAP-FL protein shown at the bottom. (D) Cell-type-specific modulation of cortical neurons instead of glia cells. Scale bar: 10 μm. The statistical significance of the differences between groups was evaluated with the unpaired Student’s t test. The p values were calculated with the experiment group with light and caged-DNP 13. A p value of 0.05 and below was considered to be significant: p < 0.01 (**) and p < 0.0001 (****). Data are presented as the mean ± SEM.
Figure 5
Figure 5
Projection-specific modulation of synaptic transmission with dual optogenetic/optochemical methods. (A) Schematic representation of EPSCs and PPRs changes by the photocatalytic uncaging of baclofen 14 within the ACx-LA synaptic projection in the brain. Electrical or optogenetic stimulation evoked EPSCs, when the optochemical uncaging of baclofen 14 was achieved using sodium ascorbates (VcNa) as reductants, activating presynaptic GABABRs to increase PPRs and decrease EPSCs. (B) Representative traces of EPSCs at ACx → LA synapses after electrical stimulation, caged 15 addition, optochemical uncaging, and CGP52432 (upper). Schematic projection representation of electrical stimulation and optochemical uncaging (bottom left). Histograms of mean ± SEM with circles denoting EPSC and PPRs (bottom right). n = 7 neurons from three C57 mice. (C) Representative traces of EPSCs at ACx → LA synapses after optogenetic stimulation, optochemical uncaging, CGP52432, and an artificial cerebrospinal fluid (ACSF) wash (upper). Schematic projection representation of optogenetic stimulation and optochemical uncaging (bottom left). Histograms of mean ± SEM with circles denoting EPSC and PPRs (bottom right). n = 7 neurons from three C57 mice. (D) Schematic representation of dual optogenetic/optochemical modulation (left). Time-resolved neuronal modulation at ACx → LA synapses with optogenetics and dual optogenetic/optochemical modulation (right, relative to baseline). The statistical significance of differences between groups was evaluated with the paired Student’s t test. A p value of 0.05 and below was considered significant: p < 0.05 (*), p < 0.01 (**), and p < 0.001 (***); ns is not statistically significant. Data are presented as the mean ± SEM.
Figure 6
Figure 6
Anti-itch signaling mechanism dissection in live mice with cell-type-specific baclofen release. (A) Hypothetical anti-itch signaling mechanism by baclofen 14. (B) Experimental procedure of inhibiting the NaV 1.8+ nociceptor or other PSNs for antipruritic signal modulation. The optochemical release of baclofen 14 on the NaV 1.8+ nociceptor inhibited acute itch induced by histamine (His) or chloroquine (CQ) in mice. (C) Antipruritic effect of baclofen 14 release on the NaV 1.8+ nociceptor against His-induced itch, which was characterized by the number of scratches (n = 6) (upper) and neurons expressing c-Fos (n = 3) (bottom). Representative images of the spinal cord with c-Fos staining (middle). Scale bar: 100 μm. (D) Antipruritic effect of baclofen 14 release on the NaV 1.8+ nociceptor against CQ-induced itch, which was characterized by the number of scratches (n = 6) (upper) and neurons expressing c-Fos (n = 3) (bottom). Representative images of the spinal cord with c-Fos staining (middle). Scale bar: 100 μm. (E) No antipruritic effect of baclofen 14 release against His- (upper) or CQ- (bottom) induced itch on pan PSNs, which was characterized by the number of scratches (n = 6). The statistical significance of the differences between groups was evaluated with the unpaired Student’s t test. A p value of 0.05 and below was considered to be significant: p< 0.05 (*), p< 0.01 (**), and p< 0.001 (***); ns is not statistically significant. Data are presented as the mean ± SEM.

References

    1. Rowland J. M.; van der Plas T. L.; Loidolt M.; Lees R. M.; Keeling J.; Dehning J.; Akam T.; Priesemann V.; Packer A. M. Propagation of activity through the cortical hierarchy and perception are determined by neural variability. Nat. Neurosci. 2023, 26 (9), 1584–1594. 10.1038/s41593-023-01413-5. - DOI - PMC - PubMed
    1. Segal A.; Parkes L.; Aquino K.; Kia S. M.; Wolfers T.; Franke B.; Hoogman M.; Beckmann C. F.; Westlye L. T.; Andreassen O. A.; et al. Regional, circuit and network heterogeneity of brain abnormalities in psychiatric disorders. Nat. Neurosci. 2023, 26 (9), 1613–1629. 10.1038/s41593-023-01404-6. - DOI - PMC - PubMed
    1. Gautier A.; Gauron C.; Volovitch M.; Bensimon D.; Jullien L.; Vriz S. How to control proteins with light in living systems. Nat. Chem. Biol. 2014, 10 (7), 533–41. 10.1038/nchembio.1534. - DOI - PubMed
    1. Rajasethupathy P.; Ferenczi E.; Deisseroth K. Targeting Neural Circuits. Cell 2016, 165 (3), 524–34. 10.1016/j.cell.2016.03.047. - DOI - PMC - PubMed
    1. Rost B. R.; Schneider-Warme F.; Schmitz D.; Hegemann P. Optogenetic Tools for Subcellular Applications in Neuroscience. Neuron 2017, 96 (3), 572–603. 10.1016/j.neuron.2017.09.047. - DOI - PubMed

LinkOut - more resources