

Integrated bioinformatics analysis identifies a Ferroptosis-related gene signature as prognosis model and potential therapeutic target of bladder cancer
- PMID: 38292893
- PMCID: PMC10822837
- DOI: 10.1093/toxres/tfae010
Integrated bioinformatics analysis identifies a Ferroptosis-related gene signature as prognosis model and potential therapeutic target of bladder cancer
Abstract
Background: Bladder cancer (BLCA) is one of the most prevalent cancers worldwide. Ferroptosis is a newly discovered form of non-apoptotic cell death that plays an important role in tumors. However, the prognostic value of ferroptosis-related genes (FRGs) in BLCA has not yet been well studied.
Method and materials: In this study, we performed consensus clustering based on FRGS and categorized BLCA patients into 2 clusters (C1 and C2). Immune cell infiltration score and immune score for each sample were computed using the CIBERSORT and ESTIMATE methods. Functional annotation of differentially expressed genes were performed by Gene Ontology (GO) and KEGG pathway enrichment analysis. Protein expression validation were confirmed in Human Protein Atlas. Gene expression validation were performed by qPCR in human bladder cancer cell lines lysis samples.
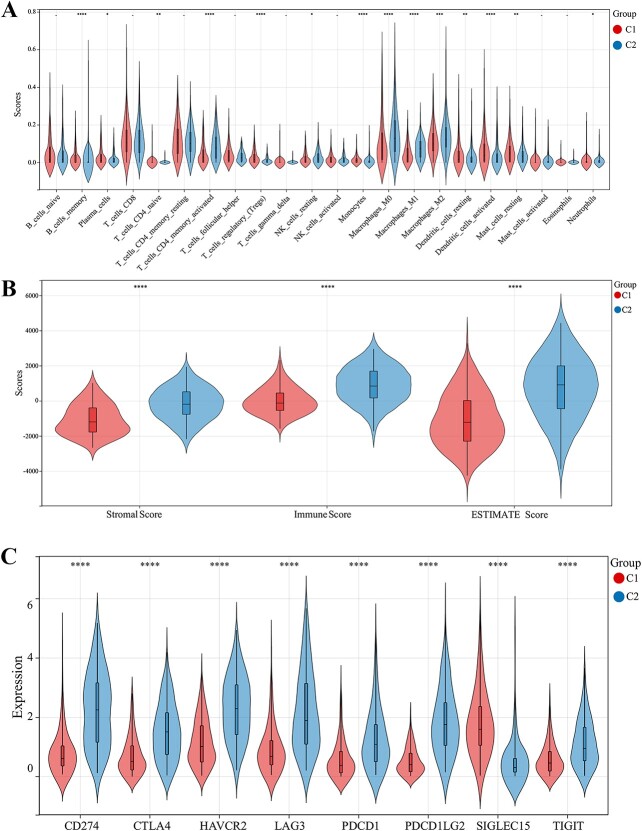
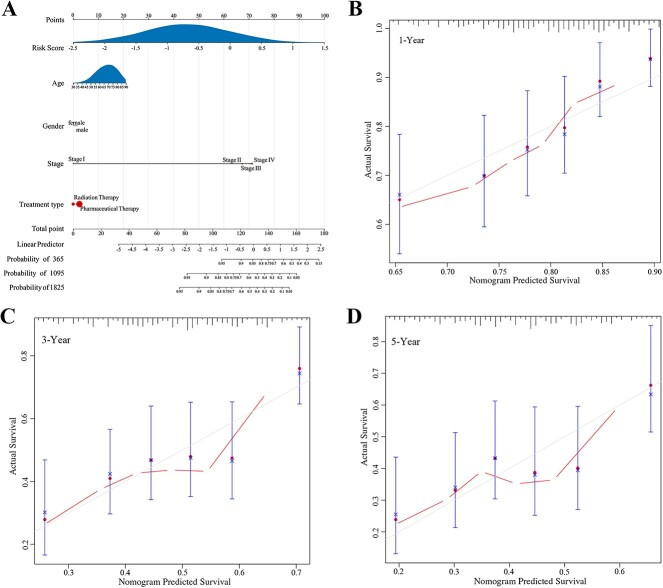
Result: C2 had a significant survival advantage and higher immune infiltration levels than C1. Additionally, C2 showed substantially higher expression levels of immune checkpoint markers than C1. According to the Cox and LASSO regression analyses, a novel ferroptosis-related prognostic signature was developed to predict the prognosis of BLCA effectively. High-risk and low-risk groups were divided according to risk scores. Kaplan-Meier survival analyses showed that the high-risk group had a shorter overall survival than the low-risk group throughout the cohort. Furthermore, a nomogram combining risk score and clinical features was developed. Finally, SLC39A7 was identified as a potential target in bladder cancer.
Discussion: In conclusion, we identified two ferroptosis-clusters with different prognoses using consensus clustering in BLCA. We also developed a ferroptosis-related prognostic signature and nomogram, which could indicate the outcome.
Keywords: Bladder cancer; Consensus clustering; Ferroptosis; Prognostic prediction model; Risk score.
© The Author(s) 2024. Published by Oxford University Press. All rights reserved. For Permissions, please e-mail: journals.permissions@oup.com.
Conflict of interest statement
The authors declare that they have no known competing financial interests or personal relationships that could have appeared to influence the work reported in this paper.
Figures


Similar articles
-
Identification of a Novel Ferroptosis-Related Gene Prognostic Signature in Bladder Cancer.Front Oncol. 2021 Sep 7;11:730716. doi: 10.3389/fonc.2021.730716. eCollection 2021. Front Oncol. 2021. PMID: 34557413 Free PMC article.
-
A novel survival model based on a Ferroptosis-related gene signature for predicting overall survival in bladder cancer.BMC Cancer. 2021 Aug 21;21(1):943. doi: 10.1186/s12885-021-08687-7. BMC Cancer. 2021. PMID: 34418989 Free PMC article.
-
A Novel Prognostic Model Based on Ferroptosis-Related Gene Signature for Bladder Cancer.Front Oncol. 2021 Aug 6;11:686044. doi: 10.3389/fonc.2021.686044. eCollection 2021. Front Oncol. 2021. PMID: 34422642 Free PMC article.
-
Generalized machine learning based on multi-omics data to profile the effect of ferroptosis pathway on prognosis and immunotherapy response in patients with bladder cancer.Environ Toxicol. 2024 Feb;39(2):680-694. doi: 10.1002/tox.23949. Epub 2023 Aug 30. Environ Toxicol. 2024. PMID: 37647346
-
Identification of clinical prognostic factors and analysis of ferroptosis-related gene signatures in the bladder cancer immune microenvironment.BMC Urol. 2024 Jan 3;24(1):6. doi: 10.1186/s12894-023-01354-y. BMC Urol. 2024. PMID: 38172792 Free PMC article.
References
-
- Osch FH, Jochems SH, van Schooten, Bryan RT, Zeegers MP. Quantified relations between exposure to tobacco smoking and bladder cancer risk: a meta-analysis of 89 observational studies. Int J Epidemiol. 2016:45:857–870. - PubMed
LinkOut - more resources
Full Text Sources
Miscellaneous
