[Preprint]. 2024 Jan 18:2024.01.18.575711.
doi: 10.1101/2024.01.18.575711.

Glycan-costumed virus-like particles promote type 1 anti-tumor immunity

Affiliations

Glycan-costumed virus-like particles promote type 1 anti-tumor immunity

Valerie Lensch et al. bioRxiv. .

Abstract

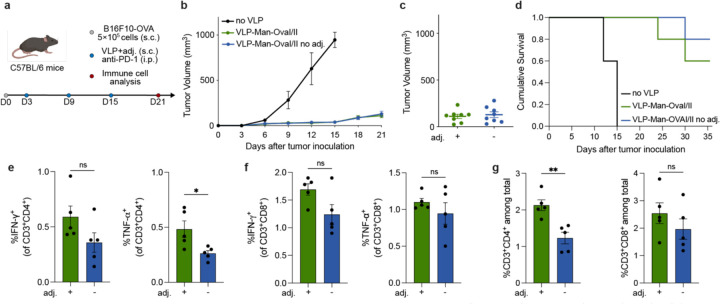
Cancer vaccine development is inhibited by a lack of strategies for directing dendritic cell (DC) induction of effective tumor-specific cellular immunity. Pathogen engagement of DC lectins and toll-like receptors (TLRs) shapes immunity by directing T cell function. Strategies to activate specific DC signaling pathways via targeted receptor engagement are crucial to unlocking type 1 cellular immunity. Here, we engineered a glycan-costumed virus-like particle (VLP) vaccine that delivers programmable peptide antigens to induce tumor-specific cellular immunity in vivo. VLPs encapsulating TLR7 agonists and decorated with a selective mannose-derived ligand for the lectin DC-SIGN induced robust DC activation and type 1 cellular immunity, whereas VLPs lacking this key DC-SIGN ligand failed to promote DC-mediated immunity. Vaccination with glycan-costumed VLPs generated tumor antigen-specific Th1 CD4+ and CD8+ T cells that infiltrated solid tumors, inhibiting tumor growth in a murine melanoma model. Thus, VLPs employing lectin-driven immune reprogramming provide a framework for advancing cancer immunotherapies.


Conflict of interest statement

Competing Interests A.K.S. reports compensation for consulting and/or Scientific Advisory Board (SAB) membership from Merck, Honeycomb Biotechnologies, Cellarity, Repertoire Immune Medicines, Hovione, Third Rock Ventures, Ochre Bio, FL82, Empress Therapeutics, Relation Therapeutics, Senda Biosciences, IntrECate biotherapeutics, Santa Ana Bio, and Dahlia Biosciences unrelated to this work. D.J.I. reports compensation for consulting and/or SAB membership from Elicio Therapeutics, Ankyra Therapeutics, Strand Therapeutics, Window Therapeutics, Venn Therapeutics, Alloy Therapeutics, Livzon Pharmaceuticals, SQZ Biotechnologies, Jupiter Therapeutics, Parallel Bio, Surge Therapeutics, Senda Biosciences, Gensaic Therapeutics, and Third Rock Ventures unrelated to this research. J.A.J. is a cofounder and shareholder of Window Therapeutics unrelated to this research. L.L.K. reports compensation for consulting and/or SAB membership from Exo Therapeutics, the ONO Pharmaceutical Foundation, and Coca Cola unrelated to this research. V.L., R.H., M.M.A., L.L.K., and M.G.F. are inventors on relevant patent applications held by the Massachusetts Institute of Technology and Georgia Institute of Technology. The remaining authors declare that they have no competing interests.

Figures

Fig. 1 |
Fig. 1 |. Aryl mannoside-substituted VLPs as a platform for DC-targeted cancer vaccines.
a, Schematic of VLP-Man-OvaI/II engagement of DC-SIGN and TLR7 on DCs for antigen presentation and T cell priming. VLP decoration with the aryl mannoside ligand facilitates DC targeting and antigen internalization. Following endocytosis, aryl mannoside-substituted VLPs maintain DC-SIGN binding and facilitate ssRNA engagement of endosomal TLR7 to activate DCs and induce tumor antigen-specific T cells. b, Design of VLPs surface-functionalized with tumor antigens OvaI and OvaII, control pentaerythritol (PE) or Man ligands, and encapsulated ssRNAs. c, Surface accessible lysine residues were functionalized to incorporate an azide handle and then subjected to a copper(I)-catalyzed Huisgen azide–alkyne cycloaddition (CuAAC), a type of click chemistry, to append tumor antigens and ligands. Steps (i, ii): 0.1 M potassium phosphate buffer, pH 7.4; room temperature, 2 h; step (iii): tris(3 hydroxypropyltriazolylmethyl)amine (THPTA), CuSO4, sodium ascorbate, aminoguanidine, 0.1 M potassium phosphate, pH 7.0, 50 °C, 1 h.
Fig. 2 |
Fig. 2 |. VLP-Man-OvaI/II co-engages DC-SIGN and TLR7 for DC activation.
a, moDCs were incubated with 8 nM AF647-labeled VLPs for 30 min, and uptake of VLP by moDCs was measured by flow cytometry. b, Mean fluorescence intensity of AF647-labeled VLPs in CD11c+ moDCs indicated at 30 min. c, moDCs were pre-treated with blocking antibodies against lectins for 20 min and then incubated with 8 nM VLP-Man-OvaI/II for 15 min. The uptake of VLPs was assessed by flow cytometry. Relative uptake was calculated by normalization against a control sample without pre-treatment of blocking antibodies. d, Confocal microscopy images showing VLP localization in moDCs after 1 h incubation with 8 nM VLPs. Green: AF405 anti-DC-SIGN; Pink: AF488 anti-TLR7; Cyan: AF647-VLP. Scale bars, 5 μm. e, Activation of moDCs by VLPs. moDCs were incubated with 8 nM VLPs for 24 h, and the expression levels of activation surface markers CD40, CD83, CD86, and CD80 were measured by flow cytometry. Data represent mean +/− standard error of the mean (s.e.m.) from a representative experiment (n=3). Statistical analysis was performed using one-way ANOVA with Bonferroni’s multiple comparisons test. *P<0.1, **P<0.01, ***P<0.001, ****P<0.0001. Each experiment was repeated at least twice with similar results.
Fig. 3 |
Fig. 3 |. VLP-Man-OvaI/II induces type 1-associated responses.
a, Altered gene expression profiles between VLP-Man-OvaI/II- and VLP-PE-OvaI/II-treated moDCs. moDCs were treated with 8 nM VLPs for 6 h. b, TLR7 downstream gene signature module score for unstimulated, VLP-PE-OvaI/II-,and VLP-Man-OvaI/II-treated moDCs. c, GSEA analysis of upregulated and downregulated pathways in DCs treated with VLP-Man-OvaI/II and VLP-PE-OvaI/II. d, The moDCs were treated with VLPs for 32 h and supernatants were collected for cytokine analysis. e, The moDCs were pre-treated with blocking antibodies against DC-SIGN for 20 min followed by stimulation with VLP-PE-OvaI/II or VLP-Man-OvaI/II for 32 h, and TNF-α secretion was measured. Data represent mean ± s.e.m. from a representative experiment (n=3). Statistical analysis was performed by one-way ANOVA with Bonferroni’s multiple comparisons test. *P<0.1, **P<0.01, ***P<0.001, ****P<0.0001. For d and e, experiments were repeated at least twice with similar results.
Fig. 4 |
Fig. 4 |. Mannosylated VLP conjugation with tumor antigens induces specific Th1 CD4+ and CD8+ T cells.
a, Schematic representation of VLPs with Ova antigens. b, C57/BL6 mice were inoculated with 5×10⁵ B16F10-OVA cells (s.c.) on day 0 and treated with VLPs and 2’3’-cGAMP (s.c.) and anti-PD-1 intraperitoneally (i.p.) on days 3, 9, and 15. c, Percentages of CD4+ and CD8+ T cells in the spleens were analyzed on day 21. d, IFN-γ and TNF-α-secreting CD4+ T cells in the spleen were measured following restimulation with OVA(323–339). e, IFN-γ and TNF-α-secreting CD4+ T cells in the spleen were measured following restimulation with OVA(257–264). f, Percentages of CD4+ and CD8+ T cells in the tumors were analyzed on day 21. g, Percentages of CD4+ and CD8+ among CD3+ T cells within the tumor. h, Mean tumor growth curves. i, Tumor volumes on day 21. j, Survival curves. The difference between VLP-Man and VLP-Man-OvaI/II was significant (p < 0.01, Log-rank (Mantel–Cox) test). Data represent mean ± s.e.m. from a representative experiment (n=5 (c-g) and n=8 (h-j). Statistical analysis was performed by one-way ANOVA with Bonferroni’s multiple comparisons test or by log-rank (Mantel-Cox) test for the survival analysis. *P<0.1, **P<0.01, ***P<0.001, ****P<0.0001. Each experiment was repeated twice with similar results.
Fig. 5 |
Fig. 5 |. VLP-Man-OvaI/II induces tumor antigen-specific T cells and exerts anti-tumor response.
a, C57/BL6 mice were inoculated with 5×10⁵ B16F10-OVA cells (s.c.) on day 0 and treated with VLPs and 2’3’-cGAMP (s.c.) and anti-PD-1 intraperitoneally (i.p.) on days 3, 9, and 15. b, Mean tumor growth curves. c, Tumor volumes on day 21. d, Survival curves. The difference between VLP-PE-OvaI/II and VLP-Man-OvaI/II was significant (p < 0.1, Log-rank (Mantel–Cox) test). e, Percentages of CD4+ and CD8+ T cells in the spleens were analyzed on day 21. f, IFN-γ and TNF-α-secreting CD4+ T cells in the spleen were measured following restimulation with OVA(323–339). g, IFN-γ and TNF-α-secreting CD8+ T cells in the spleen were measured following restimulation with OVA(257–264). h, Percentages of CD4+ and CD8+ T cells in the tumors were analyzed on day 21. i, Percentages of CD4+ and CD8+ among CD3+ T cells within the tumor. j, Surviving mice were re-challenged with 5×10⁴ B16F10-OVA cells on day 28. k, Tumor growth curves. l,m, OVA(323–339)-specific antibody profiles were analyzed by ELISA measurements from serum of mice immunized with VLP-PE-OVAI/II (l) or VLP-Man-OvaI/II (m). n, IgG2c:IgG1 antibody ratio for mice immunized with VLPs. Line represents IgG2c:IgG1 ratio of 1. Data represent mean +/− s.e.m. from a representative experiment (n=8 (b-d) and n=5 (e-i) and n=4 (j-k) and n=5 (l-n)). Statistical analysis was performed by one-way ANOVA with Bonferroni’s multiple comparisons test or by log-rank (Mantel-Cox) test for the survival analysis. *P<0.1, **P<0.01, ***P<0.001, ****P<0.0001. Each experiment was repeated twice with similar results.
Fig. 6 |
Fig. 6 |. VLP-Man-OvaI/II has self-adjuvanting capacity.
a, C57/BL6 mice were inoculated with 5×10⁵ B16F10-OVA cells (s.c.) on day 0 and treated with VLPs and 2’3’-cGAMP (s.c.) and anti-PD-1 intraperitoneally (i.p.) on days 3, 9, and 15. b, Mean tumor growth curves. c, Tumor volumes on day 21. d, Survival curves. Differences between VLP-Man-OvaI/II and VLP-Man-OvaI/II no adj. were not significant. e, IFN-γ and TNF-α-secreting CD4+ T cells in the spleen were measured following restimulation with OVA(323–339). f, IFN-γ and TNF-α-secreting CD8+ T cells in the spleen were measured following restimulation with OVA(257–264). g, Percentages of CD4+ and CD8+ T cells in the tumors were analyzed on day 21. Data represent mean +/− s.e.m. from a representative experiment (n=8 (b-d) and n=5 (e-g)). Statistical analysis was performed by one-way ANOVA with Bonferroni’s multiple comparisons test or by log-rank (Mantel-Cox) test for the survival analysis. *P<0.1, **P<0.01, ***P<0.001, ****P<0.0001.

References

    1. Nabel G.J. Designing Tomorrow’s Vaccines. N. Engl. J. Med. 368, 551–560 (2013). - PMC - PubMed
    1. Saxena M., van der Burg S.H., Melief C.J.M. & Bhardwaj N. Therapeutic cancer vaccines. Nat. Rev. Cancer 21, 360–378 (2021). - PubMed
    1. Rossi M. & Young J.W. Human Dendritic Cells: Potent Antigen-Presenting Cells at the Crossroads of Innate and Adaptive Immunity. J. Immunol. 175, 1373–1381 (2005). - PubMed
    1. Guermonprez P., Valladeau J., Zitvogel L., Théry C. & Amigorena S. Antigen Presentation and T Cell Stimulation by Dendritic Cells. Annu. Rev. Immunol. 20, 621–667 (2002). - PubMed
    1. Kapsenberg M.L. Dendritic-cell control of pathogen-driven T-cell polarization. Nat. Rev. Immunol. 3, 984–993 (2003). - PubMed

Publication types