[Preprint]. 2025 Mar 18:2024.01.15.575761.
doi: 10.1101/2024.01.15.575761.

Revealing protein sequence organization via contiguous hydrophobicity with the blobulator toolkit

Affiliations

Revealing protein sequence organization via contiguous hydrophobicity with the blobulator toolkit

Connor Pitman et al. bioRxiv. .

Abstract

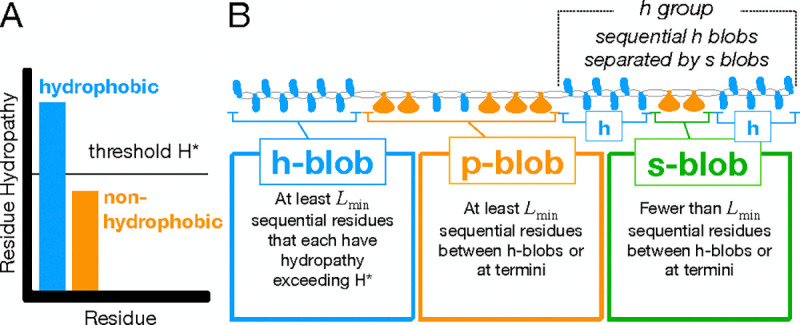
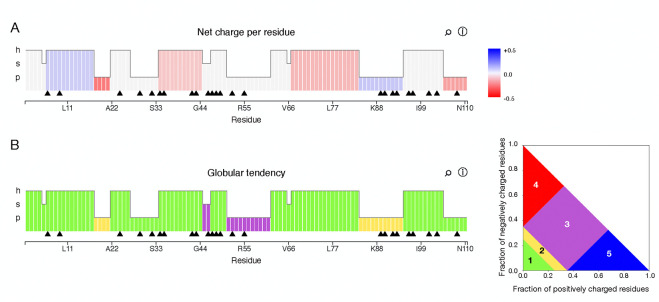
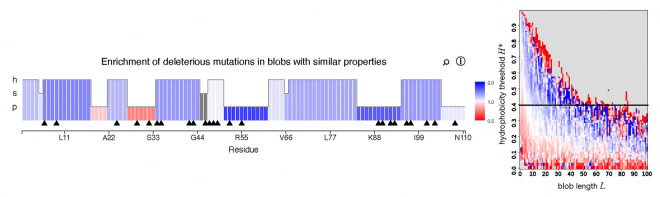
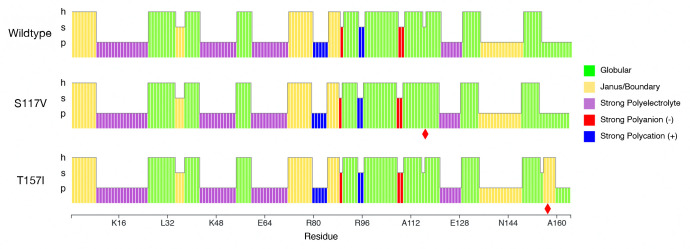
Clusters of hydrophobic residues are known to promote structured protein stability and drive protein aggregation. Recent work has shown that identifying contiguous hydrophobic residue clusters within protein sequences (termed "blobs") has proven useful in both intrinsically disordered protein (IDP) simulation and human genome studies. However, an accessible toolkit was unavailable, and the role that blobs play across the structural context of a variety of protein families remained unclear. Here, we present the blobulator toolkit: consisting of a webtool, a command line interface, and a VMD plugin. We demonstrate how identifying blobs using biologically relevant parameters provides useful information about a globular protein, two orthologous membrane proteins, and an IDP. Other potential applications are discussed, including: predicting protein segments with critical roles in tertiary interactions, providing a definition of local order and disorder with clear edges, and aiding in predicting protein features from sequence. The blobulator webtool can be found at www.blobulator.branniganlab.org, and the source code with pip installable command line tool, as well as the VMD plugin with installation instructions, can be found on GitHub at www.GitHub.com/BranniganLab/blobulator.


Figures

Figure 1:
Figure 1:. Blobulation algorithm.
Figure adapted from Lohia et al. 2022 (32). A) First, the sequence is digitized. Residues are classified as either hydrophobic (blue) or non-hydrophobic (orange) by comparing their hydropathy to the user-selected threshold, H*. B) The sequence is then segmented into h-blobs, s-blobs, and p-blobs based on H* and Lmin.
Figure 2:
Figure 2:. Screenshot of the blobulator webtool home page.
Protein sequences are submitted via UniProt ID or ENSEMBL ID (ID Entry), or the protein sequence and sequence name (Manual Entry). Users can toggle between the two submission options using the dropdown menu. The default values are for alpha-synuclein. Available at www.blobulator.branniganlab.org
Figure 3:
Figure 3:. Partial screenshot of the blobulator webtool results page showing parameter interface.
The user make parameter and sequence adjustments by choosing a hydropathy scale from a dropdown menu (A), setting the hydrophopathy cutoff H* using numerical entry, the control slider, or by clicking on a 1-letter code (B), selecting the minimum h- or p-blob length Lmin using numerical entry or the control slider (C), and by introducing mutations to the sequence by selecting the position and replacement amino acid and clicking the “mutate residue” checkbox (D). Additionally, the user can and perform a variety of operations by clicking buttons: print screen, download data, reset zoom, clear mutation, and lock control panel (E). The hydrophobicity of each residue (gray bars) compared to the threshold H* (blue, horizontal line) is displayed on the “smoothed hydropathy per residue” track. Residues can be mutated by clicking the black triangles (which represent known disease-associated mutations, only available for blobulation via ID entry of a human sequence) and the sequence can be zoomed (zoom in: click and drag, zoom out: double click or click “Reset Zoom” (F)). Blob type is represented by both bar height (shown on the y-axis) and color on the “blob type” track. Height is preserved in subsequent tracks to indicate blob type (G). The example protein shown in these tracks is insulin (UniProt ID: P01308).
Figure 4:
Figure 4:. Charge-based tracks on the blobulator webtool.
Blobulation of insulin as in Fig. 3. A) Blobs colored according to net charge per residue: positive (blue) or negative (red). B) Blobs colored by their Das-Pappu phase (41): phase 1 (globular, green), phase 2 (Janus/boundary, yellow), phase 3 (strong polyelectrolyte, purple), phase 4 (strong polyanion, blue), or phase 5 (strong polycation, red).
Figure 5:
Figure 5:. Predicted enrichment of disease-associated SNPs (dSNPs) track on the blobulator webtool.
Left: Blobulation of insulin as in Fig. 3 colored by dSNP enrichment (blue: enriched, red: depleted) based on panel on right. Right: enrichment of dSNPs in hydrophobic blobs based on analysis of a large dataset of human SNPs (32). The hydrophobicity cutoff (H*=0.4) used is indicated (black, horizontal line).
Figure 6:
Figure 6:. Disorder-based tracks on the blobulator webtool.
Blobulation of insulin as in Fig. 3. A) Blobs colored according to the Uversky-Gillepse-Fink boundary plot (right)(42). B) Blobs colored according to their predicted fraction of disordered residues, according to PV2 as provided by the Database of Disordered Protein Prediction (D2P2).
Figure 7:
Figure 7:. Screenshot of the VMD blobulator plugin.
The user can select the molecule (A) and provide an atomselection for the display (B), select a hydrophobicity scale and toggle the option to snap the hydrophobicity threshold to a default for that scale (C), set the minimum blob length Lmin (D) and hydrophobicity cutoff H* (E) via eider. They also can toggle visualization options (F). The “Blobulate!” button initiates blobulation and creates graphical representations within VMD (G), all representations can be deleted by pressing the “Clear representations” button (H). Graphical representations control panel (I) with representations showing in an example viewer window (J) showing Leptin (PDB: 1ax8).
Figure 8:
Figure 8:. Blobulation of lysozyme.
A) Blobs colored according to blob-type, as outputted from the blobulator webtool, and produced using default settings H*=0.4,Lmin=4. Annotations indicate catalytic residues (red) and the substrate binding site (purple). B) Molecular image of lysozyme (PDB:148L) with peptidoglycan (green) colored by the substrate binding site (left, residues found within 7Å of peptidoglycan) or by blob type (right, h-blob: blue, p-blob: orange, s-blob: green). C) Blobulation under increasingly stringent settings (H*=0.4 and 0.5,Lmin=4 and 8). H-blobs are shown as surfaces. Molecular images were generated in VMD (47, 48) using the VMD plugin introduced in 3.3.
Figure 9:
Figure 9:. Blob groups in T4 lysozyme.
A) Structural view (PDB:2LZM) blobulated using default settings (H*=0.4,Lmin=4). Groups are gray, ungrouped h-blobs are blue, and p-blobs are orange ribbons. B) Blobulation of T4 lysozyme under increasingly stringent settings. Annotations indicate blob identifiers and blob groups. Molecular images were generated in VMD (47, 48).
Figure 10:
Figure 10:. Globular tendency of T4 lysozyme blobs.
Blobulation using default parameters (H*=0.4,Lmin=4). Blobs for each sequence are colored by Das-Pappu phase (41), as in Fig. 4B. Red diamonds indicate mutated residues. S117V, which increases thermostability, joins two h-blobs into one. T157I, which decreases thermostability, creates a new h-blob (as well as an s-blob).
Figure 11:
Figure 11:. Blobulation of GluCl, a pentameric ligand-gated ion channel.
A) Blobulation of GluCl (UniProt ID: G5EBR3) using settings to detect transmembrane regions (H*=0.33,Lmin=19). B) A cartoon representation of GluCl (PDB: 3RHW) colored according to blob type and ID: β1 blob (light blue), β5 blob (dark blue), transmembrane blobs (intermediate blue), terminal s-blobs (green), p-blobs (orange). The first two blobs in the sequence are absent from the structure. The black lines represent the lipid membrane. C) GluCl showing h-blobs in surface view to better show blob-blob contacts. Colored as in B. D) Extracellular views of the TMDs of the proteins shown in B (upper) and C (lower). Molecular images were generated in VMD (47, 48).
Figure 12:
Figure 12:. Comparative blobulation of GluCl (as in Fig.11), an anion-conducting pLGIC, and GLIC, acation-conducting pLGIC.
Net Charge Per Residue (NCPR) tracks for GluCl (UniProt: G5EBR3) and GLIC (UniProt: Q7NDN8) blobulated using settings to detect transmembrane regions (H*=0.33,Lmin=19). Tracks are aligned by the beginning of the h-blob containing the M2 (pore-lining) helix. Annotations indicate important sequence features available on UniProt and indicated in Fig. 11. Signal sequences are indicated in pink, ECD regions are indicated in blue, and transmembrane helices (M1 to M4) are indicated in red.
Figure 13:
Figure 13:. Blobulation of α-synuclein, an intrinsically disordered protein.
A) Webtool “blob type” track of α-synuclein (UniProt ID: P37840) blobulated using default settings (H*=0.4,Lmin=4). Annotations indicate the membrane-interacting region (purple) and the protein-interacting region (pink). B) α-synuclein structure (PDB: 1XQ8), labeled by the membrane-interacting region in cartoon. Aggregating in pink, non-aggregating in purple. C) Changes to blobs (blue surfaces, change indicated by red circles) caused by the A30P mutant compared to the wildtype. Molecular images were generated in VMD (47, 48).
Figure 14:
Figure 14:. Order predictions for blobs of α-synuclein.
Wildtype, A53T, and A30P mutants colored by blob disorder as calculated using each blob’s signed distance from the order/disorder boundary of the Uversky-Gillepse-Fink boundary plot (42). Mutations are indicated: A53T and A30P (red diamonds and arrows), and other known disease-associated mutations (black triangles). Blobulation uses default settings (H*=0.4,Lmin=4).

Similar articles

References

    1. Porollo A. A., Adamczak R., and Meller J., 2004. POLYVIEW: a flexible visualization tool for structural and functional annotations of proteins. Bioinformatics 20:2460–2462. - PubMed
    1. Porollo A., and Meller J., 2007. Prediction-based fingerprints of protein–protein interactions. PROTEINS: Structure, Function, and Bioinformatics . - PubMed
    1. Deleage G., Combet C., Blanchet C., and Geourjon C., 2001. ANTHEPROT: An integrated protein sequence analysis software with client/server capabilities. Computers in Biology and Medicine . - PubMed
    1. Dyson H. J., and Wright P. E., 2002. Coupling of folding and binding for unstructured proteins. Current Opinion in Structural Biology . - PubMed
    1. Ward J., Sodhi J., McGuffin L., Buxton B., and Jones D., 2004. Prediction and Functional Analysis of Native Disorder in Proteins from the Three Kingdoms of Life. Journal of Molecular Biology . - PubMed

Publication types