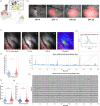
[Preprint]. 2024 Jan 21:2024.01.10.575092.
doi: 10.1101/2024.01.10.575092.

Glioma-Induced Alterations in Excitatory Neurons are Reversed by mTOR Inhibition

Affiliations

Glioma-Induced Alterations in Excitatory Neurons are Reversed by mTOR Inhibition

Alexander R Goldberg et al. bioRxiv. .

Update in

  • Glioma-induced alterations in excitatory neurons are reversed by mTOR inhibition.
    Goldberg AR, Dovas A, Torres D, Pereira B, Viswanathan A, Das Sharma S, Mela A, Merricks EM, Megino-Luque C, McInvale JJ, Olabarria M, Shokooh LA, Zhao HT, Chen C, Kotidis C, Calvaresi P, Banu MA, Razavilar A, Sudhakar TD, Saxena A, Chokran C, Humala N, Mahajan A, Xu W, Metz JB, Bushong EA, Boassa D, Ellisman MH, Hillman EMC, Hargus G, Bravo-Cordero JJ, McKhann GM 2nd, Gill BJA, Rosenfeld SS, Schevon CA, Bruce JN, Sims PA, Peterka DS, Canoll P. Goldberg AR, et al. Neuron. 2025 Mar 19;113(6):858-875.e10. doi: 10.1016/j.neuron.2024.12.026. Epub 2025 Jan 20. Neuron. 2025. PMID: 39837324

Abstract

Gliomas are highly aggressive brain tumors characterized by poor prognosis and composed of diffusely infiltrating tumor cells that intermingle with non-neoplastic cells in the tumor microenvironment, including neurons. Neurons are increasingly appreciated as important reactive components of the glioma microenvironment, due to their role in causing hallmark glioma symptoms, such as cognitive deficits and seizures, as well as their potential ability to drive glioma progression. Separately, mTOR signaling has been shown to have pleiotropic effects in the brain tumor microenvironment, including regulation of neuronal hyperexcitability. However, the local cellular-level effects of mTOR inhibition on glioma-induced neuronal alterations are not well understood. Here we employed neuron-specific profiling of ribosome-bound mRNA via 'RiboTag,' morphometric analysis of dendritic spines, and in vivo calcium imaging, along with pharmacological mTOR inhibition to investigate the impact of glioma burden and mTOR inhibition on these neuronal alterations. The RiboTag analysis of tumor-associated excitatory neurons showed a downregulation of transcripts encoding excitatory and inhibitory postsynaptic proteins and dendritic spine development, and an upregulation of transcripts encoding cytoskeletal proteins involved in dendritic spine turnover. Light and electron microscopy of tumor-associated excitatory neurons demonstrated marked decreases in dendritic spine density. In vivo two-photon calcium imaging in tumor-associated excitatory neurons revealed progressive alterations in neuronal activity, both at the population and single-neuron level, throughout tumor growth. This in vivo calcium imaging also revealed altered stimulus-evoked somatic calcium events, with changes in event rate, size, and temporal alignment to stimulus, which was most pronounced in neurons with high-tumor burden. A single acute dose of AZD8055, a combined mTORC1/2 inhibitor, reversed the glioma-induced alterations on the excitatory neurons, including the alterations in ribosome-bound transcripts, dendritic spine density, and stimulus evoked responses seen by calcium imaging. These results point to mTOR-driven pathological plasticity in neurons at the infiltrative margin of glioma - manifested by alterations in ribosome-bound mRNA, dendritic spine density, and stimulus-evoked neuronal activity. Collectively, our work identifies the pathological changes that tumor-associated excitatory neurons experience as both hyperlocal and reversible under the influence of mTOR inhibition, providing a foundation for developing therapies targeting neuronal signaling in glioma.


Conflict of interest statement

Declaration of Interests The authors have declared no competing interest.

Figures
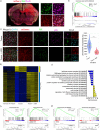
Figure 1:
Figure 1:. Tumor-Associated Neurons Show an mTOR-Dependent Translational Signature
a) Left: Coronal section of a mouse model of infiltrative glioma model showing an intermingling of mCherry+ glioma cells (red) with RiboTag (HA+; green) neurons. NeuN (magenta) is used to identify all neurons. Bar, 1mm. Right: Enlarged field from the cortex, showing prominent perineuronal satellitosis. Bar, 50 μm. b) GSEA plot showing enrichment of neuronal genes in the immunoprecipitated (IP) fraction of glioma-infiltrated brain. N = 3 mice per condition. c) Oral administration of AZD8055 effectively inhibits mTOR signaling in HA+ neurons in glioma-bearing mice. Representative images of cortex from mice treated with vehicle (top) or AZD8055 (bottom). Bar: 100 μm. Right: graph showing fluorescence intensity of pS6 (Ser240/244) levels in HA+ neurons, p=0.0004. N = 3 mice per condition, 15 image fields per condition. Wilcoxon rank-sum test was used. Yellow lines represent the mean. d) Map showing differential expression of neuronal-enriched genes between control brain, tumor brain, and tumor brain treated with AZD8055. N = 3 mice per condition. e) Gene ontologies that are altered between control and tumor brain and reversed by mTOR inhibition. N = 3 mice per condition. f) GSEA demonstrates depletion of inhibitory synapse genes in tumor brain compared to control (left) and an enrichment following AZD8055 treatment (right). N = 3 mice per condition. g) GSEA demonstrates enrichment of spine genes found in RNA granules in tumor brain compared to control (left) and their depletion following AZD8055 treatment (right). N = 3 mice per condition.
Figure 2:
Figure 2:. mTOR-dependent Alterations in Dendritic Spine and Inhibitory Synapses
a) Left: representative field from a DiI-labeled (red), HA+ neuron (magenta) in Olig2+ (green) glioma-infiltrated cortex. Scale Bar: 50 μm. Graph: violin plot of dendritic spine densities among conditions. Right: representative images of dendrites. Scale Bar: 5 μm. Control no-tumor vs. tumor (p = 1.8197e-38). Control vs. tumor+AZD8055 (p = 3.0766e-10). Tumor vs. tumor+AZD8055 (p = 6.8757e-05). N = 155 dendrites across 5 control mice, 152 dendrites across 9 tumor mice, 64 dendrites across 5 tumor+AZD8055 mice. Wilcoxon rank-sum test was used. Yellow lines represent the mean. b) Left: representative field of the glioma-infiltrated cortex (glioma cells: mCherry; red) of a Thy1-EGFP-M mouse (neurons; green). Bar: 250 μm. Graph: violin plot of dendritic spine densities among conditions. Right: representative Imaris-rendered images of dendrites. Scale Bars: 10 μm. Green: dendrite, blue: dendritic spines. Control vs. tumor (p = 4.6216e-20). Control vs. tumor+AZD8055 (p = 3.2152e-07). tumor vs. tumor+AZD8055 (p = 8.5802e-09). N = 123 dendrites across 4 control mice, 161 dendrites across 3 tumor mice, 222 dendrites across 5 tumor+AZD8055 mice. Wilcoxon rank-sum test was used. Yellow lines represent the mean. c) Left: Representative confocal sections of the cortex of Thy-EGFP-M mice showing gephyrin puncta (gray). Scale Bar, 25 μm. Insets show GFP+ neurons and mCherry+ glioma cells in the same field. Right: violin plot showing changes in gephyrin puncta per field. Control vs. tumor (p = 1.1919e-08). Control vs. tumor+AZD8055 (p = 2.2665e-08). tumor vs. tumor+AZD8055 (p = 5.9423e-04). N = 18 imaging fields across 3 control mice, 29 imaging fields across 4 tumor mice, 30 imaging fields across 4 tumor+AZD8055 mice. Wilcoxon rank-sum test was used. Yellow lines represent the mean.
Figure 3:
Figure 3:. In Vivo Two-Photon Imaging Reveals Progressive Alterations in Tumor-Associated Excitatory Neurons.
a) Left: Schematic of in vivo head-fixed two-photon imaging with simultaneous whisker stimulation (modified from Hillman, 2007). Right: Schematic of tumor injection placement (yellow marker) with respect to somatosensory cortex (green area, modified from Kirkcaldie et al., 2012). b) Representative low magnification images of tumor cell fluorescence in the cranial window growing over the course of tumor progression. mCherry-tagged tumor cells were excited by 590nm LED and the resulting signal was pseudo colored to red in the figure. c) Representative images of a large amplitude field-level event occurring during whisker stimulus onset, in an imaging field of a tumor bearing animal at 29 DPI. Three different still frames (i, ii, iii), with calcium signal from GCaMP in grayscale and maximum intensity projection from a 200um z-stack of the tumor in red, show the close temporal alignment with stimulus onset, the sharp rise of the event, and short duration. The timeseries of this event is plotted in figure 3d. The merged image of the same structural maximum intensity projection of the tumor in red overlaid with a maximum intensity projection of the calcium signal through time of the three-minute whisker stimulation run, shows the large amplitude field-level events located at the tumor margin as well as the somatic neuronal ROIs. Scale bar is 100um. d) Larger timeseries below shows calcium ΔF/F during the entire three-minute imaging run generated from the mean of the whole imaging field. The pink vertical lines represent the start of each whisker stimulation epoch, and the green vertical lines represent the end of each whisker stimulation epoch, separated by 25-second no-stim intervals. During this run, there were three large amplitude field-level events associated with stimulus onsets, with increasing amplitude. The last and largest event is plotted again on the zoomed inset, with the timing of each frame from 3c marked (i, ii, iii). Two-photon imaging was performed at 30Hz. e) Mean ΔF/F and standard deviation across each imaging field-of-view (512×512 pixels) during three-minute whisker stimulation runs were recorded and thresholds were set for calcium events at five standard deviations above the mean signal. The number of calcium events above these thresholds were significantly higher (p=0.0170) in recordings from late tumor progression animals (>21 DPI, N=182 recordings across 7 mice) than recordings in early progression animals (<21 DPI, N=137 recordings across 7 mice). Wilcoxon rank-sum test was used. Yellow lines represent the mean. The dotted black line represents the mean number of discharges per imaging field in the control no-tumor recordings (N=124 recordings across 5 mice). f) Neuronal somatic calcium events per second were computed during three-minute whisker stimulation runs. Mean ΔF/F and standard deviation for each neuron was calculated and thresholds were set for calcium events at six standard deviations above the mean signal. Significant differences (p = 3.7221e-111) were observed when comparing the event rate of all neurons from early DPI recordings (N=4142 neuronal ROIs across 6 mice) to the event rate of all neurons from late DPI recordings (N=6622 neuronal ROIs across 7 mice). Wilcoxon rank-sum test was used. Yellow lines represent the mean. The dotted black line represents the mean event rate across the control no-tumor neurons (N= 9978 neuronal ROIs across 5 mice). g) A synchronous event was identified as at least two different neurons in a field-of-view having a calcium peak occurring in a 500-millisecond interval during a five-second whisker stimulation epoch. Displayed are the fraction of neurons involved per synchronous event, restricted to events that contained at least ~13% of neuron involvement (two standard deviations above the mean of the control no-tumor data, N= 2340 synchronous events across 5 control mice). The fraction of neurons involved per synchronous event was significantly higher (p = 3.2086e-25) in FOVs from later DPI recordings (N= 3272 synchronous events across 7 mice) than from early DPI recordings (N= 2583 synchronous events across 6 mice). Wilcoxon rank-sum test was used. Yellow lines represent the mean. h) Corresponding calcium ΔF/F time series from all the neuronal somatic ROIs in the field of view from 3c, aligned to the same whisker stimulation, illustrate that large field-level calcium measurements are a distinct and complementary measurement to single neuron-level measurements.
Figure 4:
Figure 4:. In vivo Two-Photon Imaging Reveals the Modulatory Effects of mTOR Inhibition on Excitatory Neuronal Activity at the Infiltrative Glioma Margin.
a) Representative timeline of experimental design to record functional in vivo alterations in tumor-associated neurons in awake animals using two-photon imaging before and after mTOR inhibition via AZD8055. b) The fraction neurons involved per synchronous event was significantly higher between the tumor-associated neurons pre-AZD8055 and control no-tumor neurons (p = 1.6733e-29) and was significantly lowered after AZD8055 administration (p = 8.8852e-08). The post-AZD8055 group remained significantly higher than the control no-tumor (p = 9.0423e-06). N = 5 mice in each condition. Wilcoxon rank-sum test was used. Yellow lines represent the mean. c) Representative time series of ΔF/F fluorescence from a single stimulus-tuned neuronal ROI during whisker stimulation protocol, with peaks above the threshold indicated. Each whisker stimulation run was three-minutes, including six five-second whisker stimulation epochs separated by 25-second interstimulus intervals. d) Left: Structural imaging of tumor cells was overlaid with maximum intensity projections of functional neuronal calcium to determine the tumor burden of each neuron (red is tumor signal, and green is neuron calcium signal). Right: Representative image of a field of view with tumor cell regions of interest (red), low-tumor-burden neuron regions of interest (blue), and high-tumor-burden neuron regions of interest (yellow). See Supplemental Figure 5a for further details on methodology. e) Cumulative probability plots of neuronal calcium peaks per second, during the full three-minute calcium imaging runs, illustrate that the largest observable difference in the calcium peak rate is found in the increased peaks per minute of the high-tumor-burden neurons, during whisker stimulation, before AZD8055 administration (top panel). These differences were not observed following AZD8055 administration. f) Neuronal somatic calcium events per second were computed during whisker stimulation periods –the five-second stim epoch plus two seconds immediately following whisker stimulation. Differences were observed between high-tumor pre-AZD8055 and the control no-tumor (p = 2.0795e-05), high-tumor pre-AZD8055 and low-tumor, pre-AZD8055 (p = 0.0011). After AZD8055 treatment, there were no significant differences between high-tumor post-AZD8055 and control no-tumor (p = 0.8180), low-tumor post-AZD8055 and control no-tumor (p = 0.6438), high-tumor post-AZD8055 and low-tumor post-AZD8055 (p = 0.9975). N = 9978 neuronal ROIs across 5 control mice, 2226 pre-AZD8055 low tumor burden neuronal ROIs across 5 mice, 373 pre-AZD8055 high tumor burden neuronal ROIs across 5 mice, 1120 post-AZD8055 low tumor burden neuronal ROIs across 5 mice, and 277 post-AZD8055 high tumor burden neuronal ROIs across 4 mice. Wilcoxon rank-sum test was used. Yellow lines represent the mean. g) Plotted are all the individual temporally smoothed stimulus evoked calcium responses across all neurons in each condition. The responses are sorted according to the timing of their maximum response, from earliest to latest. The first and last vertical dashed lines indicate stimulus onset and offset. The middle vertical dashed line indicates the position of the end of the average control response to the stimulation onset. N = 17879 control stimulation responses across 5 mice, 3741 pre-AZD8055 low tumor burden stim responses across 5 mice, 659 high tumor burden stim responses across 5 mice, 1611 post-AZD8055 low tumor burden stim responses across 5 mice, 342 post-AZD8055 high tumor burden stim responses across 4 mice. h) Plotted are the average stimulus evoked responses for each condition, across all animals, from the corresponding data in Fig 4g.

References

    1. Rudà R., Bello L., Duffau H. & Soffietti R. Seizures in low-grade gliomas: natural history, pathogenesis, and outcome after treatments. Neuro-Oncology 14, iv55--iv64 (2012). 10.1093/neuonc/nos199 - DOI - PMC - PubMed
    1. Klein M. et al. Epilepsy in low-grade gliomas: the impact on cognitive function and quality of life. Ann Neurol 54, 514–520 (2003). 10.1002/ana.10712 - DOI - PubMed
    1. Torres D. & Canoll P. Alterations in the Brain Microenvironment in Diffusely Infiltrating Low-Grade Glioma. Neurosurg Clin N Am 30, 27–34 (2019). 10.1016/j.nec.2018.08.001 - DOI - PubMed
    1. Buckingham S. C. et al. Glutamate release by primary brain tumors induces epileptic activity. Nature Medicine 17, 1269 (2011). 10.1038/nm.2453 - DOI - PMC - PubMed
    1. Campbell S. L., Buckingham S. C. & Sontheimer H. Human glioma cells induce hyperexcitability in cortical networks. Epilepsia 53, 1360−−1370 (2012). 10.1111/j.1528-1167.2012.03557.x - DOI - PMC - PubMed

Publication types