[Preprint]. 2024 Jan 20:2024.01.20.576407.
doi: 10.1101/2024.01.20.576407.

An unconventional regulatory circuitry involving Aurora B controls anaphase onset and error-free chromosome segregation in trypanosomes

Affiliations

An unconventional regulatory circuitry involving Aurora B controls anaphase onset and error-free chromosome segregation in trypanosomes

Daniel Ballmer et al. bioRxiv. .

Update in

Abstract

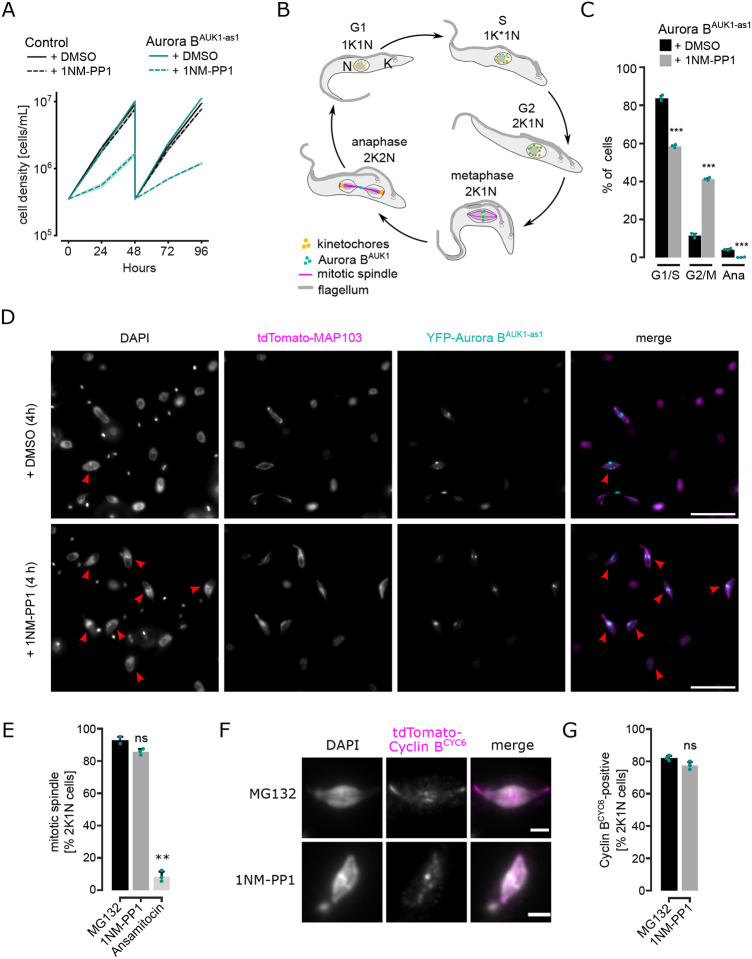
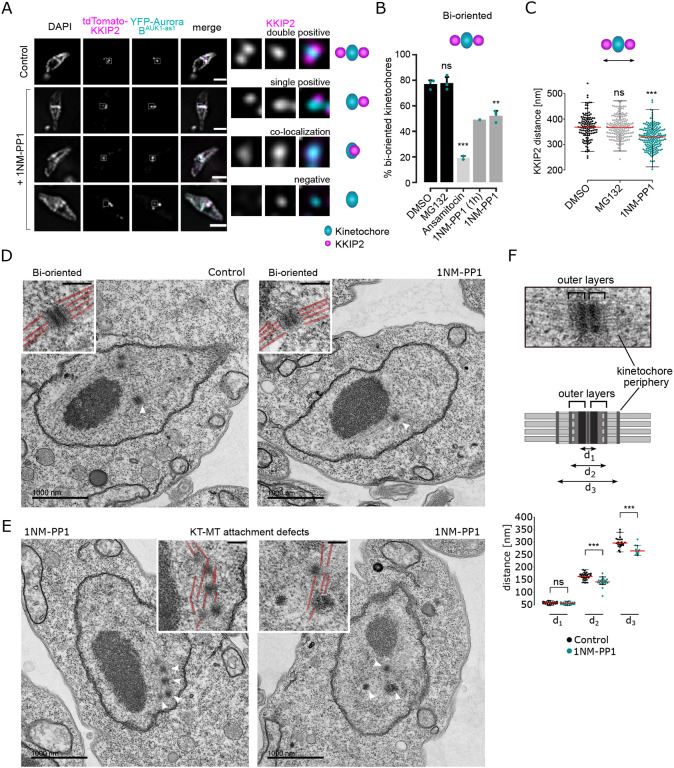
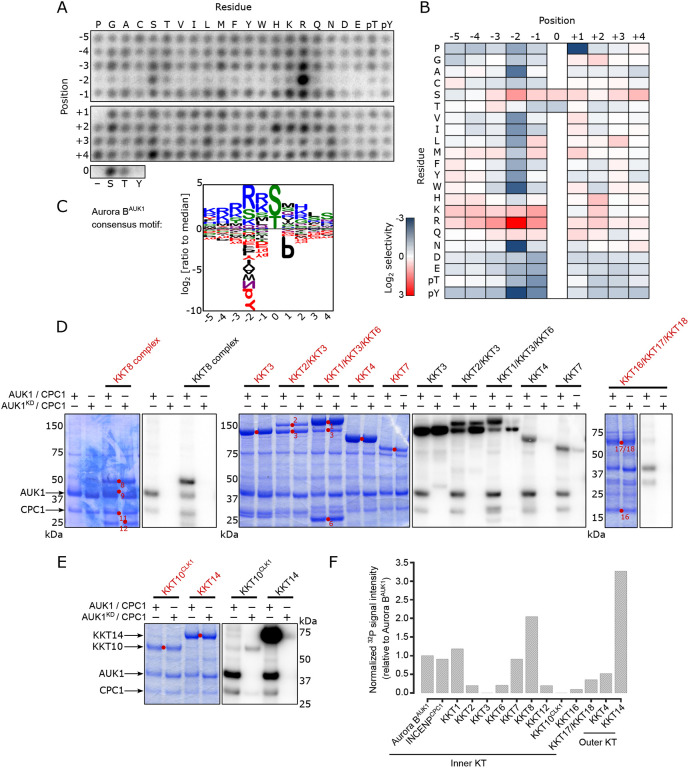
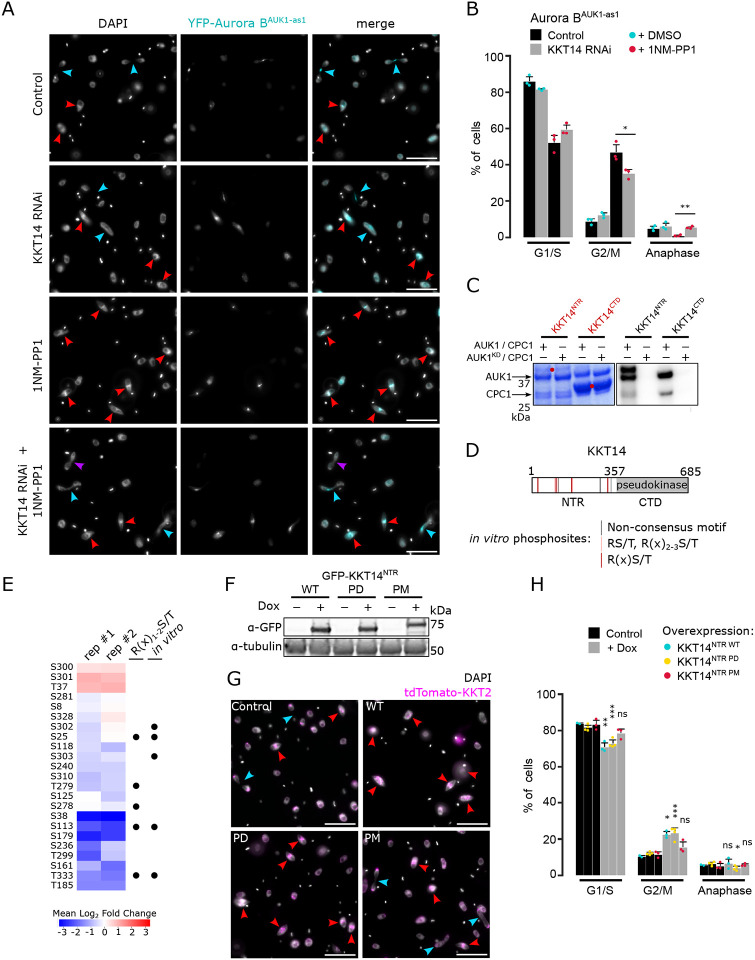
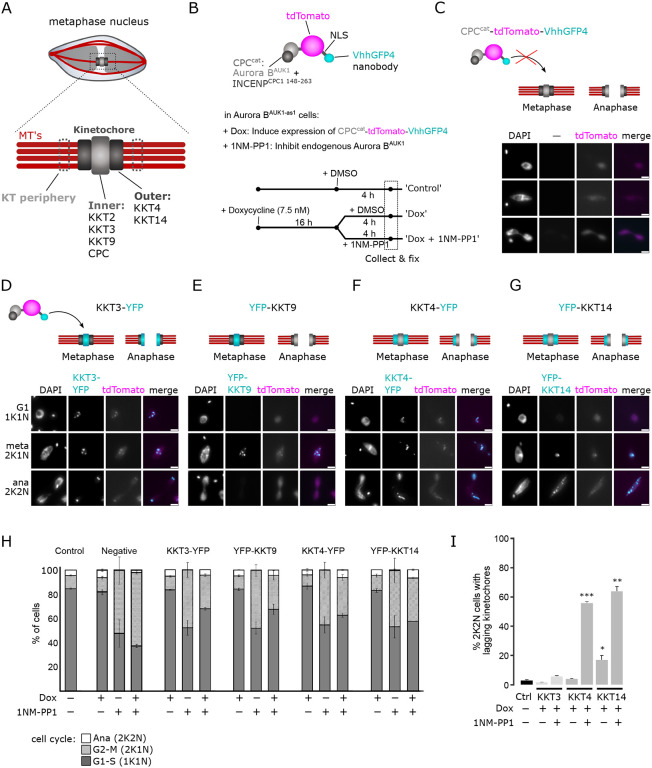
Accurate chromosome segregation during mitosis requires that all chromosomes establish stable bi-oriented attachments with the spindle apparatus. Kinetochores form the interface between chromosomes and spindle microtubules and as such are under tight control by complex regulatory circuitry. As part of the chromosomal passenger complex (CPC), the Aurora B kinase plays a central role within this circuitry by destabilizing improper kinetochore-microtubule attachments and relaying the attachment status to the spindle assembly checkpoint, a feedback control system that delays the onset of anaphase by inhibiting the anaphase-promoting complex/cyclosome. Intriguingly, Aurora B is conserved even in kinetoplastids, an evolutionarily divergent group of eukaryotes, whose kinetochores are composed of a unique set of structural and regulatory proteins. Kinetoplastids do not have a canonical spindle checkpoint and it remains unclear how their kinetochores are regulated to ensure the fidelity and timing of chromosome segregation. Here, we show in Trypanosoma brucei, the kinetoplastid parasite that causes African sleeping sickness, that inhibition of Aurora B using an analogue-sensitive approach arrests cells in metaphase, with a reduction in properly bi-oriented kinetochores. Aurora B phosphorylates several kinetochore proteins in vitro, including the N-terminal region of the divergent Bub1-like protein KKT14. Depletion of KKT14 partially overrides the cell cycle arrest caused by Aurora B inhibition, while overexpression of a non-phosphorylatable KKT14 protein results in a prominent delay in the metaphase-to-anaphase transition. Finally, we demonstrate using a nanobody-based system that re-targeting the catalytic module of the CPC to the outer kinetochore is sufficient to promote mitotic exit but causes massive chromosome mis-segregation in anaphase. Our results indicate that the CPC and KKT14 are involved in an unconventional pathway controlling mitotic exit and error-free chromosome segregation in trypanosomes.


Figures

Figure 1.
Figure 1.. Inhibition of Aurora BAUK1 using an analogue-sensitive approach arrests cells in metaphase.
(A) Growth curves upon treatment of control and Aurora BAUK1-as1 cells with 2 μM 1NM-PP1 or an equal volume of DMSO. The control cell line is heterozygous for the Aurora BAUK1-as1 allele. Cultures were diluted at day 2. Data are presented as the mean ± SD of three replicates. Cell lines: BAP2169, BAP2198. (B) Cartoon depicting the kinetoplast (K) / nucleus (N) configuration throughout the cell cycle in procyclic T. brucei, with K* denoting an elongated kinetoplast (adapted from (Ballmer and Akiyoshi, 2024)). The kinetoplast is an organelle found uniquely in kinetoplastids, which contains the mitochondrial DNA. It replicates and segregates prior to nuclear division, so the KN configuration serves as a cell cycle marker (Woodward and Gull, 1990; Siegel et al., 2008). Aurora BAUK1 localizes to kinetochores from S phase until metaphase and translocates to the central spindle in anaphase. (C) Cell cycle profile of Aurora BAUK1-as1 cells upon treatment with 2 μM 1NM-PP1 or an equal volume of DMSO for 4 h. All graphs depict the means (bar) ± SD of three replicates. A minimum of 450 cells per replicate were quantified. Cell line: BAP2281. (D) Representative fluorescence micrographs showing YFP-Aurora BAUK1-as1 cells expressing tdTomato-MAP103 (spindle marker) treated with 2 μM 1NM-PP1 or an equal volume of DMSO for 4 h. DNA was stained with DAPI. Red arrowheads indicate 2K1N cells. Cell line: BAP2281. Scale bars, 10 μm. (E) Quantification of 2K1N Aurora BAUK1-as1 cells that possess a mitotic spindle (marked by tdTomato-MAP103) upon treatment with 10 μM MG132, 2 μM 1NM-PP1 or 5 nM ansamitocin for 4 h. All graphs depict the means (bar) ± SD of at least two replicates (shown as dots). A minimum of 40 cells per replicate were quantified. (F) Representative fluorescence micrographs showing the localization of tdTomato-cyclin BCYC6 in Aurora BAUK1-as1 cells arrested in metaphase upon treatment with 2 μM 1NM-PP1 or 10 μM MG132 for 4 h. Scale bars, 2 μm. (G) Quantification of Aurora BAUK1-as1 2K1N cells that are positive for tdTomato-cyclin BCYC6 upon treatment with 2 μM 1NM-PP1 or 10 μM MG132 for 4 h. All graphs depict the means (bar) ± SD of two replicates (shown as dots). A minimum of 35 cells per replicate were quantified. * P < 0.05, ** P ≤ 0.01, *** P ≤ 0.001 (two-sided, unpaired t-test).
Figure 2.
Figure 2.. Aurora BAUK1 activity is required for the establishment of stable KT-MT attachments.
(A) Representative fluorescence micrographs showing the configuration of tdTomato-KKIP2 (kinetochore periphery, magenta) and YFP-Aurora BAUK1 (inner kinetochore, cyan) in Aurora BAUK1-as1 cells arrested in metaphase upon treatment with 2 μM 1NM-PP1 or 10 μM MG132 (Control) for 4 h, with a schematic guide for each configuration. Note that the kinetochore periphery component KKIP2 undergoes displacement upon bi-orientation and forms two foci across the inter-sister kinetochore axis (‘double positive’). The insets show the magnification of the boxed region. Scale bars, 2 μm. Cell line: BAP2312. (B) Quantification of bi-oriented kinetochores (as defined in (A)) in Aurora BAUK1-as1 cells in metaphase. Cells were treated with 2 μM 1NM-PP1, 10 μM MG132, 5 nM ansamitocin or DMSO for 4 h unless otherwise stated. * P < 0.05, ** P ≤ 0.01, *** P ≤ 0.001 (two-sided, unpaired t-test). (C) Quantification of the distance between tdTomato-KKIP2 foci at bi-oriented kinetochores in Aurora BAUK1-as1 cells arrested in metaphase upon treatment with DMSO (black), 10 μM MG132 (grey) or 2 μM 1NM-PP1 (cyan) for 4 h. At least 120 kinetochores (shown as dots) from three replicates were analysed per condition. The median is indicated in red. * P < 0.05, ** P ≤ 0.01, *** P ≤ 0.001 (Mann-Whitney U). (D) and (E) Representative transmission electron micrographs showing bi-oriented (D) and improperly attached (E) kinetochores in Aurora BAUK1-as1 cells arrested in metaphase upon treatment with 10 μM MG132 or 2 μM 1NM-PP1 for 4 h. Scale bars, 1 μm. White arrowheads indicate the kinetochores shown in magnified insets (scale bars, 200 nm). Microtubules are marked in red in insets. Cell line: BAP2198. (F) Quantification of the distance between d1, d2 and d3 at bi-oriented kinetochores in Aurora BAUK1-as1 cells arrested in metaphase upon treatment with 10 μM MG132 (Control, black) or 2 μM 1NM-PP1 (cyan) for 4 h. At least 20 kinetochores (shown as dots) from two replicates were analysed per condition. The median is indicated in red. * P < 0.05, ** P ≤ 0.01, *** P ≤ 0.001 (Mann-Whitney U).
Figure 3.
Figure 3.. Profiling Aurora BAUK1 in vitro substrates.
(A) Positional scanning peptide array image of recombinant 3FLAG-Aurora BAUK1/INCENPCPC1. Darker spots indicate preferred residues. The second run is shown in Figure S3. (B) Quantification of (A). Spot intensities were normalized so that the average value within a position was equal to one. The heatmap shows the log2 transformed data (averaged from the two separate runs) with positive selections shown in red and negative selections shown in blue. (C) Aurora BAUK1 substrate motif logo. (D) and (E) Aurora BAUK1 in vitro kinase assay using the indicated recombinant kinetochore proteins as substrates. The left panel (input) shows the Coomassie Brilliant Blue staining. Substrates are marked with red dots. Phosphorylation was detected by autoradiography. (F) Normalized 32P signal intensities for indicated proteins relative to Aurora BAUK1 auto-phosphorylation.
Figure 4.
Figure 4.. Phosphorylation of KKT14 by Aurora BAUK1 regulates anaphase entry.
(A) Representative fluorescence micrographs showing Aurora BAUK1-as1 cells treated with 2 μM 1NM-PP1 or an equal volume of DMSO for 4 h. RNAi-mediated knockdown of KKT14 was induced with 1 μg/mL doxycycline for 20 h. DNA was stained with DAPI. Arrowheads indicate 2K1N (red) and 2K2N (light blue) cells. Purple arrowhead indicates a 2K2N cell that is negative for Aurora BAUK1, suggesting a re-entry into G1 despite failure to complete nuclear division. Cell line: BAP2469. Scale bars, 10 μm. (B) Cell cycle profile for indicated conditions as in (A). All graphs depict the means (bar) ± SD of three replicates. A minimum of 300 cells per replicate were quantified. Cell line: BAP2469. (C) Aurora BAUK1 in vitro kinase assay using the indicated recombinant KKT14 constructs as substrates. The left panel (input) shows the Coomassie Brilliant Blue staining. Substrates are marked with red dots. Phosphorylation was detected by autoradiography. (D) Schematic representation of KKT14 showing NTR and C-terminal pseudokinase domain. NTR phosphorylation sites detected by mass spectrometry are indicated by lines (grey: Non-consensus motif, orange: RS/T or R(x)2-3S/T, red: R(x)S/T) (Supplemental Table S2). Following sites were phosphorylated in vitro by 3FLAG-Aurora BAUK1/INCENPCPC1: S25, T104, S107, S113, T115, S173/S174, S302/S303, T333, T348. (E) Quantification of phospho-sites detected in IP-MS analysis of GFP-KKT14NTR from Aurora BAUK1-as1 cells treated with 2 μM 1NM-PP1 or 10 μM MG132 as a control for 4 h (two replicates each, rep #1 and #2) (Supplemental Table S3). The heatmap shows the log2 fold change the 1NM-PP1-treated samples compared to the control, with positive values shown in red and negative values shown in blue. Black dots indicate whether phospho-sites match the R(x)1-2S/T consensus motif and whether they were detected in vitro. Cell line: BAP2505. (F) Western blot showing protein levels of indicated GFP-KKT14NTR constructs (WT: Wild-type, PD: Phosphodeficient, PM: Phosphomimetic), induced with 1 μg/mL doxycycline for 24 h. Tubulin was used as a loading control. Cell lines: BAP2924, BAP2925, BAP2928. (G) Representative fluorescence micrographs showing cell cycle distribution upon overexpression of indicated KKT14NTR constructs, induced with 1 μg/mL doxycycline for 24 h. TdTomato-KKT2 marks kinetochores and DNA was stained with DAPI. Arrowheads indicate 2K1N (red) and 2K2N (light blue) cells. Cell lines: BAP2924, BAP2925, BAP2928. Scale bars, 10 μm. (H) Cell cycle profile for indicated conditions as in (G). All graphs depict the means (bar) ± SD of three replicates. A minimum of 300 cells per replicate were quantified. Cell lines: BAP2924, BAP2925, BAP2928. * P < 0.05, ** P ≤ 0.01, *** P ≤ 0.001 (two-sided, unpaired t-test).
Figure 5.
Figure 5.. Nanobody-based targeting Aurora BAUK1 to the inner or outer kinetochore.
(A) Schematic illustration of the trypanosome kinetochore, indicating proteins localizing to the inner or outer kinetochore. (B) Top: Schematic illustration of CPCcat-tdTomato-VhhGFP4. Aurora BAUK1 is fused to the C-terminal domain of INCENPCPC1, which binds to Aurora BAUK1 and contains the IN-box required for full Aurora BAUK1 activity, but lacks the regions required to interact with endogenous KIN-A:KIN-B at the inner kinetochore (Ballmer and Akiyoshi, 2024). The fusion construct also contains a nuclear localization signal (NLS) between tdTomato and VhhGFP4. Bottom: Schematic of Aurora BAUK1 targeting experiment. Expression of CPCcat-tdTomato-VhhGFP4 was induced for 16 h using 7.5 nM doxycycline in cell lines harboring YFP-tagged inner (KKT3, KKT9) or outer (KKT4, KKT14) kinetochore proteins, followed by addition of either DMSO (Control) or 2 μM 1NM-PP1 for 4 h to inhibit the endogenous Aurora BAUK1 kinase. Cells were then fixed and cell cycle distribution and lagging kinetochores were scored. (C) Fluorescence micrographs showing diffuse nuclear localization of CPCcat-tdTomato-VhhGFP4 induced with 7.5 nM doxycycline in a cell line lacking YFP-tagged kinetochore proteins. Cell line: BAP2671. Scale bars, 2 μm. (D) to (G) Representative fluorescence micrographs showing the co-localization of CPCcat-tdTomato-vhhGFP4 with YFP-tagged KKT3 (D), KKT9 (E), KKT4 (F) and KKT14 (G). The localization dynamics of the YFP-tagged kinetochore proteins (marked in cyan) in metaphase and anaphase are schematically depicted on top. Cell lines: BAP2673, BAP2990, BAP2991, BAP2992. Scale bars, 2 μm. (H) Cell cycle profiles for indicated treatment regimes. ‘Control’ cells were treated with DMSO for 4 h. ‘Negative’ control corresponds to a cell line that does not express any YFP-tagged protein (as shown in (C)). All graphs depict the means (bar) ± SD of at least two replicates. A minimum of 500 cells per replicate were quantified. (I) Quantification of lagging kinetochores in 2K2N cells under indicated treatment regimes. ‘Control’ cells were treated with DMSO for 4 h. Note that lagging kinetochores could not be assessed in the cell line expressing YFP-KKT9, because KKT9 is not present at kinetochores in anaphase. All graphs depict the means (bar) ± SD of at least two replicates (dots). A minimum of 35 cells per replicate were quantified. * P < 0.05, ** P ≤ 0.01, *** P ≤ 0.001 (two-sided, unpaired t-test).

Similar articles

References

    1. Akiyoshi B., and Gull K.. 2013. Evolutionary cell biology of chromosome segregation: insights from trypanosomes. Open Biol. 3. doi:10.1098/rsob.130023. - DOI - PMC - PubMed
    1. Akiyoshi B., and Gull K.. 2014. Discovery of Unconventional Kinetochores in Kinetoplastids. Cell. 156. doi:10.1016/j.cell.2014.01.049. - DOI - PMC - PubMed
    1. Alfieri C., Chang L., Zhang Z., Yang J., Maslen S., Skehel M., and Barford D.. 2016. Molecular basis of APC/C regulation by the spindle assembly checkpoint. Nature. 536. doi: 10.1038/nature19083. - DOI - PMC - PubMed
    1. Alfieri C., Zhang S., and Barford D.. 2017. Visualizing the complex functions and mechanisms of the anaphase promoting complex/cyclosome (APC/C). Open Biol. 7. doi:10.1098/RSOB.170204. - DOI - PMC - PubMed
    1. Allen J.W.A., Jackson A.P., Rigden D.J., Willis A C., Ferguson S.J., and Ginger M.L.. 2008. Order within a mosaic distribution of mitochondrial c-type cytochrome biogenesis systems? FEBS J. 275:2385–2402. doi:10.1111/J.1742-4658.2008.06380.X. - DOI - PubMed

Publication types