[Preprint]. 2024 Jan 21:2024.01.16.575958.
doi: 10.1101/2024.01.16.575958.

Gamma protocadherins in vascular endothelial cells inhibit Klf2/4 to promote atherosclerosis

Affiliations

Gamma protocadherins in vascular endothelial cells inhibit Klf2/4 to promote atherosclerosis

Divyesh Joshi et al. bioRxiv. .

Update in

  • Endothelial γ-protocadherins inhibit KLF2 and KLF4 to promote atherosclerosis.
    Joshi D, Coon BG, Chakraborty R, Deng H, Yang Z, Babar MU, Fernandez-Tussy P, Meredith E, Attanasio J, Joshi N, Traylor JG Jr, Orr AW, Fernandez-Hernando C, Libreros S, Schwartz MA. Joshi D, et al. Nat Cardiovasc Res. 2024 Sep;3(9):1035-1048. doi: 10.1038/s44161-024-00522-z. Epub 2024 Sep 4. Nat Cardiovasc Res. 2024. PMID: 39232138 Free PMC article.

Abstract

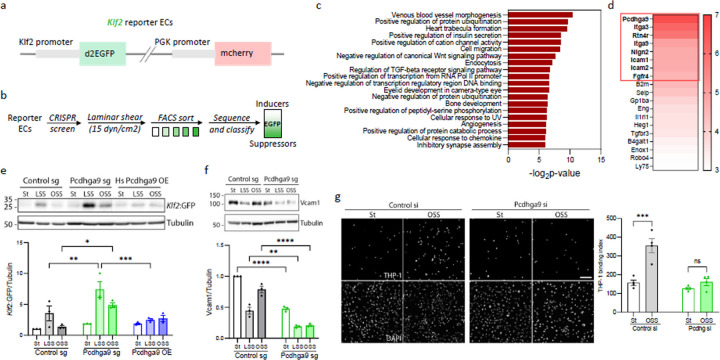
Atherosclerotic cardiovascular disease (ASCVD) is the leading cause of mortality worldwide1. Laminar shear stress (LSS) from blood flow in straight regions of arteries protects against ASCVD by upregulating the Klf2/4 anti-inflammatory program in endothelial cells (ECs)2-8. Conversely, disturbed shear stress (DSS) at curves or branches predisposes these regions to plaque formation9,10. We previously reported a whole genome CRISPR knockout screen11 that identified novel inducers of Klf2/4. Here we report suppressors of Klf2/4 and characterize one candidate, protocadherin gamma A9 (Pcdhga9), a member of the clustered protocadherin gene family12. Pcdhg deletion increases Klf2/4 levels in vitro and in vivo and suppresses inflammatory activation of ECs. Pcdhg suppresses Klf2/4 by inhibiting the Notch pathway via physical interaction of cleaved Notch1 intracellular domain (NICD Val1744) with nuclear Pcdhg C-terminal constant domain (CCD). Pcdhg inhibition by EC knockout (KO) or blocking antibody protects from atherosclerosis. Pcdhg is elevated in the arteries of human atherosclerosis. This study identifies a novel fundamental mechanism of EC resilience and therapeutic target for treating inflammatory vascular disease.

Keywords: fluid shear stress; mechanotransduction; protocadherin gamma A9; vascular inflammation.


Figures

Figure 1.
Figure 1.. Genome wide CRISPR screen identifies Klf2 suppressors.
(a) Schematic of the Klf2 reporter stably expressed in Mouse Aortic Endothelial Cells (MAEC). Destabilized EGFP (d2EGFP) is driven by the Klf2 promoter while mCherry is driven by a constitutive PGK promoter as an internal control. (b) Schematic of the genome wide CRISPR screen to identify modifiers (activators and suppressors) of Klf2 induction under laminar shear stress (LSS; 15 dyn/cm2 LSS for 16 h). (c) Functional categorization of the candidate Klf2 suppressors (cumulative z score >4, 160 hits) using Ingenuity Pathway Analysis (IPA, Qiagen). (d) candidate suppressors intersecting with ‘cell-surface exposed proteins on outer plasma membrane’ GO term to identify candidates amenable to function neutralization by blocking antibodies (red box: validated hits). (e) Klf2:GFP reporter MAECs were transduced with Cas9 plus Control sg, Pcdhga9 sg or with a human Pcdhga9 (Hs Pcdhga9) vector. Cells were exposed to static (St), LSS, or disturbed oscillatory shear stress (OSS) for 16 h and immunoblotted for Klf2:GFP (N=3). Graph: quantitation of Klf2:GFP normalized to Tubulin loading control. (f) Immunoblot for the inflammatory marker VCAM1 in Control or Pcdhga9 depleted MAECs exposed to St, LSS or OSS (N=3). Graph: quantitation of VCAM1 normalized to Tubulin loading control. (g) THP-1 monocyte binding to Control si or Pcdhga9 si Human Umbilical Vein Endothelial Cells (HUVECs) exposed to St or OSS for 16 h (N=4). Graph: quantitation of bound THP1 monocytes per field (THP1 binding index). Statistical analysis used one-way ANOVA. Scale bar: (g) 100 μm.
Figure 2.
Figure 2.. Protocadherin gamma (Pcdhg) gene cluster suppresses hemodynamic Klf2/4.
(a) Top: schematic of Pcdhg gene cluster organization consisting of 22 genes with their unique/variable first exon (and individual promoter, not shown) and three common/constant 3’ exons that form the common cytoplasmic domain (CCD). Bottom: strategy for silencing (knocking down) the entire Pcdhg gene cluster with a siRNA targeting the common region (shaded bar and dashed lines). (b) Validation of siRNA mediated knockdown of the entire Pcdhg gene cluster (22 genes) in HUVECs by immunoblot with an antibody to the common domain (N=3). Graph: quantitation of Pcdhg levels normalized to GAPDH loading control. (c, d) qRT-PCR for Klf2 (c) and Klf4 (d) in control and Pcdhg-depleted HUVECs exposed to St, LSS and OSS for 16 h. (e) THP-1 monocyte binding to Control si or Pcdhg si HUVECs exposed to St or OSS for 16 h (N=3). Graph: quantitation of THP1 monocytes per field per condition (THP1 binding index). (f) Immunoblot for Klf4 in Control si or Pcdhg si HUVECs, treated with lovastatin (0.0, 0.1 or 1.0 μM) for 16 h. Graph: quantitation of Klf4 normalized to GAPDH loading control. (g) Immunoblot for VCAM1 and Klf4 in Control si or Pcdhg si HUVECs, untreated or treated with TNFα (1 ng/ml) for 16 h (N=3). Graphs: quantitation of VCAM1 and Klf4 normalized to GAPDH loading control with or without TNFα. (h) THP-1 monocyte binding to Control si or Pcdhg si HUVECs untreated or treated with TNFα (1ng/ml) for 16h (N=6). Graph: quantitation of THP1 monocytes per field per condition. Statistical analysis was carried out using one-way ANOVA. Scale bar: (e) 100 μm, (h) 250 μm.
Figure 3.
Figure 3.. Pcdhg endothelial knockout protects against atherosclerosis.
(a) Schematic showing Pcdhg floxed mouse (Pcdhgfcon3 mouse line,) and generation of Pcdhg endothelial knockout (ECKO) by crossing Pcdhgfcon3 with Cdh5Cre. The third constant exon is tagged with GFP and floxed. Cre-mediated recombination excises the third constant exon creating a premature stop codon leading to non-sense mediated decay. (b) Analysis of progeny genotype showing Pcdhg ECKO at the expected Mendelian ratio. (c) Aortic arch from Control or Pcdhg ECKO adult mice immunostained for Klf4 and examined en face (N=3). Geater curvature denotes the regions of laminar shear while lesser curvature denotes the regions of low, disturbed shear. Graph: quantitation of the mean fluorescence intensity (MFI) per cell. (d) Schematic of atherosclerosis study. 8–10 week-old Control or Pcdhg ECKO mice were injected with pCSK9-Adeno Associated Virus 8 (AAV8) and maintained on High Fat Diet (HFD) for 16 weeks, starved overnight, and analyzed for blood lipids and vessel histology. (e, f) Whole aortas were stained with Oil Red O to mark lipid-rich regions and imaged en face (N=6 each sex). Graph: quantitation of percent Oil Red O positive area for males (e) and females (f). (g) Sections from aortic roots were stained with Hematoxylin and Eosin (H&E) (N=5) or Oil Red O. Graphs: quantitation of atherosclerotic plaque area, necrotic core (NC) area and fibrous cap (FC) thickness. (h) Atherosclerotic plaques (dotted area) in aortic root sections were stained for the macrophage/monocyte marker CD68 (N=3). Graph: quantitation of CD68 MFI. Statistical analysis was carried out using Student’s t-test. Scale bar: (c) 50 μm, (e, f) 500 μm, (g, h) 200 μm.
Figure 4.
Figure 4.. Signaling via nuclear ICD is necessary and sufficient for suppression of Klf2/4.
(a, b) Gene organization of Pcdhg cluster with the three 3’ exons (blue), coding for the Carboxy terminal constant domain (CCD) shared by all 22 members. (b) Mutant constructs. (c) HUVECs transfected with indicated constructs and treated with LSS for 16h. Immunoblotting confirms expression of mutants and effects on endogenous Klf4 (N=3). Graph: quantitation of Klf4 normalized to GAPDH loading control. The C-terminal GFP-tagged mutants were expressed at comparable levels (GFP immunoblot). (d) Schematic showing cleavage and nuclear translocation of the Pcdhg ICD. (e) HUVECs expressing additional mutants (C-terminal FLAG-tagged) were immunostained for FLAG and counterstained with DAPI to mark nuclei (N=3). (f) HUVECs expressing the mutants were exposed to LSS and immunoblotted for Klf4 (N=3). Graph: quantitation of Klf4 normalized to GAPDH loading control. The C-terminal FLAG-tagged mutants were expressed at comparable levels (FLAG immunoblot). Full: Full length; ECD: Extracellular domain; TM: Transmembrane domain; VCD: Variable C-terminal domain; CCD: Constant C-terminal domain; ΔCCD: Deleted CCD; ICD: Intracellular domain (VCD+CCD); NLS: Nuclear Localization Signal; ΔNLS: Deleted NLS. Statistical analysis used Student’s t-test. Scale bar: (e) 20 μm. *p < 0.05, **p < 0.01, ***p < 0.001, ****p < 0.0001.
Figure 5.
Figure 5.. A physical and functional Pcdhg-Notch axis regulates hemodynamic Klf2/4.
(a) Schematic of bulk RNAseq analysis of Control si, Pcdhg si and Pcdhg+Klf2/4 triple si HUVECs to identify Pcdhg-dependent, Klf2/4 independent DEGs (green shaded area). (b) Immunoblot validation of Pcdhg and Klf4 depletion. (c) Upstream regulatory pathway/process analysis from the DEGs using Enrichr. (d) Heat map of upregulated Notch target genes in Pcdhg si and Pcdhg si+Klf2/4 si compared to Control si from the RNAseq analysis. (e) Control si or Pcdhg si HUVECs were exposed to St or LSS for 2h and immunoblotted for the cleaved Notch1 Intracellular Domain (NICD Val1744) (N=3). Graph: quantitation of NICD Val1744 normalized to GAPDH loading control. (f) The NICD-dependent transcription was blocked with RIN1, a pharmacological inhibitor of Notch-RBPJ interaction (RBPJi) or RBPJ siRNA (RBPJ si). HUVECs were exposed to LSS for 16h and immunoblotted for Klf2 and Klf4 (N=3). Graph: quantitation of Klf2 and Klf4 normalized to GAPDH loading control. (g) Schematic showing Notch1. ECD: Extracellular domain; TM: Transmembrane domain; ICD: Intracellular Domain. The asterisks (*) show the NICD peptides identified in the Mass Spectrometry analysis of the Ips of full but not the ΔCCD Pcdhg mutant. (h, i) Co-IP of Pcdhg and NICD Val1744. Inputs used as loading controls for IPs. (h) HUVECs expressing full or ΔCCD Pcdhg (C-term GFP-tagged) were immunoprecipitated (IP) with GFP nanobody beads and immunoblotted for NICD Val1744 (N=3). Vector alone used as negative control for the IP. (i) HUVECs expressing CCD or ΔNLS-CCD mutant (C-term FLAG-tagged) were immunoprecipitated (IP) with FLAG antibody beads and immunoblotted for NICD Val1744 (N=3). Statistical analysis was carried out using Student’s t-test or one-way ANOVA. *p < 0.05, **p < 0.01, ***p < 0.001, ****p < 0.0001.
Figure 6.
Figure 6.. Pcdhga9 blocking antibody in experimental atherosclerosis.
(a) Schematic of homophilic adhesion assay and function blocking monoclonal antibody (mAb) generation from Pcdhga9 ECD. (b) Pcdhga9 ECD was immobilized in 96 wells and percent MAECs that adhered measured (N=3). (c) Adhesion of MAECs to ECD in the presence of Isotype control or function-blocking mAb A9 (N=4). Graph: quantitation of percent total cells adhered to ECD. (d, e) Klf2:GFP reporter MAECs with Isotype control or mAb A9 tested for Klf2:GFP expression after 16h LSS (N=12) or immunostained for VCAM1 after OSS for 16 h OSS (N=7). Graphs: quantitation of Klf2:GFP and VCAM1 levels normalized to mCherry internal control. (f) Schematic of Partial Carotid Artery (PCA) Ligation model of accelerated atherosclerosis. LCA: Left Carotid Artery; RCA: Right Carotid Artery. (g) Experimental design. Antibodies were administration via intraperitoneal (IP) injection into in Apoe−/− mice. (h) Whole mount brightfield image showing branching of LCA and RCA from aorta, with atherosclerotic plaque (yellow brackets) visible in the ligated LCA. (i) LCA and RCA sections were stained with Oil Red O to identify for lipid-rich atherosclerotic plaque (N=6). Graph: quantitation of Oil Red O positive area fraction. Statistical analysis was carried out using Student’s t-test. Scale bar: (c, i) 100 μm, (h) 1 mm. *p < 0.05, **p < 0.01, ***p < 0.001, ****p < 0.0001.
Figure 7.
Figure 7.. Pcdhg in human atherosclerosis.
(a) Artery sections from human CVD patients and healthy controls stained for Pcdhg and for Erg to mark ECs (N=8). Graph: quantitation of Pcdhg level in ECs. (b) Human coronary artery sections from elderly donors stained for Pcdhg levels, comparing Plaque region to segments of the same artery without evident plaque (Normal region). Sections were stained for Erg to mark ECs (N=3). Graph: quantitation of Pcdhg staining intensity in ECs. Statistical analysis used Student’s t-test. Scale bar: (a, b) 50 μm. *p < 0.05, **p < 0.01, ***p < 0.001, ns (not significant) > 0.05.

References

    1. Barquera S. et al. Global Overview of the Epidemiology of Atherosclerotic Cardiovascular Disease. Arch Med Res 46, 328–338, doi:10.1016/j.arcmed.2015.06.006 (2015). - DOI - PubMed
    1. Andreou I. et al. How do we prevent the vulnerable atherosclerotic plaque from rupturing? Insights from in vivo assessments of plaque, vascular remodeling, and local endothelial shear stress. J Cardiovasc Pharmacol Ther 20, 261–275, doi:10.1177/1074248414555005 (2015). - DOI - PubMed
    1. Baeyens N., Bandyopadhyay C., Coon B. G., Yun S. & Schwartz M. A. Endothelial fluid shear stress sensing in vascular health and disease. J Clin Invest 126, 821–828, doi:10.1172/JCI83083 (2016). - DOI - PMC - PubMed
    1. Fledderus J. O. et al. KLF2 primes the antioxidant transcription factor Nrf2 for activation in endothelial cells. Arterioscler Thromb Vasc Biol 28, 1339–1346, doi:10.1161/ATVBAHA.108.165811 (2008). - DOI - PubMed
    1. Hahn C. & Schwartz M. A. Mechanotransduction in vascular physiology and atherogenesis. Nat Rev Mol Cell Biol 10, 53–62, doi:10.1038/nrm2596 (2009). - DOI - PMC - PubMed

Publication types