[Preprint]. 2024 Jan 19:2024.01.18.576274.
doi: 10.1101/2024.01.18.576274.

Expanding the ligandable proteome by paralog hopping with covalent probes

Affiliations

Expanding the ligandable proteome by paralog hopping with covalent probes

Yuanjin Zhang et al. bioRxiv. .

Abstract

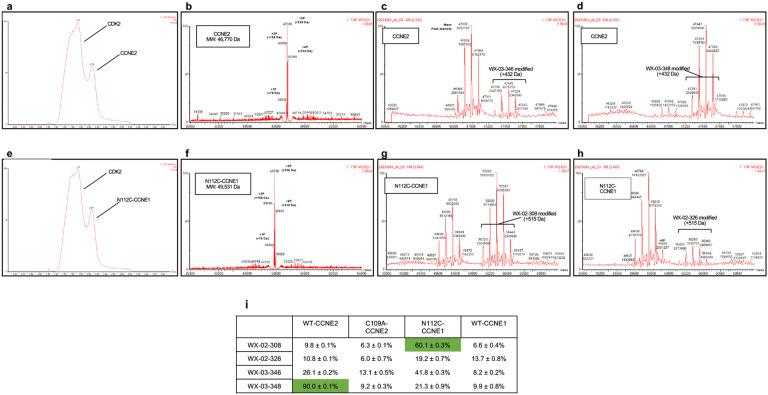
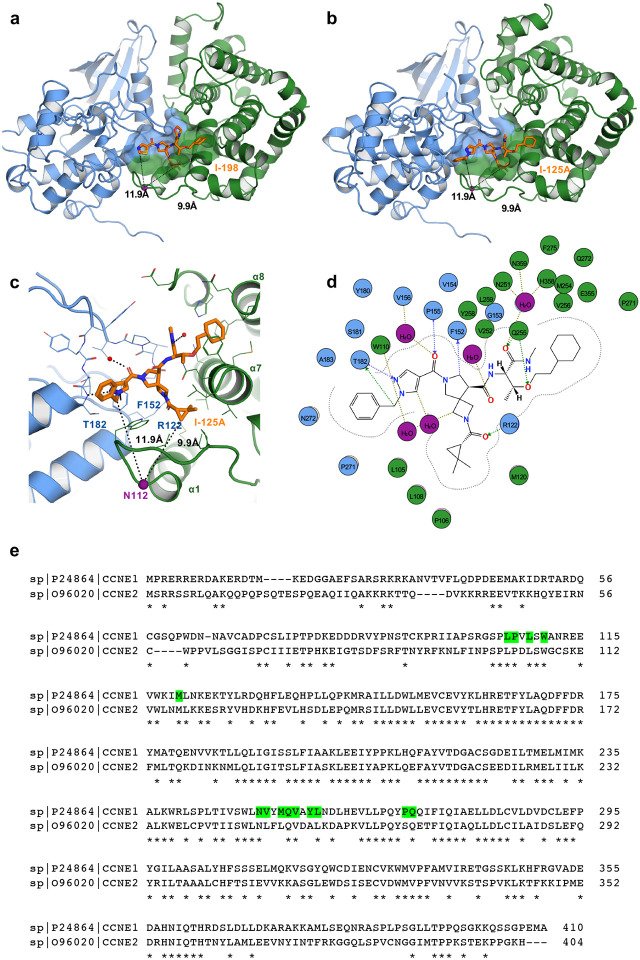
More than half of the ~20,000 protein-encoding human genes have at least one paralog. Chemical proteomics has uncovered many electrophile-sensitive cysteines that are exclusive to a subset of paralogous proteins. Here, we explore whether such covalent compound-cysteine interactions can be used to discover ligandable pockets in paralogs that lack the cysteine. Leveraging the covalent ligandability of C109 in the cyclin CCNE2, we mutated the corresponding residue in paralog CCNE1 to cysteine (N112C) and found through activity-based protein profiling (ABPP) that this mutant reacts stereoselectively and site-specifically with tryptoline acrylamides. We then converted the tryptoline acrylamide-N112C-CCNE1 interaction into a NanoBRET-ABPP assay capable of identifying compounds that reversibly inhibit both N112C- and WT-CCNE1:CDK2 complexes. X-ray crystallography revealed a cryptic allosteric pocket at the CCNE1:CDK2 interface adjacent to N112 that binds the reversible inhibitors. Our findings thus provide a roadmap for leveraging electrophile-cysteine interactions to extend the ligandability of the proteome beyond covalent chemistry.


Figures

Extended Data Figure 1.
Cancer Dependency Map data for CCNE1 and CCNE2, indicating the number of human cancer cell lines showing gene effect scores < −1.0, reflecting strong dependency on the gene.
Extended Data Figure 2.
Extended Data Figure 2.. Gel-ABPP data for a N112C- and WT-CCNE1:CDK2 complexes treated with a focused library of alkyne-modified tryptoline acrylamides.
Gel-ABPP data for purified N112C- or WT-CCNE1:CDK2 complexes (1 μM) exposed to alkyne-modified tryptoline acrylamides (5 μM, 1 h) followed by CuAAC conjugation to an Rh-N3 tag, SDS-PAGE, and in-gel fluorescence scanning. Coomassie blue signals correspond to WT- or N112C-CCNE1. Red box marks profile of WX-02-520, which reacts with N112C-CCNE1 in a stereoseletive (compared to enantiomer WX-02-521) and site-specific (compared to WT-CCNE1) manner.
Extended Data Fig. 3.
Structures of alkyne-modified tryptoline acrylamides screened for reactivity with N112C-CCNE1:CDK1 complexes.
Extended Data Figure 4.
Extended Data Figure 4.. N112C-CCNE1 and WT-CCNE2 show differential reactivity profiles with tryptoline acrylamides.
a, Gel-ABPP data showing concentration-dependent, stereoselective blockade of WX-02-520 engagement of purified N112C-CCNE1 by WX-02-308 in comparison to enantiomer WX-02-326. Purified N112C-CCNE1:CDK2 complex (1 μM) was pre-treated with the indicated concentrations of WX-02-308 or WX-02-326 (2 h) followed by WX-02-520 (1 μM) and processing for gel-ABPP. Data are from a single experiment. b, Gel-ABPP data showing stereoselective engagement of WT-CCNE2, but not C109A-CCNE2 by WX-02-346 in comparison to enantiomer WX-02-348 or the WX-02-520 and WX-02-521 stereoprobes. Purified WT- or C109A-CCNE2:CDK2 complexes were treated with the indicated concentrations of alkyne tryptoline acrylamides followed by processing for gel-ABPP.,
Extended Data Figure 5.
Extended Data Figure 5.. Mass spectrometry (MS) analysis of tryptoline acrylamide stereoprobe reactivity with purified CCNE2- and N112C-CCNE1:CDK2 complexes.
a, b, Reverse-phase liquid chromatography-MS traces for purified recombinant WT-CCNE2 (a) and N112C-CCNE1 (b) complexes with CDK2. c-e, Deconvoluted intact mass analysis of the peak mass spectrum for CCNE2 with no compound treatment (c), WX-02-346 treatment (d), and WX-02-348 treatment (e). Multiple phosphorylation states can be assigned to each peak based on expected mass and mass shifts (+80 Da / phosphate). f-h, Deconvoluted intact mass analysis of the peak mass spectrum for N112C-CCNE1 with no compound treatment (f), WX-02-308 treatment (g), and WX-02-326 treatment (h). For c-h, each peak is annotated with mass (top) and peak intensity (bottom). Peak intensities were used to semi-quantitatively assess relative species abundance (shown in table in i). Multiple phosphorylation states for each protein can be assigned to each peak based on expected mass and mass shifts (+80 Da / phosphate). i, Summary of results listing relative abundance of each modified protein species as percent of total across the four tested stereoprobes. Also included are results from experiments performed with control proteins (C109A-CCNE2 and WT-CCNE1) that show only minor and non-stereoselective reactivity with the tested stereoprobes. Green highlights values where substantial (> 50%) and stereoselective (>3X over enantiomer) stereoprobe engagement of the indicated CCNE protein was observed.
Extended Data Figure 6.
Extended Data Figure 6.. Reactivity of PEG-conjugated tryptoline acrylamides with N112C-CCNE1.
a, Structures of PEG-conjugated tryptoline acrylamide stereoprobes. b, Gel-ABPP data showing stereoselective blockade of WX-02-520 engagement of purified N112C-CCNE1 by WX-02-588-conjugate in comparison to enantiomer WX-02-589-conjugate or additional stereoprobes WX-02-520-conjugate and WX-02-521-conjugate. Purified N112C-CCNE1:CDK2 complex (1 μM) was pre-treated with the indicated concentrations of PEG-conjugated stereoprobes (2 h) followed by WX-02-520 (1 μM, 1 h) and processing for gel-ABPP. Red asterisks mark decreased WX-02-520 reactivity with N112C-CCNE1 in samples pre-treated with WX-02-588-conjugate.
Extended Data Fig 7.
Extended Data Fig 7.. Characterization of YZ-01-A interactions with N112C-CCNE1.
a, Gel-ABPP data showing that YZ-01-A stereoselectively engages purified N112C-CCNE1:CDK2 but not WT-CCNE1:CDK2 complexes. The purified N112C- or WT-CCNE1:CDK2 complexes were incubated with YZ-01-A or YZ-01-B (5 μM, 1 or 2 h) followed by processing of samples for gel-ABPP. Data are from a single experiment. b, Gel-ABPP data showing stereoselective engagement of N112C-CCNE1, but not WT-CCNE1 by YZ-01-A in lysates from HEK293T cells recombinantly co-expressing NLuc-N112C-CCNE1-3xFLAG (or NLuc-WT-CCNE1-3xFLAG) and CDK2 were treated with YZ-01-A or YZ-01-B (10 μM, 90 min) followed by processing of samples for gel-ABPP. Data are from a single experiment. c, Structures of WX-02-14 and WX-02-34. d, Gel-ABPP data showing concentration-dependent stereoselective blockade of YZ-01-A engagement of N112C-CCNE1 by WX-02-14 in comparison to WX-02-34. Lysates from HEK293T cells co-transfected with NLuc-N112C-CCNE1 or NLuc-WT-CCNE1 and CDK2 were treated with the indicated concentration ranges of compounds followed by YZ-01-A (10 μM, 90 min), anti-FLAG immunoprecipitation, and processing for gel-ABPP. e, Comparison of gel- and NanoBRET-ABPP data showing concentration-dependent, stereoselective blockade of YZ-01-A engagement of NLuc-N112C-CCNE1 by WX-02-14 in comparison to WX-02-34 (0.2 – 50 μM, 2 h). Dashed horizontal line marks background signals for NanoBRET-ABPP assays performed with YZ-01-A (10 μM, 90 min) and NLuc-WT-CCNE1. CI, confident intervals. Data represent average values ± s.e.m., n = 3. f, NanoBRET-ABPP data showing a time-dependent increase in potency of blockade of YZ-01-A reactivity with N112C-CCNE1 by WX-02-14 and WX-02-308. Data represent average values ± s.e.m., n = 3.
Extended Data Fig. 8.
Extended Data Fig. 8.. Additional characterization of allosteric inhibitors of CCNE1:CDK2 complexes.
a, b, ADP-Glo data showing effects of the indicated compounds on the activity of a purified WT-CCNE1:CDK2 (a) or WT-CCNE2:CDK2 (b) complexes as measured by phosphorylation of the C-terminal peptide of RB1 (left) or the histone H1 protein (right). The WT-CCNE:CDK2 complexes were pre-treated with compounds for 2 h (37 °C) before initiating phosphorylation reactions by addition of substrate. CI, confident intervals. Data represent average values ± s.e.m., n = 3. c, Gel-ABPP data showing concentration-dependent blockade of YZ-01-A engagement of N112C-CCNE1 following incubation with I-125A or I-198 for 30 min or 90 min. Experiment was performed as described in Fig. 3c. Data are from a single experiment. d, Gel-ABPP data showing that residual YZ-01-A reactivity with N112C-CCNE1 in presence of 1 μM of I-125A or I-198 is stereoselective (greater than signals generated with YZ-01-B) and site-specific (greater than signals generated with WT-CCNE1). Experiments were performed as described in Fig. 3c. Data represent average values ± s.e.m., n = 2. e, NanoBRET data showing concentration-dependent blockade of active site-directed tracer K-10 (0.2 μM) binding to N112C-CCNE1:CDK2-NLuc (left) or WT-CCNE1:CDK2-NLuc complexes by dinaciclib, but not I-125A. NanoBRET assays were performed in lysates of HEK293T cells recombinantly expressing the CCNE1:CDK2-NLuc complexes. Data represent average values ± s.e.m., n = 3.
Extended Data Fig. 9.
Extended Data Fig. 9.. Crystal structures of I-125A and I-198-CCNE1:CDK2 complexes.
a, Ribbon diagram structure of CCNE1:CDK2 (green: blue) complex with the I-198 compound shown in orange and the binding cavity shown as a transparent surface. b, Ribbon diagram structure of CCNE1:CDK2 (green: blue) complex with the I-125A compound shown in orange. For a, b, N112 is shown in purple and the distance from this residue to ligands indicated by dashes. c, Detailed view of the I-125A binding site, protein-ligand interactions, and the distance to N112 indicated by dashes. CCNE1 and CDK2 residues are shown in green and blue, respectively, and water molecules are in magenta. d, Protein-ligand interaction plot between CCNE1: CDK2 and I-125A. e, A global sequence alignment of CCNE1 and CCNE2. CCNE1 residues shown in Figure 4c and Extended Data Fig. 9d are highlighted in green.
Extended Data Figure 10.
Extended Data Figure 10.. Impact of tryptoline acrylaimdes WX-02-14 and WX-02-34 on protein interactions of CCNE1:CDK2 complexes.
a, Quantification of data for CKS1B and CKS2 in co-immunoprecipitation-MS experiments performed in HEK293T cells recombinantly expressing N112C-CCNE1-3xFLAG (or WT-CCNE1-3xFLAG) and CDK2 treated with WX-02-14 or WX-02-34 (20 μM, 6 h) or DMSO. Data represent average ± s.e.m., n = 4. Unpaired t test with Welch’s correction was used to test statistical significance. p values: 0.0011 and 0.0021 for CKS1B in WX-02-14-treated vs DMSO-treated and WX-02-34-treated N112C-CCNE1-expressing cells, respectively; 0.0017 and 0.0032 for CKS2 in WX-02-14-treated vs DMSO-treated and WX-02-34-treated N112C-CCNE1-expressing cells, respectively. b, Overlay of crystal structures of CKS1 B:CDK2 (PDB: 1BUH) and CCNE1:CDK2 (PDB: 5L2W) showing the relative locations of N112 of CCNE1 and CKS1B.
Extended Data Fig. 11.
Extended Data Fig. 11.. Further characterization of HTS-compatible NanoBRET-ABPP assay for N112C-CCNE1.
a, Time-dependent assessment of signal-to-noise (S/N, signal: N112C-CCNE1 (YZ-01-A); noise: WT-CCNE1 (YZ-01-A) ) for the NanoBRET assay performed as described in Fig. 5c. b, NanoBRET-ABPP data acquired under optimized assay conditions at 185 min time point showing concentration-dependent stereoselective blockade of YZ-01-A engagement of N112C-CCNE1 by WX-02-308 in comparison to WX-02-326 (2 h pre-treatment with compounds) Data are average values ± s.e.m., n = 4.
Figure 1.
Figure 1.. Covalent stereoprobes targeting CCNE2 and an N112C-CCNE1 mutant.
a, Structure of tryptoline acrylamide stereoprobes WX-03-348 and WX-03-59 that stereoselectively engage CCNE2_C109 alongside inactive stereoisomers. Red lines connect enantiomers and blue lines connect diastereomers. b, Protein-directed ABPP data showing stereoselective enrichment of CCNE2 by WX-03-348 (5 μM, 1 h) and blockade of this enrichment by pre-treatment with WX-03-59 (20 μM, 2 h) in 22Rv1 cells. Data are from ref. and represent average values ± S.D., n = 4. c, Cysteine-directed ABPP data showing stereoselective engagement of CCNE2_C109 by WX-03-348 (20 μM, 3 h) in 22Rv1 cells. Data are from ref. and represent average values ± S.D., n = 4. d, Gel-ABPP data showing stereoselective engagement of recombinant WT-CCNE2, but not a C109-CCNE2 mutant, by WX-03-348 (bottom, representative gel-ABPP data; top, quantification of data). Purified CCNE1:CDK2 complexes (1 μM) were treated with WX-03-348 or enantiomer WX-03-346 (5 μM, 1 h) followed by conjugation to a rhodamine-azide reporter tag (Rh-N3) by copper-catalyzed azide-alkyne cycloaddition (CuAAC,) chemistry, SDS-PAGE, and in-gel fluorescence scanning. Coomassie blue signals correspond to WT- or C109A-CCNE2. Data represent average values ± s.e.m., n = 3. e, Top, crystal structure of a WT-CCNE1:CDK2 (gray: purple) complex bound to the orthosteric inhibitor dinaciclib (magenta) (PDB 5L2W), showing location of N112 of CCNE1 (green sphere) in proximity to the CDK2 binding interface. Also highlighted is the CDK2 A-loop (activation loop) (orange). Bottom, local sequence alignment for CCNE1 and CCNE2 around CCNE1_N112/CCNE2_C109 with conserved residues marked by asterisks. f, Structures of an alkyne and non-alkyne pair of stereoprobes – WX-02-520 and WX-02-308, respectively – that stereoselectively engage the N112C-CCNE1 mutant, alongside the corresponding inactive enantiomers WX-02-521 and WX-02-326. g, Gel-ABPP data showing stereoselective engagement of recombinant N112C-CCNE1, but not WT-CCNE1 by WX-02-520 (5 μM, 1 h) (bottom, representative gel-ABPP data; top, quantification of data). Purified CCNE1:CDK2 complexes were assayed as described in d. Data represent average values ± s.e.m., n = 3.
Figure 2.
Figure 2.. NanoBRET-ABPP assay for measuring stereoprobe interactions with N112C-CCNE1.
a, Left, structures of NanoBRET stereoprobe YZ-01-A and the corresponding alkyne analog WX-02-588, alongside the corresponding enantiomers YZ-01-B and WX-02-589. Right, structure of NanoBRET 590 fluorophore and linker conjugated to WX-02-588/WX-02-589 by CuAAC. b, Schematic for NanoBRET-ABPP assay to measure stereoprobe interactions with N112C-CCNE1. Created with BioRender.com. c, Gel-ABPP data showing stereoselective engagement of recombinant NLuc-N112C-CCNE1-3xFLAG, but not NLucWT-CCNE1-3xFLAG by YZ-01-A (bottom, representative gel-ABPP data; top, quantification of data). NLuc-CCNE1 proteins were co-expressed with CDK2 in HEK293T cells by transient transfection, and cell lysates treated with YZ-01-A or YZ-01-B (10 μM, 90 min), after which CCNE1 proteins were immunoprecipitated with an anti-FLAG antibody and processed for gel-ABPP. Data represent average values ± s.e.m., n = 2. d, Gel-ABPP data showing concentration-dependent, stereoselective blockade of YZ-01-A engagement of NLuc-N112C-CCNE1 by WX-02-308 compared to WX-02-326. Lysates from HEK293T cells co-transfected with NLuc-N112C-CCNE1 or NLuc-WT-CCNE1 and CDK2 were treated with WX-02-308 or WX-02-326 (0.02 – 50 μM, 2 h) followed by YZ-01-A (10 μM, 90 min), anti-FLAG immunoprecipitation, and processing for gel-ABPP. See panel f for quantification of gel-ABPP data. e, NanoBRET data showing time-dependent increase in YZ-01-A (10 μM, 2 h) reactivity with NLuc-N112C-CCNE1 vs NLuc-WT-CCNE1 or NLuc control proteins. NanoBRET-ABPP assays were performed in transfected HEK293T cell lysates. f, Comparison of gel- and NanoBRET-ABPP data showing concentration-dependent, stereoselective blockade of YZ-01-A engagement of NLuc-N112C-CCNE1 by WX-02-308 compared to WX-02-326 (0.2 – 50 μM, 2 h). Dashed horizontal line marks background signals for NanoBRET-ABPP assays performed with YZ-01-A (10 μM, 90 min) and NLuc-WT-CCNE1. CI, confident intervals. Data represent average values ± s.e.m., n = 3.
Figure 3.
Figure 3.. Characterizing allosteric inhibitors of the CCNE1:CDK2 complex.
a, Structures of two inhibitors of the CCNE1:CDK2 complex – I-125A and I-198 – reported in a patent. b, ADP-Glo data showing effects of the indicated compounds on the activity of a purified N112C-CCNE1:CDK2 complex as measured by phosphorylation of the C-terminal peptide of RB1 (left) or the histone H1 protein (right). The N112C-CCNE1:CDK2 complex was pre-treated with compounds for 2 h (37 °C) before initiating phosphorylation reactions by addition of substrate. CI, confident intervals. Data represent average values ± s.e.m., n = 3. c, Gel-ABPP data showing concentration-dependent partial blockade of YZ-01-A engagement of N112-CCNE1 by I-125A and I-198, but not dinaciclib. Assays were performed in lysates from transfected HEK293T cells co-expressing NLuc-N112C-CCNE1 or NLuc-WT-CCNE1 and CDK2 that were treated with the indicated concentration ranges of compounds followed by YZ-01-A (10 μM, 90 min), anti-FLAG immunoprecipitation, and processing for gel-ABPP. d, Quantification of gel-ABPP data shown in c. Data represent average values ± s.e.m., n = 3. e, NanoBRET-ABPP data showing concentration-dependent partial blockade of YZ-01-A engagement of N112-CCNE1 by I-125A and I-198. Samples were treated with compounds as described in c prior to NanoBRET measurement. Data represent average values ± s.e.m., n = 3. f, Quantification of gel- and NanoBRET-ABPP data showing that dinaciclib does not substantially affect YZ-01-A engagement of N112C-CCNE1. Data represent average values ± s.e.m., n = 3.
Figure 4.
Figure 4.. Crystal structure of an I-198-CCNE1:CDK2 complex.
a, Ribbon diagram structure of CCNE1:CDK2 (green: blue) complex with the I-198 compound shown in orange, the ATP-binding pocket in black (asterisk), the CDK2 activation loop (A-loop) in beige (also containing the phosphorylated T160 (pT160) residue in lime, and N112 in purple. b, Detailed view of the I-198 binding site, protein-ligand interactions, and the distance to N112 indicated by dashes. c, Protein-ligand interaction plot between CCNE1:CDK2 and I-198 (generated in Molecular Operating Environment software). CCNE1 and CDK2 residues are shown in green and blue, respectively, and water molecules are in magenta. d, I-198 binds in a cryptic pocket that is not present in the CCNE1:CDK2 apo structure (grey). The CDK2 A-loop and CCNE1 loop containing amino acids L244-P266 are reorganized to create a pocket in the I-198-bound structure. e, Overlay of apo (gray; W981QMZ) and I-198-bound (blue) CCNE1:CDK2 structures showing the position of pT160. In the apo structure, pT160 is coordinated by three arginines (R50, R126 and R150), which is a hallmark of a fully activated cyclin:CDK2 complex. I-198 induces an A-loop conformation that moves pT160 away from the arginines, creating a structure that is consistent with an inactivated kinase. f, Overlay of activated CCNA2:CDK2 with bound ATP and substrate peptide (gray and red; 1QMZ) and I-198-bound (blue) CCNE1:CDK2 structures showing the conformational change in the A-loop induced by I-198 binding that results in clashes with substrate peptide binding.
Figure 5.
Figure 5.. Functional analysis and high-throughput screening of the allosteric pocket in CCNE1:CDK2 complexes.
a, Heat map showing effects of the indicated compounds on proteins that co-immunoprecipitate with CCNE1-3xFLAG. HEK293T cells recombinantly expressing WT- or N112C-CCNE1-3xFLAG and CDK2 were treated with WX-02-308 or WX-02-326 (20 μM), I-125A (1 μM), or DMSO for 6 h, followed by cell lysis, anti-FLAG enrichment, and MS-based proteomic analysis. Shown are proteins with ≥ 3 spectral counts that were enriched ≥ 4-fold in DMSO-treated WT-CCNE1-3xFLAG cells compared to DMSO-treated mock-transfected cells. Data are normalized to CCNE1 signals within each experiment. LFC, log2 (fold change). b, Quantification of data for CKS1B and CKS2 in co-immunoprecipitation experiments performed in a. Data represent average values ± s.e.m., n = 4. Unpaired t test with Welch’s correction was used to test statistical significance. p values: 0.0026 and 0.0023 for CKS1B in WX-02-308-treated vs DMSO-treated and WX-02-326-treated N112C-CCNE1-expressing cells, respectively; 0.0054 and 0.0028 for CKS2 in WX-02-308-treated vs DMSO-treated and WX-02-326-treated N112C-CCNE1-expressing cells, respectively. c, Schematic for high-throughput screening-compatible NanoBRET-ABPP assay with an N112C-CCNE1:CDK2 complex. HEK293T cell lysate recombinantly expressing NLuc-N112C-CCNE1 and CDK2 (20 μL of cell lysates at 2 mg protein/μL) are mixed with vivazine (used at 1:100 as recommended by Promega) and YZ-01-A (10 μM), then dispensed into a 384-well plate that is pre-plated with individual compounds per well (0.05 μL of 4 mM compound stocks in DMSO; final compound concentration of 10 μM). Compound effects on the reaction between YZ-01-A with NLuc-N112C-CCNE1:CDK2 are measured by BRET with signals from a reaction with YZ-01-A and NLuc-WT-CCNE1:CDK2 serving as a background control. Created with BioRender.com. d, Time-dependent assessment of signal intensity for the NanoBRET assay performed as described in c. Arrow marks the 170-min time point chosen for HTS because, at this time point, the reaction between YZ-01-A and NLuc-N112C-CCNE1:CDK2 is still incomplete and a good Z’ score is achieved (0.85). Data are average values ± s.e.m., n = 5. e, NanoBRET-ABPP data acquired with HTS assay conditions at 175 or 185 min time points showing concentration-dependent partial blockade of YZ-01-A engagement of N112C-CCNE1 by I-125A and I-198. Data are average values ± s.e.m., n = 4. f, A pilot NanoBRET-ABPP screen performed as described in c of 324 compounds from the ChemBridge macrocycles collection (10 μM final concentration) alongside the indicated concentrations of I-125A. Dashed lines mark maximum signal (top, DMSO control with NLuc-N112C-CCNE1:CDK2 complex), 70% inhibition of signal (middle), and background signal (bottom, DMSO control with NLuc-WT-CCNE1:CDK2 complex).

Similar articles

References

    1. Ibn-Salem J. et al. Co-regulation of paralog genes in the three-dimensional chromatin architecture. Nucleic Acids Res 45, 81–91 (2017). https://doi.org:10.1093/nar/gkw813 - DOI - PMC - PubMed
    1. Man O. et al. From subgenome analysis to protein structure. Curr Opin Struct Biol 13, 353–358 (2003). https://doi.org:10.1016/s0959-440x(03)00071-x - DOI - PubMed
    1. Conant G. C. et al. Turning a hobby into a job: how duplicated genes find new functions. Nat Rev Genet 9, 938–950 (2008). http://doi.org:10.1038/nrg2482 - DOI - PubMed
    1. Ryan C. J. et al. Targeting synthetic lethal paralogs in cancer. Trends Cancer 9, 397–409 (2023). https://doi.org:10.1016/j.trecan.2023.02.002 - DOI - PubMed
    1. Xin Y. et al. Paralog-based synthetic lethality: rationales and applications. Front Oncol 13, 1168143 (2023). https://doi.org:10.3389/fonc.2023.1168143 - DOI - PMC - PubMed

Publication types