[Preprint]. 2024 Jan 16:2024.01.15.575628.
doi: 10.1101/2024.01.15.575628.

NRV: An open framework for in silico evaluation of peripheral nerve electrical stimulation strategies

Affiliations

NRV: An open framework for in silico evaluation of peripheral nerve electrical stimulation strategies

Thomas Couppey et al. bioRxiv. .

Update in

Abstract

Electrical stimulation of peripheral nerves has been used in various pathological contexts for rehabilitation purposes or to alleviate the symptoms of neuropathologies, thus improving the overall quality of life of patients. However, the development of novel therapeutic strategies is still a challenging issue requiring extensive in vivo experimental campaigns and technical development. To facilitate the design of new stimulation strategies, we provide a fully open source and self-contained software framework for the in silico evaluation of peripheral nerve electrical stimulation. Our modeling approach, developed in the popular and well-established Python language, uses an object-oriented paradigm to map the physiological and electrical context. The framework is designed to facilitate multi-scale analysis, from single fiber stimulation to whole multifascicular nerves. It also allows the simulation of complex strategies such as multiple electrode combinations and waveforms ranging from conventional biphasic pulses to more complex modulated kHz stimuli. In addition, we provide automated support for stimulation strategy optimization and handle the computational backend transparently to the user. Our framework has been extensively tested and validated with several existing results in the literature.


Figures

Fig 1.
Fig 1.. Schematic overview of NRV.
The figure shows the framework inputs (stimulus parameters, electrode and nerve geometry, and axon populations), the framework mains sections (fmod, nmod, optim, and backend) described in the Method section of this paper, and some possible result outputs of the NRV framework.
Fig 2.
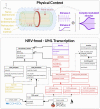
Fig 2.. Fmod section of the NRV framework.
Top: Schematic conceptualization of a PNS extracellular simulation context. The context is created around a nerve, its fascicles, and corresponding materials. Electrodes can be added as electrical interfaces, each electrode contact being associated with a simple or complex stimulus (or stimulation waveform). Bottom: NRV’s transcription of the physical with dedicated classes that can be combined and are used by the framework to evaluate the extracellular electrical fields.
Fig 3.
Fig 3.. Thin-layer approximation in NRV.
Thin-layer of thickness th and conductivity σlay, bounding two materials, internal and external, of conductivity σin and σext respectively.
Fig 4.
Fig 4.. Node section of the NRV framework.
Left: Overall view of the neuronal context of a generic PNS simulation. A nerve is an entity composed of one or multiple fascicles that do not overlap, each containing myelinated and/or unmyelinated axons. Right: NRV’s transcription of the neuronal context with dedicated classes that can be combined and used by the framework to evaluate the resulting neural activity of each axon.
Fig 5.
Fig 5.. Overview of the axon-packing algorithm inspired from [58].
The packing procedure was demonstrated with 1000 fibers. Myelinated axons are in blue and unmyelinated ones are in red. Fibers are randomly placed on a grid at initialization and migrate progressively toward the center. Each axon’s new position is calculated at each iteration according to an attraction velocity or a repulsion velocity if axons are overlapping.
Fig 6.
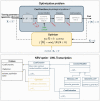
Fig 6.. Overview of optimization problem formalism and implementation in NRV.
A problem is described by combining a cost function and an optimizer or optimization method. The cost function transforms a vector to a cost by modifying any static simulation (of an axon, fascicle, or nerve) and computing a user-defined cost from the simulation result. Corresponding classes have been developed to ease the formulation of problems.
Fig 7.
Fig 7.. Electrode footprints and axon activation thresholds estimation
Footprints and activation thresholds are evaluated using the FEniCS solver (orange line) and COMSOL Multiphysics (dashed blue line) with a LIFE ((a) and (c)) and a cuff-like electrode ((b) and (d)). The relative difference in electrode footprint estimation is plotted in a red dotted line. The nerve and the fascicle are 1000μm and 800μm in diameter respectively. The fascicle is surrounded with a 5μm thick sheath of perineurium and the nerve is plunged in a 10mm large saline bath (not represented). The fascicle is made of anisotropic bulk endoneurium (σx=0.57S/m,σy=0.085S/m) and epineurium (σ=0.085S/m). Perineurium and saline conductivity are set to σ=0.002/m and σ=2S/m respectively [40].
Fig 8.
Fig 8.. Replication of an in-silico study from [15] with NRV.
(a) Block thresholds versus electrode-to-axon distance for a 7.3μm, a 10μm and a 16μm axon. Tested HFAC frequency is 4kHz and 40kHz; (b) Block thresholds versus HFAC frequency for axon diameters ranging from 7.3μm to 16μm; (c) Membrane potential (top) and gating variables (bottom) of a 10μm axon. An action potential is initiated at t = 0.5ms with an intracellular current clamp. A supra-blocking threshold HFAC is applied from t = 3ms to t = 23ms.
Fig 9.
Fig 9.. Replication of in-vivo studies from [64] and [65] with NRV.
In-silico and in-vivo data superimposed. In-silico fibers are myelinated only and modelized using the MRG model [21]. (a) Recruitment versus stimulation current with a 50μs and 20μs cathodic pulse duration; (b) recruitment versus cathodic duration with a 7μA, 8μA, and 9μA stimulus; YH 1993 refers to data from [65]; NH 1991 refers to data from [64]. All experimental data are normalized with the maximum measured force for comparison purposes.
Fig 10.
Fig 10.. Extracellular recordings simulated with NRV
Top: schematic representation of the simulation. Myelinated and unmyelinated fibers are placed in a homogeneous infinite medium (endoneurium) and activated with a current clamp. Recording electrodes are placed along the fibers and separated by 2.5mm; (a) simulated potential at each recording point. Myelinated and unmyelinated eCAP contributions are highlighted in blue and red, respectively. The stimulation artifact is highlighted in gray; (b) Maximum amplitude of myelinated eCAP (in blue) and unmyelinated eCAP (in red) versus eCAP latency.
Fig 11.
Fig 11.. Optimization problem formulation and results.
(a) Overview of the optimization problem. The simulation context consists of a monofascicular nerve and a LIFE and the stimulus parameters are modified by the context modifier after each optimization iteration (left). The simulation results are processed to derive the number of recruited fibers and the stimulus energy and then used to update the cost function (right). (b) Cost function evolution: best (solid line) and average (dotted line) cost of the swarm for a square pulse (purple), a 1- (light blue), a 2- (teal blue), and a 3- (dark blue) spline stimulus; (c) Current recording of the square pulse, 1- and 2-splines energy-optimal stimulus applied to a LIFE plunged into a saline solution using a custom arbitrary-waveform stimulator [71]. The current is recorded via a 1k shunt resistor.
Fig 12.
Fig 12.. Normalized NRV simulation execution time versus allocated CPU cores count.
A monofascicular nerve with 500 myelinated fibers (MRG model [21] is simulated during 5ms. Single CPU core execution time is used to normalize the data. The theoretical execution time is evaluated by dividing the single-core execution time by the number of allocated cores. Simulation is run on four Xeon Gold 6230R CPUs (104 CPU cores available) at 2.10Ghz with 1To of RAM running Ubuntu 22.04

Similar articles

References

    1. Reardon S. Electroceuticals spark interest. Nature. 2014;511(7507):18–18. doi:10.1038/511018a. - DOI - PubMed
    1. Rattay F. The basic mechanism for the electrical stimulation of the nervous system. Neuroscience. 1999;89(2):335–346. doi:10.1016/S0306-4522(98)00330-3. - DOI - PubMed
    1. Benabid AL. Deep brain stimulation for Parkinson’s disease. Current Opinion in Neurobiology. 2003;13(6):696–706. doi:10.1016/j.conb.2003.11.001. - DOI - PubMed
    1. Lega BC, Halpern CH, Jaggi JL, Baltuch GH. Deep brain stimulation in the treatment of refractory epilepsy: Update on current data and future directions. Neurobiology of Disease. 2010;38(3):354–360. doi:10.1016/j.nbd.2009.07.007. - DOI - PubMed
    1. Quandt F, Hummel FC. The influence of functional electrical stimulation on hand motor recovery in stroke patients: a review. Experimental & Translational Stroke Medicine. 2014;6(1):9. doi:10.1186/2040-7378-6-9. - DOI - PMC - PubMed

Publication types