[Preprint]. 2024 Jan 16:2024.01.15.575766.
doi: 10.1101/2024.01.15.575766.

Opioid-driven disruption of the septal complex reveals a role for neurotensin-expressing neurons in withdrawal

Affiliations

Opioid-driven disruption of the septal complex reveals a role for neurotensin-expressing neurons in withdrawal

Rhiana C Simon et al. bioRxiv. .

Update in

Abstract

Because opioid withdrawal is an intensely aversive experience, persons with opioid use disorder (OUD) often relapse to avoid it. The lateral septum (LS) is a forebrain structure that is important in aversion processing, and previous studies have linked the lateral septum (LS) to substance use disorders. It is unclear, however, which precise LS cell types might contribute to the maladaptive state of withdrawal. To address this, we used single-nucleus RNA-sequencing to interrogate cell type specific gene expression changes induced by chronic morphine and withdrawal. We discovered that morphine globally disrupted the transcriptional profile of LS cell types, but Neurotensin-expressing neurons (Nts; LS-Nts neurons) were selectively activated by naloxone. Using two-photon calcium imaging and ex vivo electrophysiology, we next demonstrate that LS-Nts neurons receive enhanced glutamatergic drive in morphine-dependent mice and remain hyperactivated during opioid withdrawal. Finally, we showed that activating and silencing LS-Nts neurons during opioid withdrawal regulates pain coping behaviors and sociability. Together, these results suggest that LS-Nts neurons are a key neural substrate involved in opioid withdrawal and establish the LS as a crucial regulator of adaptive behaviors, specifically pertaining to OUD.


Figures
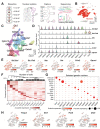
Figure 1.
Figure 1.. Single-nucleus RNA-sequencing reveals both canonical and undescribed cell populations within the septal complex.
(A) Experimental schematic. The septal complex was isolated from male and female C57BL/6J mice. Single nucleus RNA sequencing (snRNAseq) libraries were prepared from extracted septal tissue and sequenced. (B) UMAP plot illustrating individual nuclei clustered according to their transcriptional similarities. Putative neurons are highlighted in red. N = 53,188 nuclei. (C) UMAP plot of individual neurons clustered according to transcriptional similarities. n = 25,607 neurons across 14 bioinformatically-defined clusters. (D) Violin plots of the expression of established LS neuron markers. (E) Feature plots indicating the expression of typical LS neuron markers across space. (F) Heatmap of genes identified to be conserved molecular markers for each neuronal cell type. (G) Discplot illustrating the prevalence of selected candidate markers for each cell cluster. (F) Feature plots indicating the expression of selected candidate markers for Gaba7/12 (Foxp2+), Gaba4 (Esr1+), Gaba6 (Pax6+), and Gaba2 (Drd3+).
Figure 2.
Figure 2.. Chronic morphine selectively disrupts the transcriptional landscape of the septum.
(A) Experimental schematic. Both male and female C57BL/6J mice were injected with an escalating dose of morphine over the course of 7 days (Mor). Control mice were injected with saline (Sal). To model opioid withdrawal, some animals were injected with 1 mg/kg of naloxone (Nal). (B) Volcano plots indicating the enrichment of DEGs induced by morphine (left, SAL vs MOR) and by naloxone (right, MOR vs NAL) across all cell clusters. P-value cutoff is p < 0.05. DEGs identified by Wilcoxon Rank Sum Test followed by Bonferroni’s post hoc comparison correction. (C) Top 10 Gene Ontology (GO) terms (Biological process) of genes upregulated by chronic morphine. (D) Top 10 GO terms (Biological process) of genes downregulated by chronic morphine. (E) Heatmap illustrating the average logFC between Sal and Mor for different gene classes. “*” indicates significance (Wilcoxon Rank Sum Test followed by Benjamini-Hochberg post hoc comparison correction), and a positive logFC value indicates that the gene is elevated in Mor. (F) Principal component analysis of the logFC expression of DEGs between the Sal and Mor groups. (G) Heatmap of the top 100 features identified in PC1 across all cell types. (H) Top 10 GO terms (Molecular function) identified from the top 100 features.
Figure 3.
Figure 3.. Nts-expressing neurons in the septum are recruited during Naloxone-precipitated withdrawal.
(A) Feature plots of immediate early genes (IEGs) Fos, Arc and Homer1. Insets, pie charts illustrating the proportion of neurons expressing each IEG (1 copy or greater). (B) Heatmap of IEG induction by Nal across all neuronal clusters. Left panel indicates expression changes of classic IEGs, whereas the middle panel indicates IEGs that are significantly altered in any cell type. Bar graph to the right is the number of IEGs induced within each cluster. Wilcoxon rank sum test followed by Benjamini-Hochberg post-hoc correction. (C) Average logFC expression difference between Mor and Nal of all statistically significantly altered IEGs for each cell cluster. Wilcoxon rank sum test followed by Bonferroni’s post hoc correction. Red indicates statistically-significant clusters. (D) Normalized DEG enrichment scores across cell types for each condition comparison (Sal vs Mor, Sal vs Nal, and Mor vs Nal). (E) Density histogram indicating the frequency of the # of DEGs identified for Gaba7, Gaba8, and Glu2 across 100 runs. (F) The relationship between normalized Nts expression (x-axis) and Nal DEG enrichment (y-axis). Left, including Gaba8. Right, excluding Gaba8. (G) Scatterplot indicating the genes that are significantly enriched in Nts+ cells versus Nts− cells. (H) Discplot of Oprm1, Drd2, Adra1a, and Nts expression.
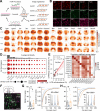
Figure 4.
Figure 4.. The septal complex possesses gradient-like laminae that may be selectively recruited during opioid withdrawal.
(A) Experimental schematic. Septal tissue from 4 male and 4 female C57BL/6J mice were stained for each candidate marker identified from snRNAseq using Hybridization Chain Reaction (HCR). (B) Representative images for each probe organized according to HCR round. Scale bar = 50 μm. (C) Spatial density plots for each gene from all animals collapsed into one dataset. Plots are organized from anterior (~+1.0 Bregma) to posterior (~+0.25 Bregma). (D) Disc plot of HCR gene expression across the AP axis of the septum. (E) Left, Correlation between the abundance of cell types identified in snRNAseq versus HCR. Cell type abundance is defined as the percent of cells expressing a given gene (Pearson correlation: R = 0.84. p = 7.7 × 10⁻⁵). Right, Correlation analysis between clusters defined by snRNAseq (y-axis) and HCR (x-axis). (F) Representative images of Nts and Fos expression in situ. Scale bar = 100 μm. G) Cells positive for Nts only. Sal vs Mor: median copies per section (p = 1); median copy difference (p = 1.05 × 10⁻¹⁰). Mor vs Nal: median copies per section (p = 0.0897), median copy difference (p = 4.28 × 10⁻⁵). (H) Nts+ and Met+ cells. Sal vs Mor: median copies per section (p = 0.551); median copy difference (p = 7.58 × 10⁻¹⁰). Mor vs Nal: median copies per section (p = 0.0181); median copy difference (p = 1.71 × 10⁻¹³). #p < 0.1, *p < 0.05, **p < 0.01, ***p < 0.001, ***p < 0.001, ****p < 0.0001.
Figure 5.
Figure 5.. Opioid withdrawal elevates LS-Nts activity in vivo.
(A) Injection scheme and experimental schematic. 4 male and 2 female Nts-cre mice were injected with AAVDJ-hSyn-DIO-GCamp6s and implanted with a 0.5 mm × 7 mm GRIN lens for two-photon imaging. (B) Left, sample mean image of GCamp6s expression in LS-Nts neurons from a representative animal. Right, sample raw fluorescence traces of 3 representative neurons. (C) Experimental timeline. Animals were habituated to head-fixation and sucrose consumption for 5–7 days. Baseline data were taken prior to the onset of either saline (Sal) or escalating morphine (Mor) injections. Opioid withdrawal was precipitated by a 1 mg/kg dose of naloxone 1 hour after the final dose of morphine. Sal animals also received naloxone. (D) LS-Nts activity evoked by air puffs and sucrose presentations in one representative animal on Day 0. Top, lick rate aligned to air puff or sucrose presentation. Bottom, peri-event time histograms (PSTHs) of neuronal responses to air puffs (left) and sucrose (right). n = 79 cells. (E) Mean naloxone-induced responses of Sal-treated (n = 33) and Mor-treated (n = 32) cells to air puffs (top) and sucrose (bottom). Sal cells received saline followed by naloxone, whereas Mor-treated cells received morphine followed by naloxone. (F) AUC measurements for air puff-evoked (Left) and sucrose-evoked (Right) responses of Sal- and Mor-treated cells before and after naloxone. Left, 2-way RM ANOVA followed by Šídák’s multiple comparisons; Sal vs Mor interaction: F(1, 63) = 22.86, p < 0.0001; Sal vs Mor pre-naloxone, p = 0.002; Mor pre- vs post-naloxone, p = 0.0005. Right, 2-way RM ANOVA followed by Šídák’s multiple comparisons; interaction: F(1, 63) = 10.47, p = 0.0019; Sal vs Mor pre-naloxone, p = 0.0867; Mor pre- vs post-naloxone, p = 0.0047. (G-I) Spontaneous activity analysis of Sal-treated (n = 39) and Mor-treated (n = 32) cells after 7 days of withdrawal (Day 14). (G) Peak frequency. 2-way RM ANOVA followed by Šídák’s multiple comparisons; interaction: F(1, 69) = 4.638, p = 0.0348; Day14 Sal vs Mor, p = 0.0697. (H) Peak amplitude. 2-way RM ANOVA followed by Šídák’s multiple comparisons; interaction: F(1, 69) = 10.51, p = 0.0018; Day14 Sal vs Mor, p = 0.0006. (I) Peak width. 2-way RM ANOVA followed by Šídák’s multiple comparisons; interaction: F(1, 69) = 17.41, p < 0.0001; Day14 Sal vs Mor, p < 0.0001. Summary data are represented as mean ± SEM. #p < 0.1, *p < 0.05, **p < 0.01, ***p < 0.001, ***p < 0.001, ****p < 0.0001.
Figure 6.
Figure 6.. Morphine treatment and withdrawal alter excitatory, but not inhibitory, synaptic strength at LS-Nts neurons.
(A) Viral schematic for labeling LS-Nts neurons and timeline of experiment. (B) Example whole-cell, voltage-clamp traces from an LS-Nts neuron. mEPSCs were measured at −70 mV (left) and mIPSCs were measured at +10 mV (right). Currents at +10 mV are abolished by gabazine (bottom). (C) Example traces of mEPSCs. (D) Cumulative probability of inter-event intervals for mEPSCs. Morphine treatment increased mEPSC frequency compared to saline-treated controls (d = 0.749, p = 0.046 for group in an LMER on frequency with group as a fixed effect and mouse and cell as random effects. Inset: median frequency of mEPSCs. Morphine, n = 18 cells, 6 mice, 4.1 Hz ± 0.7. Saline, n = 15 cells, 4 mice, 2.3 Hz ± 0.4). (E) Cumulative probability of amplitudes for mEPSCs. Morphine treatment increased mEPSC amplitude compared to controls (d = 0.866, p = 0.022 for group in an LMER on amplitude with group as a fixed effect and mouse and cell as random effects. Inset: median amplitude of mEPSCs. Morphine, n = 18 cells, 6 mice, 16.9 pA ± 0.6. Saline, n = 15 cells, 4 mice, 15.0 pA ± 0.4). (F) Example traces of mIPSCs. (G) Cumulative probability of inter-event intervals for mIPSCs. Morphine treatment did not affect mIPSC frequency compared to controls (d = 0.310, p = 0.374 for group in an LMER on frequency with group as a fixed effect and mouse and cell as random effects. Inset: median frequency of mIPSCs. Morphine, n = 22 cells, 6 mice, 3.04 Hz ± 0.5. Saline, n = 14 cells, 4 mice, 2.3 Hz ± 0.3). (H) Cumulative probability of amplitudes for mIPSCs. Morphine treatment did not affect mIPSC amplitude compared to controls (d = 0.866, p = 0.022 for group in an LMER on amplitude with group as a fixed effect and mouse and cell as random effects. Inset: median amplitude of mIPSCs. Morphine, n = 22 cells, 6 mice, 18.7 pA ± 1.5. Saline, n = 14 cells, 4 mice, 17.8 pA ± 1.0).
Figure 7.
Figure 7.. Silencing LS-Nts neurons exacerbates withdrawal-induced pain coping and triggers sexually-dimorphic alterations in sociability.
(A) Experimental schematic. Nts-Cre mice were bilaterally injected with either AAV5-EF1a-DIO-eYFP (control) or AAVDJ-EF1a-DIO-TetTox-GFP (TetTox) into the LS. TetTox was allowed to express for 8 weeks prior to baseline behavior testing, after which all mice underwent 7 days of morphine escalation and naloxone-precipitated withdrawal. (B) Representative image of TetTox-GFP expression in the LSi of a Nts-Cre mouse. Scale bar = 200 μm (C) Naloxone-induced withdrawal signs. Left, number of jumps. Unpaired t-test: t(24) = 1.033, p = 0.3118. Right, number of fecal boli. Unpaired t-test: t(24) = 0.4698, p = 0.6427. (D) Hot plate. Left, latency to performing a coping action (hind paw lick or jump). 2-way RM ANOVA followed by Šídák’s multiple comparisons; group effect: F(1,24) = 6.720, p = 0.0160; control vs. TetTox at 1d, p = 0.0069. Right, TetTox increases the number of jumps mice perform at 1 day of withdrawal. Unpaired t-test: t(11) = 2.257, p = 0.0453. (E) Open field mobility. 2-way RM ANOVA followed by Šídák’s multiple comparisons; group effect: F(1, 24) = 13.98, p = 0.0010; control vs. TetTox at 1 week, p < 0.0026. (F) 3-chamber social preference. 2-way RM ANOVA followed by Šídák’s multiple comparisons; interaction: F(2,48) = 5.197, p = 0.0091; control vs. TetTox at 2 weeks, p = 0.0298. (G) Resident intruder assay. Left, nose-to-nose interactions. 2-way RM ANOVA followed by Šídák’s multiple comparisons; interaction: F(1, 22) = 8.433, p = 0.0082; control males vs TetTox males, p = 0.0144. (H) Experimental schematic for optogenetic activation of LS-Nts neurons. Male Nts-Cre mice were bilaterally injected with either AAV5-ef1a-DIO-eYFP (control) or AAV5-ef1a-DIO-hChr2-eYFP (stim), and bilateral optical fibers were implanted above the LS. (I) Left, mice underwent the resident intruder task, composed of 2 min long light off and light on epochs, during which 5–7 mW 470 mm laser light was delivered at 20 Hz, 5 ms pulse length. Right, representative optical fiber placement. Scale bar = 400 μm (J) Drug-naïve, no interaction: F(2,20) = 0.6640, p = 0.5258. 1 week withdrawal, interaction: F(2,20) = 5.428, p = 0.0131; eYFP vs. Chr2 during on epoch, p = 0.0039. 2-way RM ANOVA followed by Šídák’s multiple comparisons. (K) Cumulative time of nose-to-nose interactions. 2-way RM ANOVA followed by Šídák’s multiple comparisons; interaction: F(1,10) = 7.005, p = 0.0244; eYFP vs Chr2, p = 0.0148). All data are represented as mean ± SEM. #p < 0.1, *p < 0.05, **p < 0.01, ***p < 0.001, ***p < 0.001, ****p < 0.0001.

References

    1. Koob G. Drug Addiction, Dysregulation of Reward, and Allostasis. Neuropsychopharmacology 24, 97–129 (2001). - PubMed
    1. George O. & Koob G. F. Individual differences in the neuropsychopathology of addiction. Dialogues Clin. Neurosci. 19, 217–229 (2017). - PMC - PubMed
    1. Welsch L., Bailly J., Darcq E. & Kieffer B. L. The Negative Affect of Protracted Opioid Abstinence: Progress and Perspectives From Rodent Models. Biol. Psychiatry 87, 54–63 (2020). - PMC - PubMed
    1. Olds J. & Milner P. Positive reinforcement produced by electrical stimulation of septal area and other regions of rat brain. J. Comp. Physiol. Psychol. 47, 419–427 (1954). - PubMed
    1. Wong L. C. et al. Effective Modulation of Male Aggression through Lateral Septum to Medial Hypothalamus Projection. Curr. Biol. 26, 593–604 (2016). - PMC - PubMed

Publication types