

Cancer mortality in childhood and adolescence: analysis of trends and spatial distribution in the 133 intermediate Brazilian regions grouped by macroregions
- PMID: 38294061
- PMCID: PMC10824501
- DOI: 10.1590/1980-549720240003
Cancer mortality in childhood and adolescence: analysis of trends and spatial distribution in the 133 intermediate Brazilian regions grouped by macroregions
Abstract
Objective: To assess the magnitude, trend, and spatial patterns of childhood and adolescent cancer mortality between 1996 and 2017 in 133 Brazilian intermediate regions by using socioeconomic and healthcare services indicators.
Methods: This is an ecological study for analyzing the trend of mortality from cancer in childhood and adolescence through time series. Data on deaths were extracted from the Brazilian Mortality Information System. Data on population were extracted from the 1991, 2000, and 2010 demographic censuses of the Brazilian Institute of Geography and Statistics, with interpolation for intercensal years. Time series were delineated for mortality by type of cancer in each intermediate region. Such regions were grouped by macroregions to present the results. The calculation and interpretation of mortality trends use the Prais-Winsten autoregression procedure.
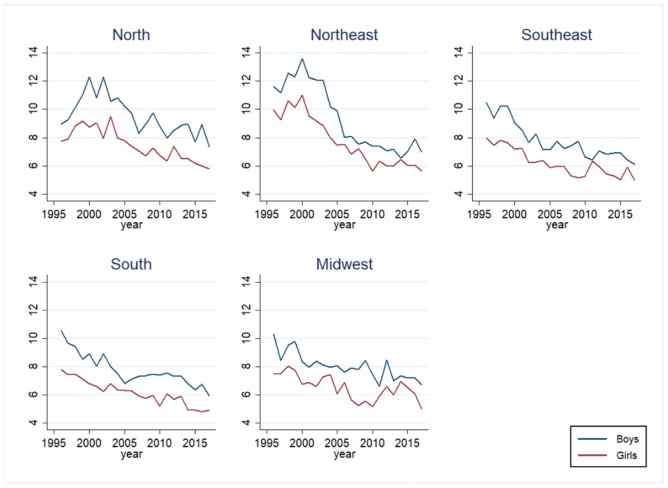
Results: Mortality rates for all neoplasms were higher in the Northern region (7.79 deaths per 100 thousand population), while for leukemias, they were higher in the Southern region (1.61 deaths per 100 thousand population). In both regions, mortality was higher in boys and in the 0-4 age group. The trend was decreasing (annual percent change [APC] - -2.11 [95%CI: -3.14; - 1.30]) for all neoplasms in the Brazilian regions and stationary (APC - -0.43 [95%CI: -1.61; 2.12]) for leukemias in the analyzed period.
Conclusion: The mortality rate for all neoplasms showed higher values in regions with smaller numbers of ICU beds in the public healthcare system.
Objetivo:: Avaliar magnitude, tendência e padrões espaciais da mortalidade por câncer na infância e adolescência, entre 1996 e 2017, nas 133 regiões intermediárias brasileiras, utilizando indicadores socioeconômicos e de serviços de saúde.
Métodos:: É um estudo ecológico que analisa a tendência da mortalidade por câncer na infância e adolescência por meio de séries temporais. Os dados sobre óbitos foram extraídos do Sistema de Informações sobre Mortalidade. Os dados referentes à população foram extraídos dos censos demográficos de 1991, 2000 e 2010 do Instituto Brasileiro de Geografia e Estatística, com interpolação para os anos intercensitários. Foram delineadas séries temporais para a mortalidade por tipo de câncer em cada região intermediária. Tais regiões foram agrupadas por macrorregiões para a apresentação dos resultados. O cálculo e interpretação das tendências de mortalidade utilizaram o procedimento de autorregressão de Prais-Winsten.
Resultados:: As taxas de mortalidade para todas as neoplasias foram maiores na Região Norte (7,79 óbitos por 100 mil habitantes), enquanto para as leucemias foram maiores na Região Sul (1,61 óbitos por 100 mil habitantes). Em ambas a mortalidade foi maior no sexo masculino e na faixa etária de zero a quatro anos. A tendência mostrou-se decrescente (annual percent change — APC -2,11 [intervalo de confiança — IC95% -3,14; -1,30]) para todas as neoplasias nas regiões brasileiras e estacionária (APC -0.43 [IC95%: -1.61; 2.12]) para as leucemias, no período analisado.
Conclusão:: A taxa de mortalidade, para todas as neoplasias, apresentou valores mais elevados nas regiões que dispõem de menores números de leito de Unidade de Terapia Intensiva do Sistema Único de Saúde.
Conflict of interest statement
Figures
References
-
- Brasil. Ministério da Saúde. Incidência, mortalidade e morbidade hospitalar por câncer em crianças, adolescentes e adultos jovens no Brasil: informações dos registros de câncer e do sistema de mortalidade. Rio de Janeiro: INCA; 2016. Instituto Nacional do Câncer José de Alencar Gomes da Silva.
MeSH terms
LinkOut - more resources
Full Text Sources
Medical
