

Illegal dumping of oil and gas wastewater alters arid soil microbial communities
- PMID: 38294246
- PMCID: PMC10880632
- DOI: 10.1128/aem.01490-23
Illegal dumping of oil and gas wastewater alters arid soil microbial communities
Abstract
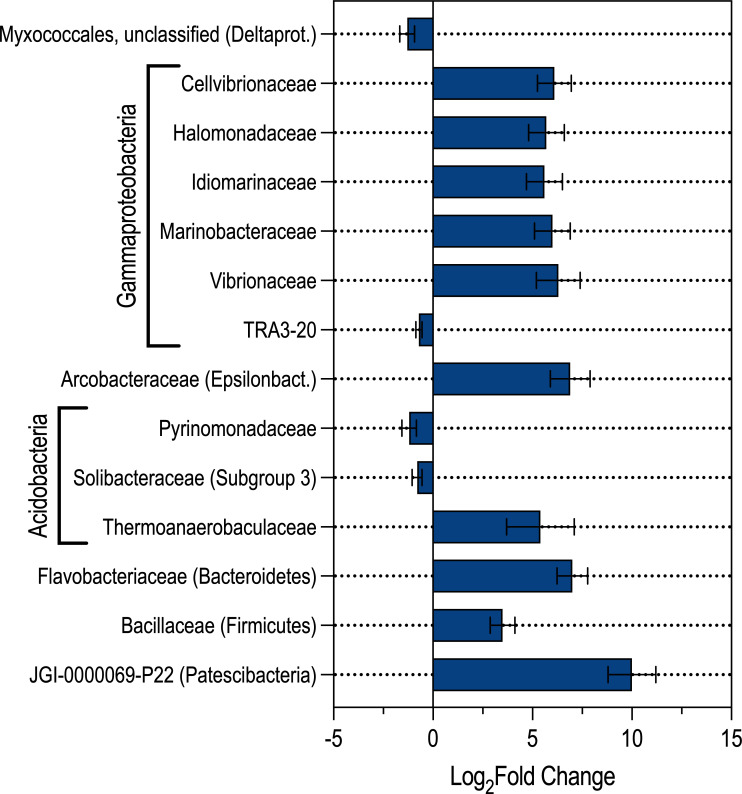
The Permian Basin, underlying southeast New Mexico and west Texas, is one of the most productive oil and gas (OG) provinces in the United States. Oil and gas production yields large volumes of wastewater with complex chemistries, and the environmental health risks posed by these OG wastewaters on sensitive desert ecosystems are poorly understood. Starting in November 2017, 39 illegal dumps, as defined by federal and state regulations, of OG wastewater were identified in southeastern New Mexico, releasing ~600,000 L of fluid onto dryland soils. To evaluate the impacts of these releases, we analyzed changes in soil geochemistry and microbial community composition by comparing soils from within OG wastewater dump-affected samples to unaffected zones. We observed significant changes in soil geochemistry for all dump-affected compared with control samples, reflecting the residual salts and hydrocarbons from the OG-wastewater release (e.g., enriched in sodium, chloride, and bromide). Microbial community structure significantly (P < 0.01) differed between dump and control zones, with soils from dump areas having significantly (P < 0.01) lower alpha diversity and differences in phylogenetic composition. Dump-affected soil samples showed an increase in halophilic and halotolerant taxa, including members of the Marinobacteraceae, Halomonadaceae, and Halobacteroidaceae, suggesting that the high salinity of the dumped OG wastewater was exerting a strong selective pressure on microbial community structure. Taxa with high similarity to known hydrocarbon-degrading organisms were also detected in the dump-affected soil samples. Overall, this study demonstrates the potential for OG wastewater exposure to change the geochemistry and microbial community dynamics of arid soils.IMPORTANCEThe long-term environmental health impacts resulting from releases of oil and gas (OG) wastewater, typically brines with varying compositions of ions, hydrocarbons, and other constituents, are understudied. This is especially true for sensitive desert ecosystems, where soil microbes are key primary producers and drivers of nutrient cycling. We found that releases of OG wastewater can lead to shifts in microbial community composition and function toward salt- and hydrocarbon-tolerant taxa that are not typically found in desert soils, thus altering the impacted dryland soil ecosystem. Loss of key microbial taxa, such as those that catalyze organic carbon cycling, increase arid soil fertility, promote plant health, and affect soil moisture retention, could result in cascading effects across the sensitive desert ecosystem. By characterizing environmental changes due to releases of OG wastewater to soils overlying the Permian Basin, we gain further insights into how OG wastewater may alter dryland soil microbial functions and ecosystems.
Keywords: contaminants; dryland soils; microbial communities; microbial ecology; oil and gas; produced water; soil microbiology; wastewater.
Conflict of interest statement
The authors declare no conflict of interest.
Figures


Similar articles
-
The influence of soil salinization, induced by the backwater effect of the Yellow River, on microbial community dynamics and ecosystem functioning in arid regions.Environ Res. 2024 Dec 1;262(Pt 1):119854. doi: 10.1016/j.envres.2024.119854. Epub 2024 Aug 27. Environ Res. 2024. PMID: 39197488
-
Impacts of altered precipitation regimes on soil communities and biogeochemistry in arid and semi-arid ecosystems.Glob Chang Biol. 2015 Apr;21(4):1407-21. doi: 10.1111/gcb.12789. Epub 2014 Dec 5. Glob Chang Biol. 2015. PMID: 25363193 Review.
-
Effects of oilfield-produced water discharge on the spatial patterns of microbial communities in arid soils.Sci Total Environ. 2024 Mar 15;916:170333. doi: 10.1016/j.scitotenv.2024.170333. Epub 2024 Jan 24. Sci Total Environ. 2024. PMID: 38278269
-
Significant Impacts of Increasing Aridity on the Arid Soil Microbiome.mSystems. 2017 May 30;2(3):e00195-16. doi: 10.1128/mSystems.00195-16. eCollection 2017 May-Jun. mSystems. 2017. PMID: 28593197 Free PMC article.
-
Water pulses and biogeochemical cycles in arid and semiarid ecosystems.Oecologia. 2004 Oct;141(2):221-35. doi: 10.1007/s00442-004-1519-1. Epub 2004 Feb 24. Oecologia. 2004. PMID: 14986096 Review.
Cited by
-
Nitrate-reducing microorganisms prevent souring of an oil field produced water storage pond.FEMS Microbiol Ecol. 2025 Apr 14;101(5):fiaf041. doi: 10.1093/femsec/fiaf041. FEMS Microbiol Ecol. 2025. PMID: 40295121 Free PMC article.
-
Pathways for Potential Exposure to Onshore Oil and Gas Wastewater: What We Need to Know to Protect Human Health.Geohealth. 2025 Apr 3;9(4):e2024GH001263. doi: 10.1029/2024GH001263. eCollection 2025 Apr. Geohealth. 2025. PMID: 40182626 Free PMC article. Review.
References
-
- U.S. EIA. 2021. Drilling and completion improvements support Permian Basin hydrocarbon production, on U.S Energy Information Administration. Available from: https://www.eia.gov/todayinenergy/detail.php?id=50016. Retrieved 12 Jan 2021.
-
- Gaswirth SB, French KL, Pitman JK, Marra KR, Mercier TJ, Leathers-Miller HM, Schenk CJ, Tennyson ME, Woodall CA, Brownfield ME, Finn TM, Le PA. 2018. Assessment of undiscovered continuous oil and gas resources in the Wolfcamp Shale and Bone Spring Formation of the Delaware Basin, Permian Basin Province, New Mexico and Texas, 2018. U.S. Geological Survey, Reston, VA: . doi:10.3133/fs20183073 - DOI
-
- U.S. EIA. 2022. Advances in technology led to record new well productivity in the Permian Basin in 2021, on U.S Energy Information Administration. Available from: https://www.eia.gov/todayinenergy/detail.php?id=54079#tab1. Retrieved 3 Oct 2023.
-
- U.S. EIA. 2023. Drilling Productivity Report: Permian Basin. U.S. Energy Information Administration Washington, DC. Available from: https://www.eia.gov/petroleum/drilling/
-
- Houston NA, Ball GP, Galanter AE, Valder JF, McShane RR, Thamke JN, McDowell JS. 2021. Estimates of water use associated with continuous oil and gas development in the Permian Basin, Texas and New Mexico, 2010–19, with comparisons to the Williston Basin, North Dakota and Montana. US Geological Survey. doi:10.3133/fs20213053 - DOI
MeSH terms
Substances
Grants and funding
LinkOut - more resources
Full Text Sources
Miscellaneous
