

Differential interferon responses to influenza A and B viruses in primary ferret respiratory epithelial cells
- PMID: 38294251
- PMCID: PMC10878268
- DOI: 10.1128/jvi.01494-23
Differential interferon responses to influenza A and B viruses in primary ferret respiratory epithelial cells
Abstract
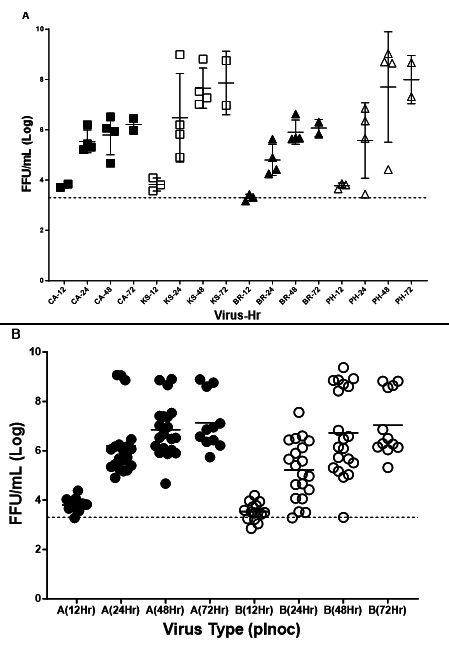
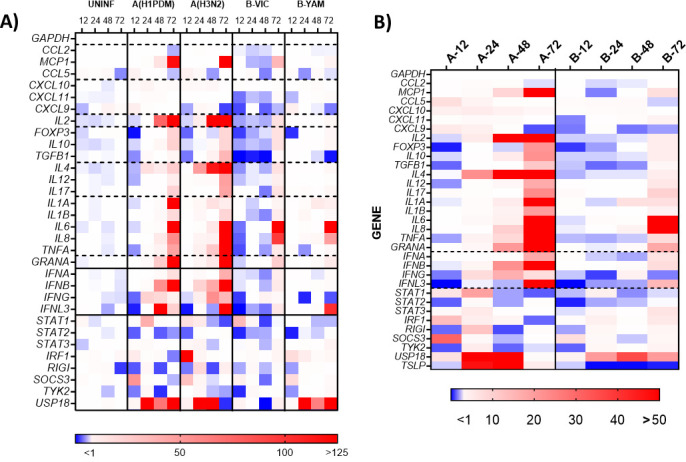
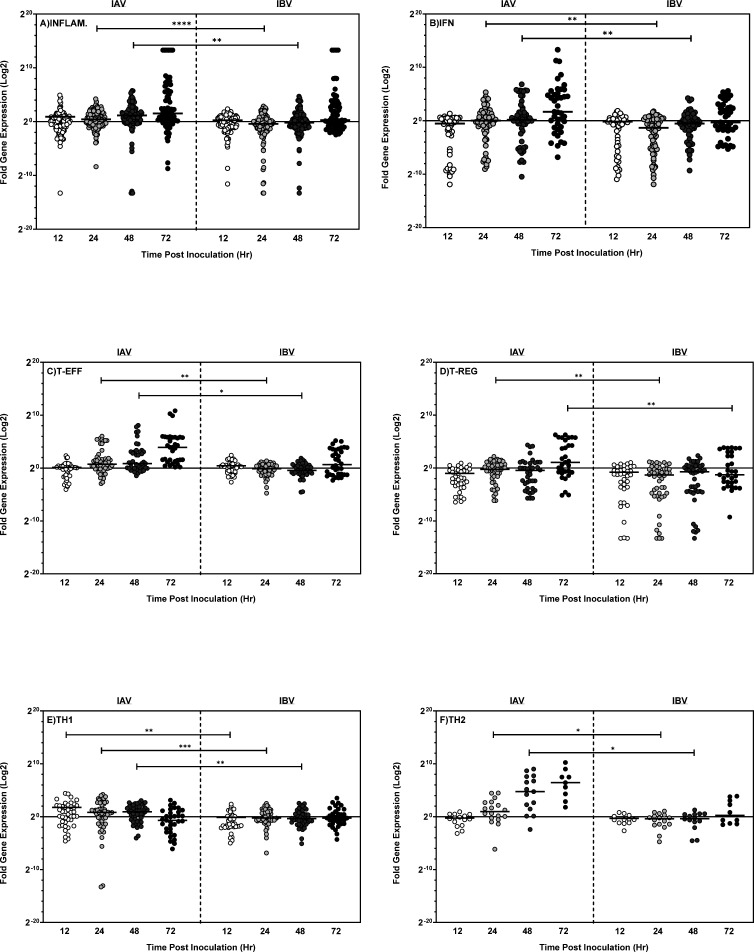
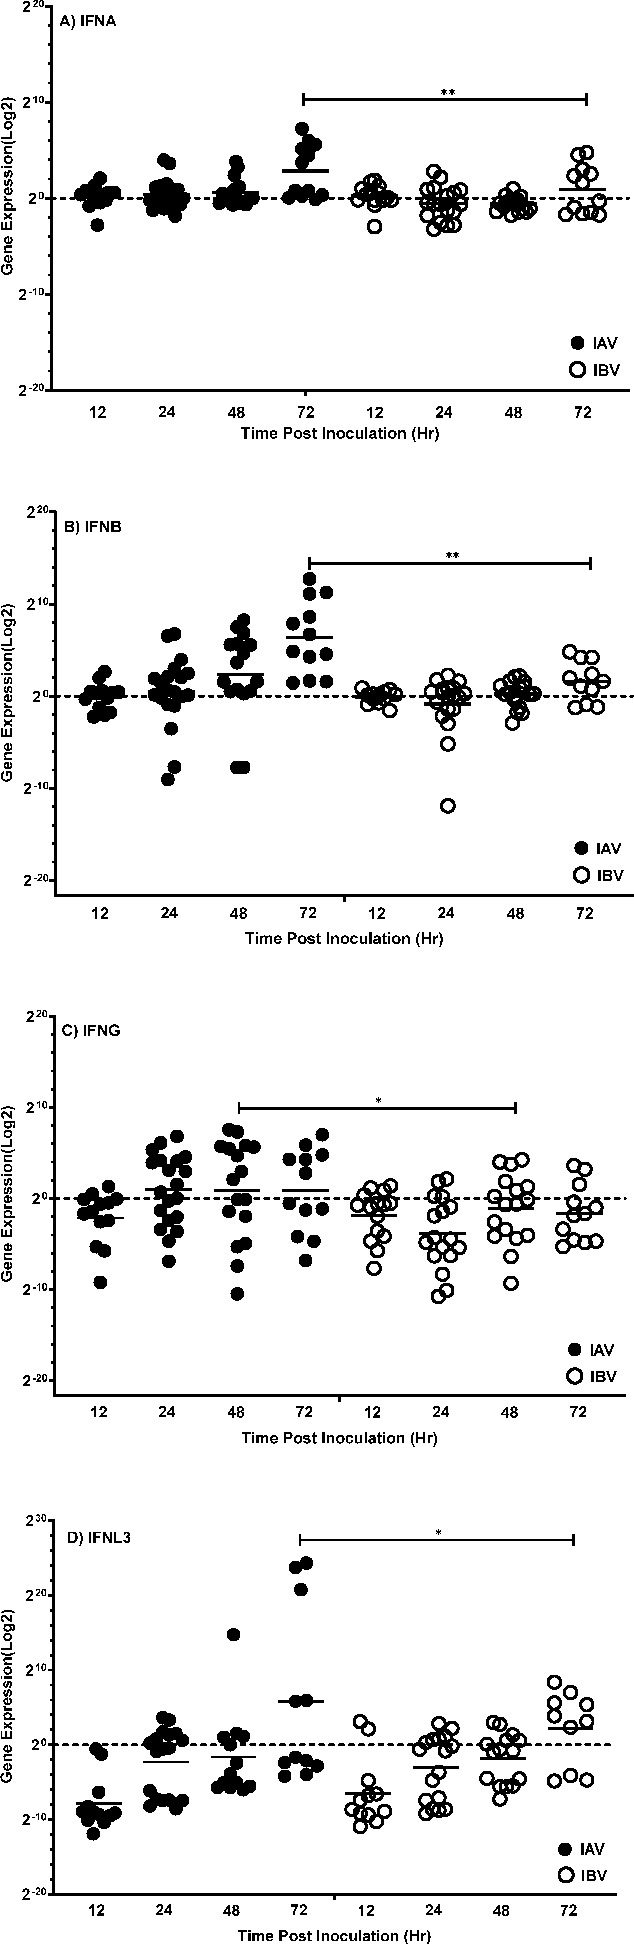
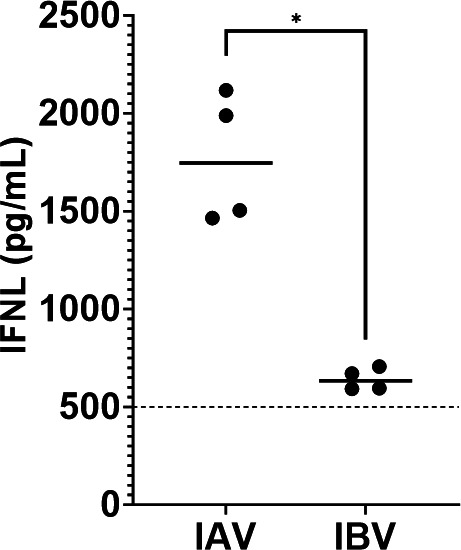
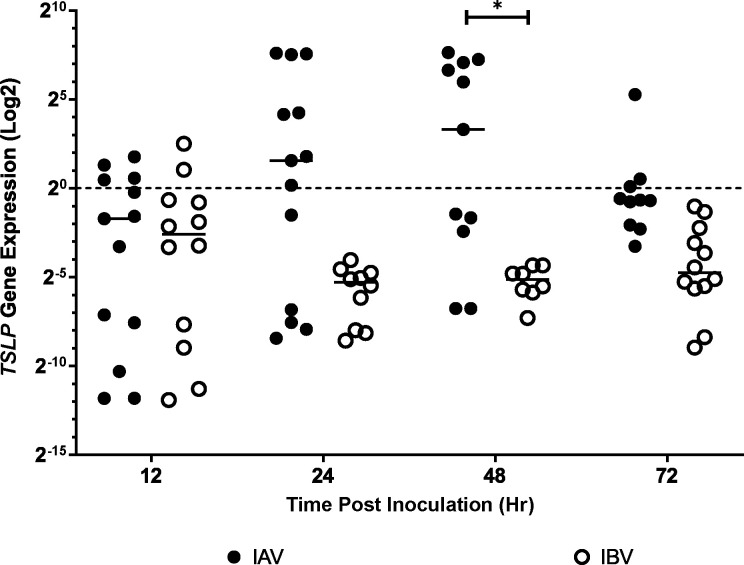
Influenza B viruses (IBV) cocirculate with influenza A viruses (IAV) and cause periodic epidemics of disease, yet antibody and cellular responses following IBV infection are less well understood. Using the ferret model for antisera generation for influenza surveillance purposes, IAV resulted in robust antibody responses following infection, whereas IBV required an additional booster dose, over 85% of the time, to generate equivalent antibody titers. In this study, we utilized primary differentiated ferret nasal epithelial cells (FNECs) which were inoculated with IAV and IBV to study differences in innate immune responses which may result in differences in adaptive immune responses in the host. FNECs were inoculated with IAV (H1N1pdm09 and H3N2 subtypes) or IBV (B/Victoria and B/Yamagata lineages) and assessed for 72 h. Cells were analyzed for gene expression by quantitative real-time PCR, and apical and basolateral supernatants were assessed for virus kinetics and interferon (IFN), respectively. Similar virus kinetics were observed with IAV and IBV in FNECs. A comparison of gene expression and protein secretion profiles demonstrated that IBV-inoculated FNEC expressed delayed type-I/II IFN responses and reduced type-III IFN secretion compared to IAV-inoculated cells. Concurrently, gene expression of Thymic Stromal Lymphopoietin (TSLP), a type-III IFN-induced gene that enhances adaptive immune responses, was significantly downregulated in IBV-inoculated FNECs. Significant differences in other proinflammatory and adaptive genes were suppressed and delayed following IBV inoculation. Following IBV infection, ex vivo cell cultures derived from the ferret upper respiratory tract exhibited reduced and delayed innate responses which may contribute to reduced antibody responses in vivo.IMPORTANCEInfluenza B viruses (IBV) represent nearly one-quarter of all human influenza cases and are responsible for significant clinical and socioeconomic impacts but do not pose the same pandemic risks as influenza A viruses (IAV) and have thus received much less attention. IBV accounts for greater severity and deaths in children, and vaccine efficacy remains low. The ferret can be readily infected with human clinical isolates and demonstrates a similar course of disease and immune responses. IBV, however, generates lower antibodies in ferrets than IAV following the challenge. To determine whether differences in initial innate responses following infection may affect the development of robust adaptive immune responses, ferret respiratory tract cells were isolated, infected with IAV/IBV, and compared. Understanding the differences in the initial innate immune responses to IAV and IBV may be important in the development of more effective vaccines and interventions to generate more robust protective immune responses.
Keywords: TSLP; ferret; focus-forming assay; influenza B; innate; interferon; respiratory tract.
Conflict of interest statement
The authors declare no conflict of interest.
Figures
Similar articles
-
Delay of innate immune responses following influenza B virus infection affects the development of a robust antibody response in ferrets.mBio. 2025 Feb 5;16(2):e0236124. doi: 10.1128/mbio.02361-24. Epub 2025 Jan 8. mBio. 2025. PMID: 39772665 Free PMC article.
-
Differential Modulation of Innate Immune Responses in Human Primary Cells by Influenza A Viruses Carrying Human or Avian Nonstructural Protein 1.J Virol. 2019 Dec 12;94(1):e00999-19. doi: 10.1128/JVI.00999-19. Print 2019 Dec 12. J Virol. 2019. PMID: 31597767 Free PMC article.
-
Hemagglutinin Cleavability, Acid Stability, and Temperature Dependence Optimize Influenza B Virus for Replication in Human Airways.J Virol. 2019 Dec 12;94(1):e01430-19. doi: 10.1128/JVI.01430-19. Print 2019 Dec 12. J Virol. 2019. PMID: 31597759 Free PMC article.
-
Innate and adaptive immunity toward influenza B viruses.Future Microbiol. 2020 Jul;15:1045-1058. doi: 10.2217/fmb-2019-0340. Epub 2020 Aug 19. Future Microbiol. 2020. PMID: 32811172 Review.
-
Modulation of Innate Immune Responses by the Influenza A NS1 and PA-X Proteins.Viruses. 2018 Dec 12;10(12):708. doi: 10.3390/v10120708. Viruses. 2018. PMID: 30545063 Free PMC article. Review.
Cited by
-
Advances in protein subunit vaccines against H1N1/09 influenza.Front Immunol. 2024 Nov 22;15:1499754. doi: 10.3389/fimmu.2024.1499754. eCollection 2024. Front Immunol. 2024. PMID: 39650643 Free PMC article. Review.
-
Emergence of an Antigenically Drifted and Reassorted Influenza B Virus at the end of the 2024-25 Influenza Season.bioRxiv [Preprint]. 2025 Jul 24:2025.07.24.666632. doi: 10.1101/2025.07.24.666632. bioRxiv. 2025. PMID: 40777387 Free PMC article. Preprint.
-
Interferon as an immunoadjuvant to enhance antibodies following influenza B infection and vaccination in ferrets.NPJ Vaccines. 2024 Oct 24;9(1):199. doi: 10.1038/s41541-024-00973-2. NPJ Vaccines. 2024. PMID: 39448628 Free PMC article.
-
Antiviral activity of bovine type III interferon against bovine viral diarrhea virus is greatly reduced in bovine turbinate cells due to limited expression of IFN lambda receptor 1 (IL-28Rα).Front Immunol. 2024 Aug 19;15:1441908. doi: 10.3389/fimmu.2024.1441908. eCollection 2024. Front Immunol. 2024. PMID: 39224597 Free PMC article.
-
Delay of innate immune responses following influenza B virus infection affects the development of a robust antibody response in ferrets.mBio. 2025 Feb 5;16(2):e0236124. doi: 10.1128/mbio.02361-24. Epub 2025 Jan 8. mBio. 2025. PMID: 39772665 Free PMC article.
References
-
- Mosnier A, Caini S, Daviaud I, Bensoussan J-L, Stoll-Keller F, Bui TT, Lina B, Van der Werf S, Cohen JM, GROG network . 2015. Ten influenza seasons in France: distribution and timing of influenza A and B circulation, 2003-2013. BMC Infect Dis 15:357. doi:10.1186/s12879-015-1056-z - DOI - PMC - PubMed
-
- Petrie JG, Malosh RE, Cheng CK, Ohmit SE, Martin ET, Johnson E, Truscon R, Eichelberger MC, Gubareva LV, Fry AM, Monto AS. 2017. The household influenza vaccine effectiveness study: lack of antibody response and protection following receipt of 2014-2015 influenza vaccine. Clin Infect Dis 65:1644–1651. doi:10.1093/cid/cix608 - DOI - PMC - PubMed
Publication types
MeSH terms
Substances
Grants and funding
LinkOut - more resources
Full Text Sources
