. 2024 Sep;476(9):1399-1410.
doi: 10.1007/s00424-024-02911-6. Epub 2024 Jan 31.

Cargo-specific effects of hypoxia on clathrin-mediated trafficking

Affiliations

Cargo-specific effects of hypoxia on clathrin-mediated trafficking

Gijsbert J van Belle et al. Pflugers Arch. 2024 Sep.

Abstract

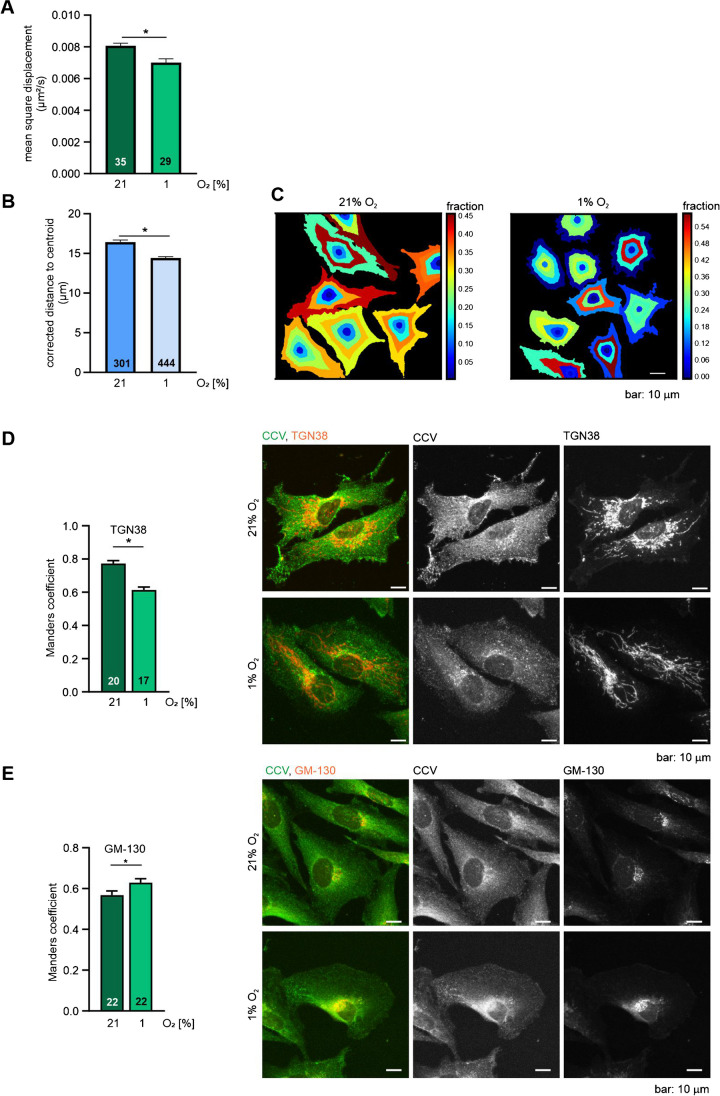
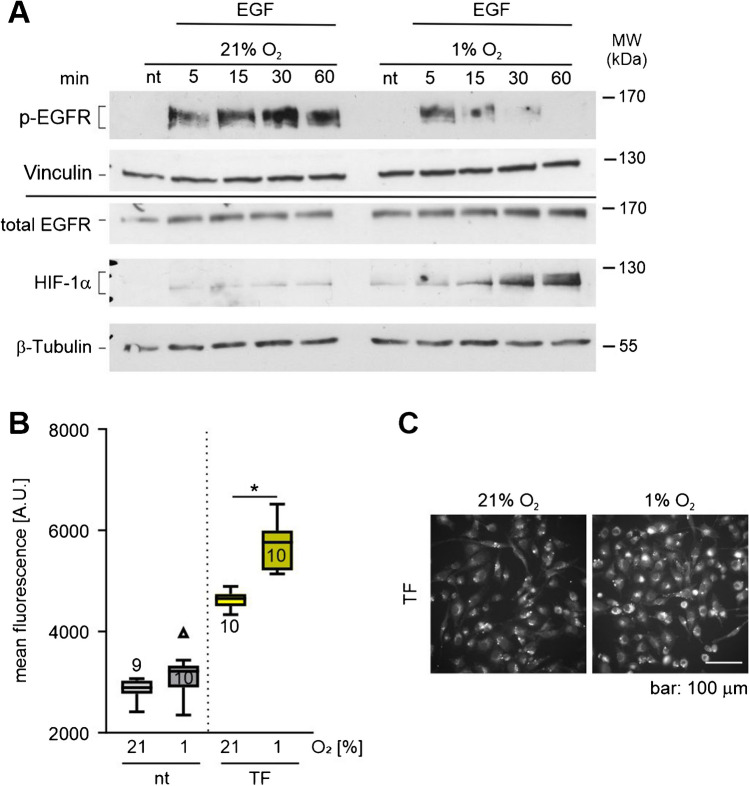
Clathrin-associated trafficking is a major mechanism for intracellular communication, as well as for cells to communicate with the extracellular environment. A decreased oxygen availability termed hypoxia has been described to influence this mechanism in the past. Mostly biochemical studies were applied in these analyses, which miss spatiotemporal information. We have applied live cell microscopy and a newly developed analysis script in combination with a GFP-tagged clathrin-expressing cell line to obtain insight into the dynamics of the effect of hypoxia. Number, mobility and directionality of clathrin-coated vesicles were analysed in non-stimulated cells as well as after stimulation with epidermal growth factor (EGF) or transferrin in normoxic and hypoxic conditions. These data reveal cargo-specific effects, which would not be observable with biochemical methods or with fixed cells and add to the understanding of cell physiology in hypoxia. The stimulus-dependent consequences were also reflected in the final cellular output, i.e. decreased EGF signaling and in contrast increased iron uptake in hypoxia.

Keywords: Clathrin; Endocytosis; Hypoxia; Live cell microscopy.


Conflict of interest statement

The authors declare no competing interests.

Figures

Fig. 1
Fig. 1
The number of clathrin-coated vesicles/particles is reduced in hypoxia. A MDA-MB-231 cells were subjected to either 6 h of normoxia (21% O2) or hypoxia (1% O2) before fixation, electron microscopy and subsequent quantification of clathrin-coated vesicles/particles. In total, 103 and 89 cells incubated in normoxia or hypoxia were included in the analysis. B Representative EM micrographs of the experiment analysed in A. C MDA-MB-231 cells were subjected to 6 h of normoxia (21% O2) or hypoxia (1% O2) before fixation, immunofluorescence staining for clathrin and subsequent quantification. In total, 301 and 444 cells incubated in normoxia or hypoxia were included in the analysis. D Representative immunofluorescence micrographs of the experiment analysed in C. Mean ± SEM, unpaired t-test with Welch’s correction, *p < 0.05
Fig. 2
Fig. 2
Analysis of GFP-tagged clathrin reporter MDA-MB-231 cells confirm a reduced number of clathrin-coated vesicles in hypoxia. A Representative micrograph of a fixed MDA-MB-231 cell stably expressing GFP-clathrin after incubation in normoxia (21% O2) or hypoxia (1% O2) for 6 h. B MDA-MB-231 wild type (wt) and GFP-CLTC expressing MDA-MB-231 (GFP-CLTC) cells were analysed for clathrin and GFP protein levels by immunoblotting. Vinculin was used as a loading control. C Immunofluorescence staining of fixed MDA-MB-231 cells stably expressing GFP-clathrin with an anti-clathrin heavy chain (CHC) antibody. D Representative images with plotted accumulated tracks of MDA-MB-231 GFP-CTLC cells which were incubated for either 6 h in normoxia (21% O2) or hypoxia (1% O2). The image sequences were analysed using the SOS plugin for ImageJ, and tracks were generated. Area in the red box is enlarged as an example. E Quantification of number of tracks in MDA-MB-231 GFP-CLTC from the images obtained in D. 35 and 29 cells were analysed in normoxia and hypoxia. F HIF-1α immunoblot in MDA-MB-231 wt and GFP-CLTL cells after incubating the cells in normoxia or hypoxia for 6 h. β-actin was used as a loading control. Mean ± SEM, unpaired t-test with Welch’s correction, *p < 0.05
Fig. 3
Fig. 3
Hypoxia alters the mobility and cellular localization of intracellular vesicles. Quantification of mean square displacement (A) and corrected distance to centroid (B) of GFP-tagged vesicles measured in MDA-MB-231 GFP-CLTC cells which were imaged either in normoxia (21% O2) or hypoxia (1% O2) for 6 h. C Exemplary pseudo-coloured images showing the fraction at distance of MD-MB-231 GFP CLTC cells obtained from the experiment performed in B. D, E Quantification of the Manders overlap coefficient measured in fixed MDA-MB-231 cells which were subjected to either normoxia or hypoxia for 6 h followed by immunofluorescence co-staining for CTLC and TGN38 (D) or GM-130 (E). Representative stainings are shown on the right side. Numbers in the bars indicate the number of the cells analysed per condition. Mean ± SEM, unpaired t-test with Welch’s correction, *p < 0.05
Fig. 4
Fig. 4
The effects of hypoxia on clathrin-coated vesicles (CCVs) are cargo specific. MDA-MB-231 GFP-CLTC cells were subjected to normoxia (21% O2) or hypoxia (1% O2) for 80 min. Cells were stimulated with EGF or transferrin (TF). CCVs and cargo were imaged in their respective fluorescent channel and tracks were generated accordingly. Tracks were quantified regarding number (A), mean square displacement (B), asymmetry coefficient (C) and track length (D). Numbers in the bars indicate the number of cells analysed. Mean ± SEM, unpaired t-test with Welch’s correction, *p < 0.05
Fig. 5
Fig. 5
Hypoxia affects the final cellular output differently after EGF and transferrin (TF) stimulation. A Immunoblots showing total HIF-1α, EGFR and phosho-EGFR protein level in normoxia (21% O2) and hypoxia (1% O2) for the indicated time points in MDA-MB-231 cells after stimulation with EGF. Vinculin and β-tubulin served as loading controls. B Quantification of intracellular Fe2+ in MDA-MB-231 cells using FerroOrange after stimulation with TF in normoxia or hypoxia for 80 min. Numbers in the bars indicate number of image sections analysed; box and whisker plot shows median and range of values. C Representative micrographs from the experiment in B. Unpaired t-test with Welch’s correction, *p < 0.05

Similar articles

Cited by

  • How do cells sense oxygen?
    Fandrey J. Fandrey J. Pflugers Arch. 2024 Sep;476(9):1303-1305. doi: 10.1007/s00424-024-03000-4. Epub 2024 Aug 5. Pflugers Arch. 2024. PMID: 39101995 Free PMC article. No abstract available.

References

    1. Aguet F, Antonescu CN, Mettlen M, Schmid SL, Danuser G (2013) Advances in analysis of low signal-to-noise images link dynamin and AP2 to the functions of an endocytic checkpoint. Dev Cell 26:279–291. 10.1016/j.devcel.2013.06.019 10.1016/j.devcel.2013.06.019 - DOI - PMC - PubMed
    1. Baker M (2010) Cellular imaging: taking a long, hard look. Nature 466:1137–1140. 10.1038/4661137a 10.1038/4661137a - DOI - PubMed
    1. Bhave M, Mino RE, Wang X, Lee J, Grossman HM, Lakoduk AM, Danuser G, Schmid SL, Mettlen M (2020) Functional characterization of 67 endocytic accessory proteins using multiparametric quantitative analysis of CCP dynamics. Proc Natl Acad Sci U S A 117:31591–31602. 10.1073/pnas.2020346117 10.1073/pnas.2020346117 - DOI - PMC - PubMed
    1. Bourseau-Guilmain E, Menard JA, Lindqvist E, Indira Chandran V, Christianson HC, Cerezo Magana M, Lidfeldt J, Marko-Varga G, Welinder C, Belting M (2016) Hypoxia regulates global membrane protein endocytosis through caveolin-1 in cancer cells. Nat Commun 7:11371. 10.1038/ncomms11371 10.1038/ncomms11371 - DOI - PMC - PubMed
    1. Brown MS, Goldstein JL (1979) Receptor-mediated endocytosis: insights from the lipoprotein receptor system. Proc Natl Acad Sci U S A 76:3330–3337. 10.1073/pnas.76.7.3330 10.1073/pnas.76.7.3330 - DOI - PMC - PubMed

LinkOut - more resources