. 2024 Jan 31;11(1):13.
doi: 10.1186/s40658-024-00616-4.

Validation of a discovery MI 4-ring model according to the NEMA NU 2-2018 standards: from Monte Carlo simulations to clinical-like reconstructions

Affiliations

Validation of a discovery MI 4-ring model according to the NEMA NU 2-2018 standards: from Monte Carlo simulations to clinical-like reconstructions

Antoine Merlet et al. EJNMMI Phys. .

Abstract

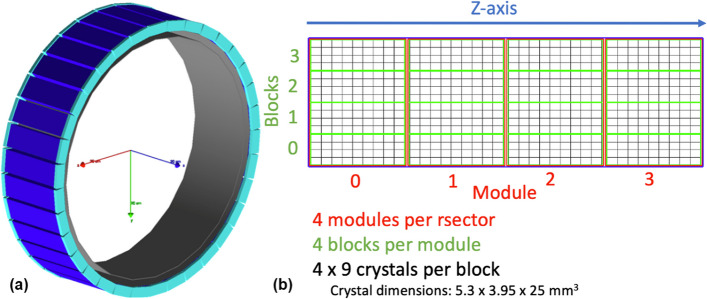
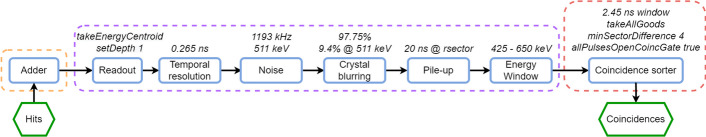
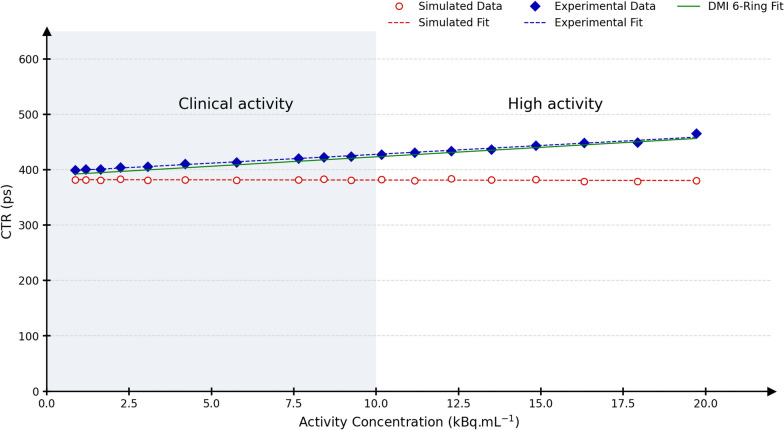
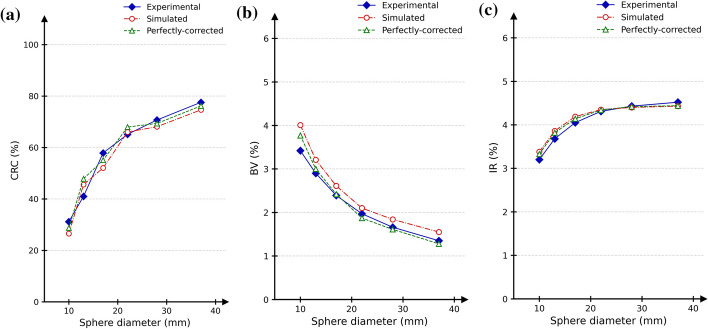
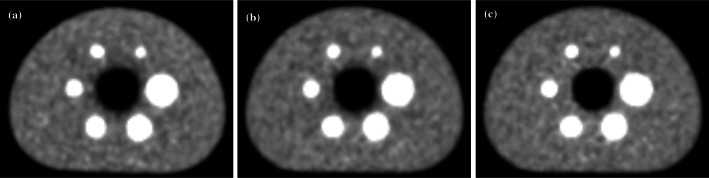
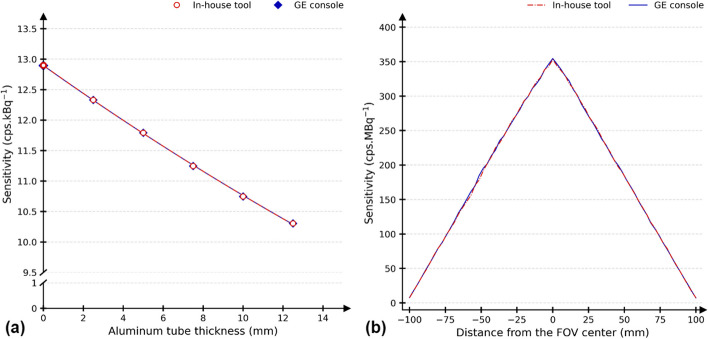
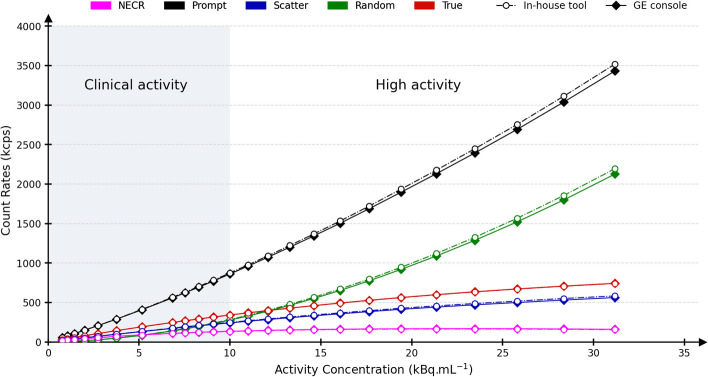
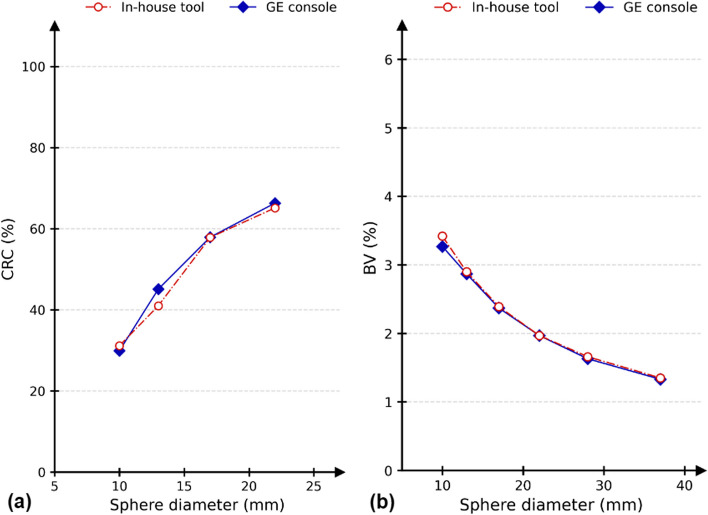
Background: We propose a comprehensive evaluation of a Discovery MI 4-ring (DMI) model, using a Monte Carlo simulator (GATE) and a clinical reconstruction software package (PET toolbox). The following performance characteristics were compared with actual measurements according to NEMA NU 2-2018 guidelines: system sensitivity, count losses and scatter fraction (SF), coincidence time resolution (CTR), spatial resolution (SR), and image quality (IQ). For SR and IQ tests, reconstruction of time-of-flight (TOF) simulated data was performed using the manufacturer's reconstruction software.

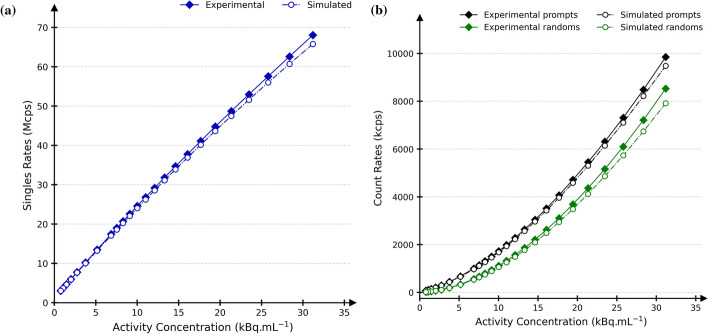
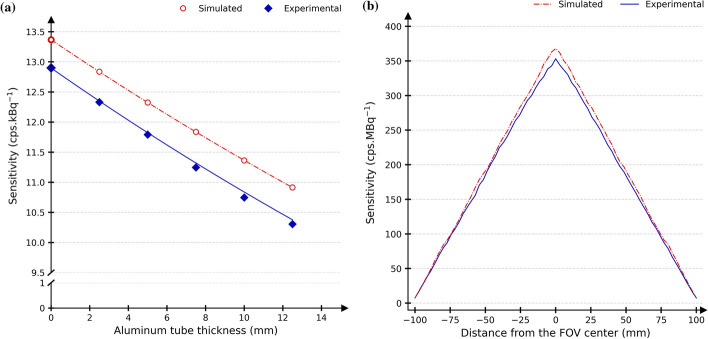
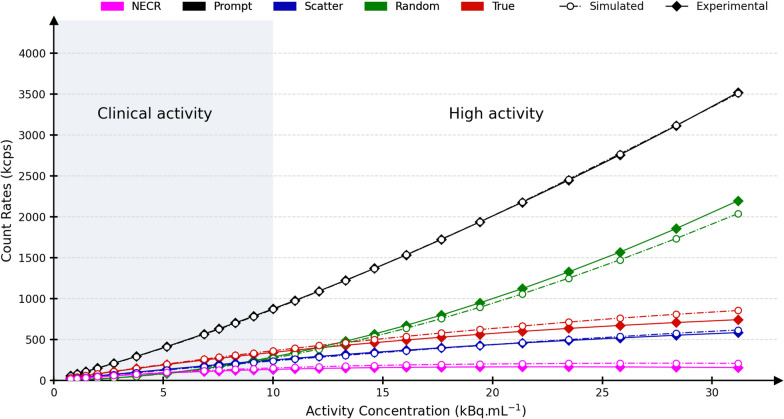
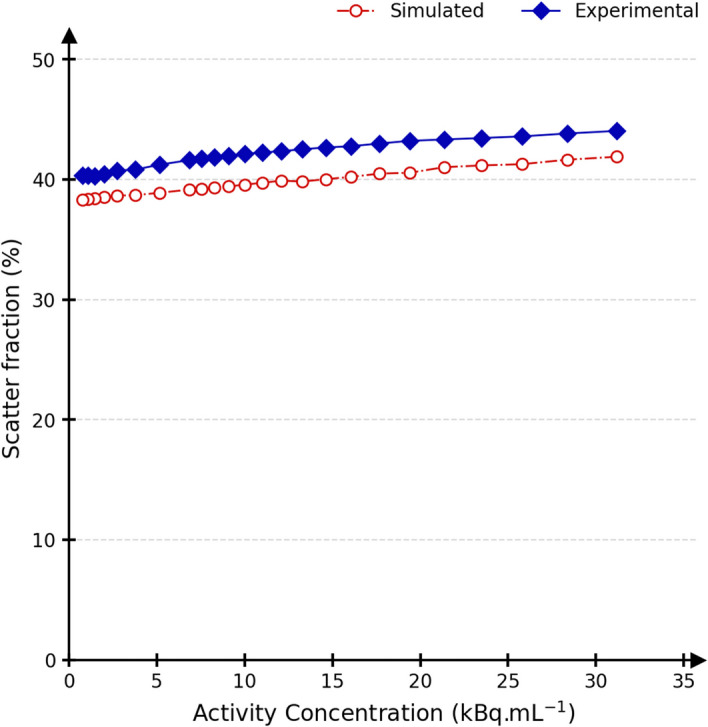
Results: Simulated prompt, random, true, scatter and noise equivalent count rates closely matched the experimental rates with maximum relative differences of 1.6%, 5.3%, 7.8%, 6.6%, and 16.5%, respectively, in a clinical range of less than 10 kBq/mL. A 3.6% maximum relative difference was found between experimental and simulated sensitivities. The simulated spatial resolution was better than the experimental one. Simulated image quality metrics were relatively close to the experimental results.

Conclusions: The current model is able to reproduce the behaviour of the DMI count rates in the clinical range and generate clinical-like images with a reasonable match in terms of contrast and noise.

Keywords: GATE; Monte Carlo simulation; NEMA; Nuclear medicine; PET.


Conflict of interest statement

The authors declare that they have no competing interests.

Figures

Fig. 1
Fig. 1
a GATE representation of the DMI 4-ring with the rsectors (34 in totals) in blue, the lead shielding in cyan and the detector covers in grey and b the structure of a rsector
Fig. 2
Fig. 2
The complete digitiser model of the DMI 4-ring. In blue are the different modules with their associated parameters values. The orange dashed box encapsulates the processing of hits, the purple one the processing of pulses, and the last red box the processing of singles into coincidences
Fig. 3
Fig. 3
Singles rates in blue (a) and prompts (black) and randoms (green) rates (b) for simulated (dash-dotted) and measured (continuous) data
Fig. 4
Fig. 4
Report of a system sensitivity at the centre of the FOV for all aluminium thickness and the extrapolated sensitivity and b axial slices sensitivity with respect to the distance from FOV centre. Experimental (blue) and simulated (red) data are represented
Fig. 5
Fig. 5
Prompt (black), random (green), scatter (blue) and true (red) count rates (kcps) for experimental (continuous) and simulated (dash-dotted) data relative to the activity concentration (kBq/mL). The noise equivalent count rates (NECR) are shown in purple. The clinical activity range (activity concentration < 10 kBq/mL) is outlined
Fig. 6
Fig. 6
The scatter fraction (%) for experimental (continuous) and simulated (dash-dotted) data relative to the activity concentration (kBq/mL)
Fig. 7
Fig. 7
Experimental (blue) and simulated (red) CTR data points and the associated fits. The green fit is adapted from the time-of-flight resolution results presented by Zeimpekis et al. [43] for a DMI 6-ring scanner
Fig. 8
Fig. 8
Comparison between experimental (blue continuous), simulated (red dash-dotted) and perfectly-corrected (green dashed) contrast recovery coefficient (a), (b) background variability and (c) image roughness for the six hot spheres of the NEMA phantom/model
Fig. 9
Fig. 9
Visual comparison between the central slices of the TOFOSEM reconstruction of a experimental data, b simulated data with clinical-like corrections, and c simulated data with perfect corrections. All images were normalised by their maximum, and the same window and level were used
Fig. 10
Fig. 10
Validation of our in-house NEMA sensitivity tool (dash-dotted) against GE’s console (continuous). The extrapolated sensitivities for zero absorber (a) and the slice-wise sensitivities (b) were in a 1.0% and 4.9% agreement, respectively
Fig. 11
Fig. 11
Validation of our NEMA count rates tool. Rates computed with our in-house tool (dash-dotted) were within a 3.6% margin of rates obtained using GE’s tool (continuous). This induced up to 2.2% relative difference for the scatter fraction
Fig. 12
Fig. 12
Validation of our in-house NEMA image quality tool. As the GE console is able to process only four hot spheres of the IEC phantom, a shows the CRC over these spheres, where a 9.1% agreement is found between the GE console (continuous) and our in-house tool (dash-dotted). The BV depicted in b was in a 4.8% agreement between both analyses

References

    1. Hicks RJ. The role of PET in monitoring therapy. Cancer Imaging. 2005;5(1):51–7. 10.1102/1470-7330.2005.0006 - DOI - PMC - PubMed
    1. Vandenberghe S, Marsden PK. PET-MRI: a review of challenges and solutions in the development of integrated multimodality imaging. Phys Med Biol. 2015;60(4):R115–54. 10.1088/0031-9155/60/4/R115 - DOI - PubMed
    1. Slart RHJA, Tsoumpas C, Glaudemans AWJM, Noordzij W, Willemsen ATM, Borra RJH, et al. Long axial field of view PET scanners: a road map to implementation and new possibilities. Eur J Nucl Med Mol Imaging. 2021;48(13):4236–45. 10.1007/s00259-021-05461-6. 10.1007/s00259-021-05461-6 - DOI - PMC - PubMed
    1. Zaidi H. Relevance of accurate Monte Carlo modeling in nuclear medical imaging. Med Phys. 1999;26(4):574–608. 10.1118/1.598559 - DOI - PubMed
    1. Buvat I, Lazaro D. Monte Carlo simulations in emission tomography and GATE: an overview. Nuclear Instrum Methods Phys Res Sect A Accel Spectrom Detect Assoc Equip. 2006;569(2):323–9.10.1016/j.nima.2006.08.039 - DOI - PMC - PubMed