. 2024 Mar 28;67(6):4525-4540.
doi: 10.1021/acs.jmedchem.3c01820. Epub 2024 Jan 31.

Focused Screening Identifies Different Sensitivities of Human TET Oxygenases to the Oncometabolite 2-Hydroxyglutarate

Affiliations

Focused Screening Identifies Different Sensitivities of Human TET Oxygenases to the Oncometabolite 2-Hydroxyglutarate

Roman Belle et al. J Med Chem. .

Abstract

Ten-eleven translocation enzymes (TETs) are Fe(II)/2-oxoglutarate (2OG) oxygenases that catalyze the sequential oxidation of 5-methylcytosine to 5-hydroxymethylcytosine, 5-formylcytosine, and 5-carboxylcytosine in eukaryotic DNA. Despite their roles in epigenetic regulation, there is a lack of reported TET inhibitors. The extent to which 2OG oxygenase inhibitors, including clinically used inhibitors and oncometabolites, modulate DNA modifications via TETs has been unclear. Here, we report studies on human TET1-3 inhibition by a set of 2OG oxygenase-focused inhibitors, employing both enzyme-based and cellular assays. Most inhibitors manifested similar potencies for TET1-3 and caused increases in cellular 5hmC levels. (R)-2-Hydroxyglutarate, an oncometabolite elevated in isocitrate dehydrogenase mutant cancer cells, showed different degrees of inhibition, with TET1 being less potently inhibited than TET3 and TET2, potentially reflecting the proposed role of TET2 mutations in tumorigenesis. The results highlight the tractability of TETs as drug targets and provide starting points for selective inhibitor design.


Conflict of interest statement

The authors declare no competing financial interest.

Figures
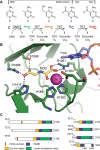
Figure 1
Figure 1
2OG oxygenase catalytic domains of TETs catalyze sequential oxidation of 5mC to 5hmC, 5fC, and then 5caC. (A) Schematic representation of cytosine methylation, oxidation, and demethylation cycle. Cytosine is methylated by DNMTs to give 5mC, which undergoes sequential oxidation to 5hmC, 5fC, and 5caC, as catalyzed by TETs. 5fC and 5caC can be restored to C by the TDG-BER mechanism. (B) View of the active site of TET2 (green) complexed with 5mC-containing DNA (blue). 5mC is positioned near Fe(II) (pink) and 2OG binding sites (cofactor mimic NOG, yellow) (the figure was derived from PDB: 4NM6(19)). Dark blue represents nitrogen; red as oxygen; and orange as phosphorus. (C) TET domain structures (left) and TET constructs used in this study (right).
Figure 2
Figure 2
Small molecule inhibitors tested against TET1–3. The focused panel contains broad-spectrum 2OG oxygenase inhibitors (A, purple), HIF PHD inhibitors (B, green), KDM targeted inhibitors (C, black), HDAC inhibitor (D, red), TCA cycle intermediates and related compounds (E, blue), and relevant nucleosides (F, yellow).
Figure 3
Figure 3
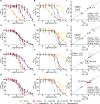
Representative AlphaScreen IC50 curves and correlation curves for inhibitors tested against TET1–3CD and TET2CDΔLCI. Plots for TET1CD (A,B), TET2CD (C,D), TET3CD (E,F), and TET2CDΔLCI (G,H) of selected inhibitors are shown. IOX1 (3, orange), NOG (5, pink), JIB-04 (14, gray), S-2HG (22, purple), R-2HG (23, black), ML324 (15, green), Vadadustat (13, red), IOX4 (8, yellow) and Panobinostat (21, blue). I-L AlphaScreen pIC50 correlation plots for inhibitors for TET1–3CD, TET2CDΔLCI. Pearson correlation and Spearman coefficients were calculated for comparisons. Standard conditions: 5mC (1, 10 nM), ascorbate (100 μM), Fe(II) (10 μM), 2OG (10 μM), with TET1CD (10 nM, 30 min incubation), TET2CD (1 nM, 10 min incubation), TET3CD (10 nM, 10 min incubation), or TET2CDΔLCI (1 nM, 10 min incubation). n = 2–4, error given as ± StDev. IC50 values are displayed in Table 1; compound structures are given in Figure 2. Circled dots—other compounds from Table 1.
Figure 4
Figure 4
Measurement and quantitation of TET2CDΔLCI catalyzed oxidation of 5mC to 5hmC, 5fC, and 5caC using the SPE-MS assay. (A) Representative SPE-MS spectra for TET2CDΔLCI (0.8 μM) catalysis in the presence of 5mC 28 (1.0 μM) using the [M–3H]3– charge state. Overlay of spectra from 0 min (black) and 5.57 min (red) time points showing sequential oxidation of 5mC to 5hmC (+16 Da relative to 5mC), 5fC (+14 Da relative to 5mC), and 5caC (+30 Da relative to 5mC). (B) Corresponding time course displaying the relative abundance of 5mC 28 (green), 5hmC (orange), 5fC (purple), and 5caC (red). (C,D) Representative IC50 curves of IOX1 (3, orange), NOG (5, pink), JIB-04 (14, gray), S-2HG (22, purple), R-2HG (23, black), IOX4 (8 yellow), Vadadustat (13, red), ML324 (15, green), and Panobinostat (21, blue) tested with TET2CDΔLCI (0.4 μM) and 5mC-DNA 28 (2.0 μM). Assays were quenched after 10 min (∼20–30% 5hmC product formation at a linear range (R2: 0.99, Figure S6C)) to minimize formation of subsequent oxidative products 5fC and 5caC. Standard conditions: 5mC-DNA (28, 2.0 μM) and TET2CDΔLCI (0.4 μM), ascorbate (200 μM), Fe(II) (50 μM), 2OG (10 μM). Data are plotted as mean (n = 2–4) and error given as ± StDev.
Figure 5
Figure 5
Small molecule inhibitors of TETs can reduce global 5hmC levels in cells. (A) Selected images of IF staining of Dox-inducible U2OS cells stably transfected with FLAG-tagged TET1CD. An increase in FLAG (red) and 5hmC (green) staining, corresponding to overexpression of catalytically active TET1CD, is observed only after Dox (1 mg mL–1)-mediated induction. DAPI nuclear staining is in blue. Reduction in the 5hmC level is observed while FLAG staining is maintained when cells are treated with TET inhibitors (e.g., IOX4 8). This trend corresponds to observations with cells overexpressing a catalytically inactive TET1CD mutant (Figures S7–S9). (B) Representative EC50 curves for IOX1 3, IOX4 8, JIB-04 14, and DMOG 30 for Dox-induced U2OS cells overexpressing TET1CD. All tested compounds reduce 5hmC levels in a dose-dependent manner. The 5hmC levels of Dox-induced and -uninduced control cells (1% DMSO) are indicated. Data are plotted as mean and error given as ± s.e.m (n > 3000 cells). See Figures S9 and S11 for dosing data on TET1CD MUT.
Figure 6
Figure 6
Evidence that the TET isozymes have different sensitivities to 2-hydroxyglurate enantiomers (2HGs) in cells. Representative dose–response curves for IF cell assays for U2OS cells stably expressing TET1CD (A), TET2CD (B), and TET3CD (C) dosed with inhibitors for 24 h. Data are normalized to 5hmC levels of doxycyclin-induced TET-expressing cells (+Dox) and uninduced (-Dox) cells treated with 1% DMSO. Data are plotted as mean, and the error is given as ± s.e.m (n > 3000 cells). (D) Tabulated cellular pEC50 values of inhibitors in IF assays for TET1CD, TET2CD, and TET3CD. Data are shown as mean with error given as ± StDev. of independent biological replicates with the number of replicates in brackets. N.I.: no inhibition at 3 mM. See Figure S13 for associated FLAG staining, cell counts, and TET1CD MUT data.

References

    1. Greenberg M. V. C.; Bourc’his D. The Diverse Roles of DNA Methylation in Mammalian Development and Disease. Nat. Rev. Mol. Cell Biol. 2019, 20 (10), 590–607. 10.1038/s41580-019-0159-6. - DOI - PubMed
    1. Tahiliani M.; Koh K. P.; Shen Y.; Pastor W. A.; Bandukwala H.; Brudno Y.; Agarwal S.; Iyer L. M.; Liu D. R.; Aravind L.; Rao A. Conversion of 5-Methylcytosine to 5-Hydroxymethylcytosine in Mammalian DNA by MLL Partner TET1. Science 2009, 324 (5929), 930–935. 10.1126/science.1170116. - DOI - PMC - PubMed
    1. Kriaucionis S.; Heintz N. The Nuclear DNA Base 5-Hydroxymethylcytosine Is Present in Purkinje Neurons and the Brain. Science 2009, 324 (5929), 929–930. 10.1126/science.1169786. - DOI - PMC - PubMed
    1. Ito S.; Shen L.; Dai Q.; Wu S. C.; Collins L. B.; Swenberg J. A.; He C.; Zhang Y. Tet Proteins Can Convert 5-Methylcytosine to 5-Formylcytosine and 5-Carboxylcytosine. Science 2011, 333 (6047), 1300–1303. 10.1126/science.1210597. - DOI - PMC - PubMed
    1. Cedar H.; Bergman Y. Linking DNA Methylation and Histone Modification: Patterns and Paradigms. Nat. Rev. Genet. 2009, 10 (5), 295–304. 10.1038/nrg2540. - DOI - PubMed

Publication types

LinkOut - more resources