. 2024 Mar 1;35(3):ar43.
doi: 10.1091/mbc.E23-02-0060. Epub 2024 Jan 31.

Rab11 regulates autophagy at dendritic spines in an mTOR- and NMDA-dependent manner

Affiliations

Rab11 regulates autophagy at dendritic spines in an mTOR- and NMDA-dependent manner

Aleksandra Janusz-Kaminska et al. Mol Biol Cell. .

Abstract

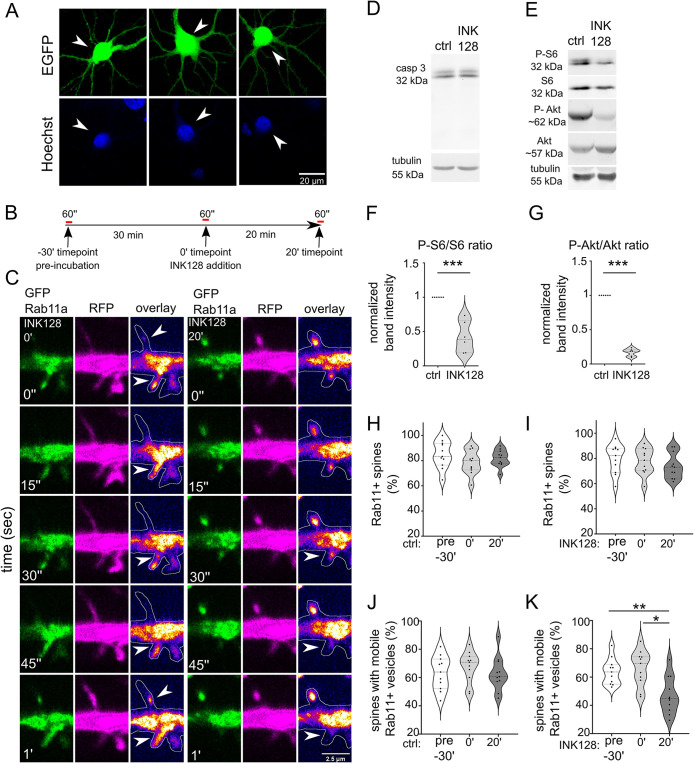
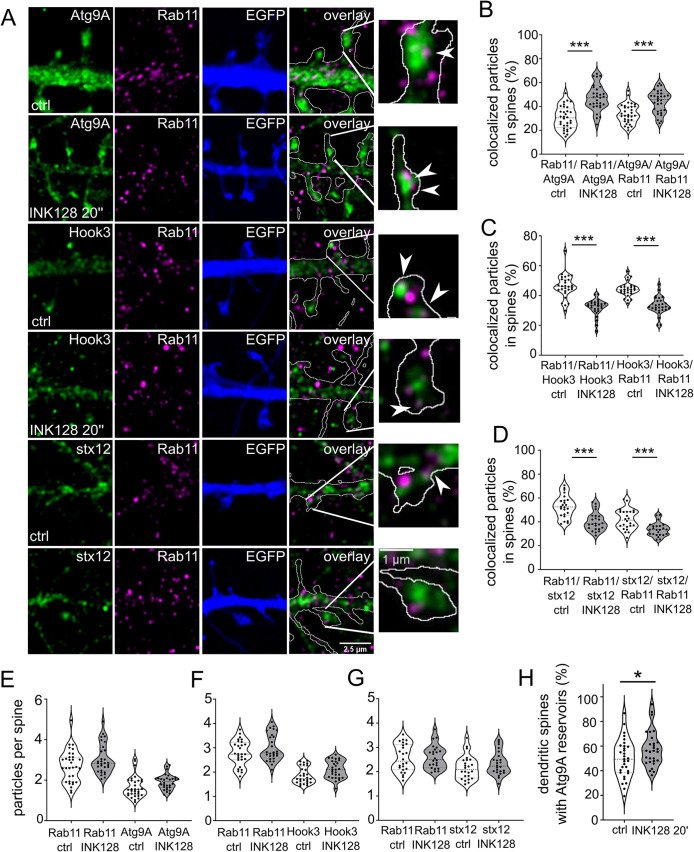
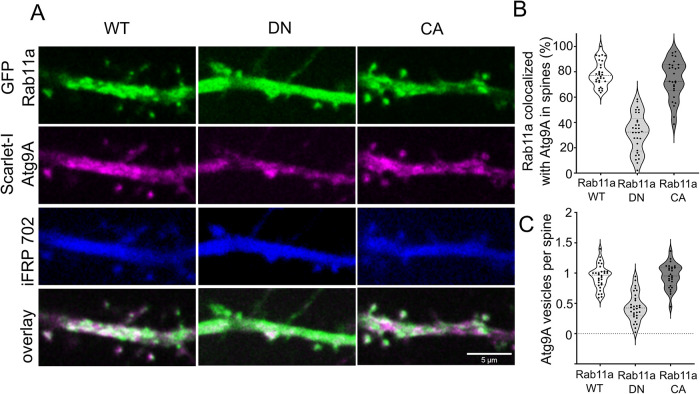
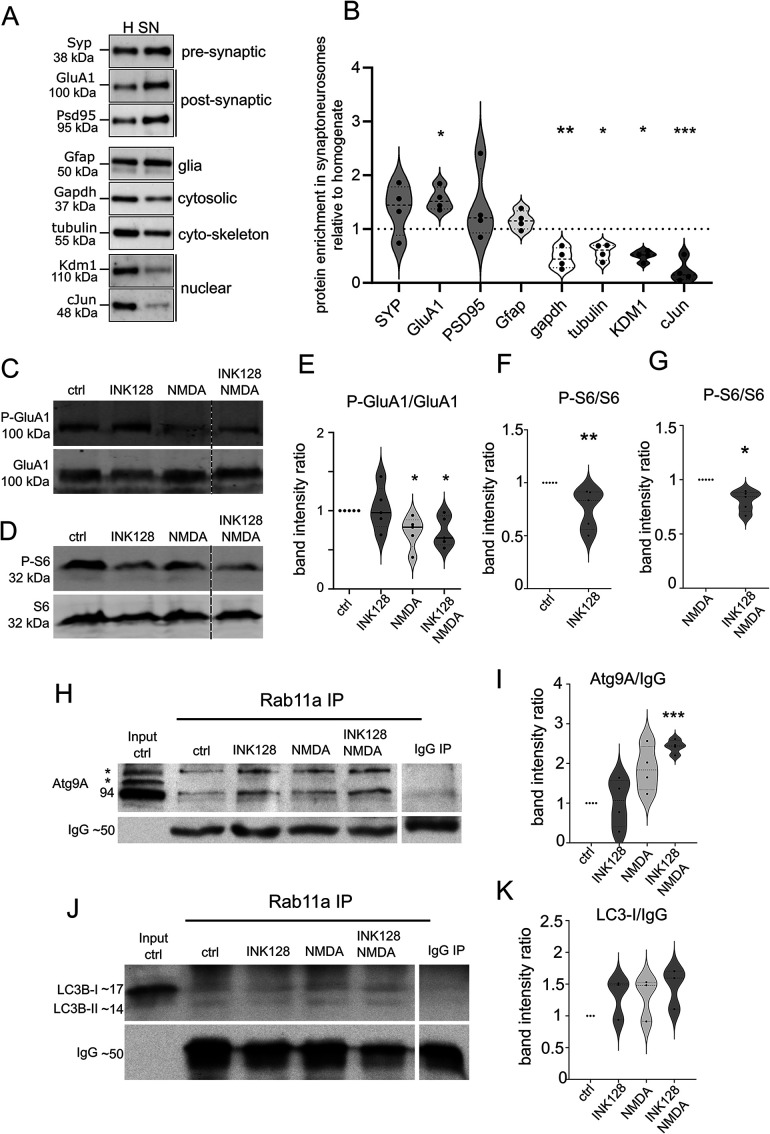
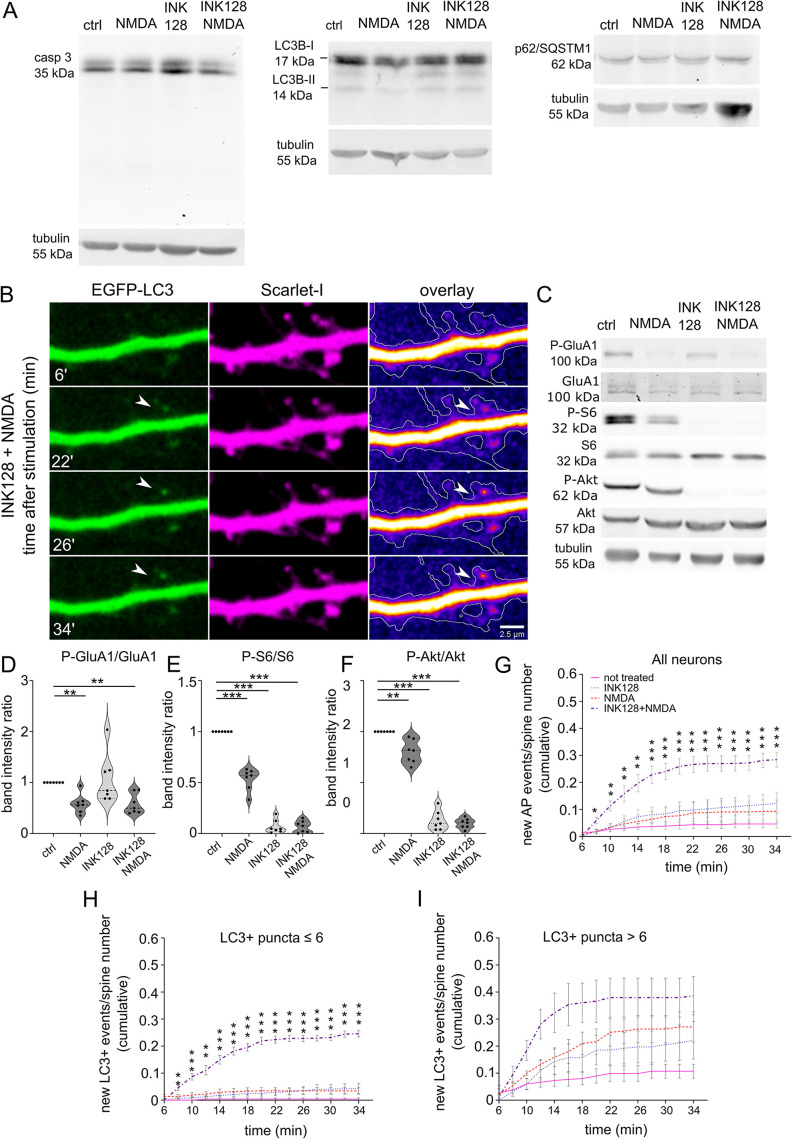
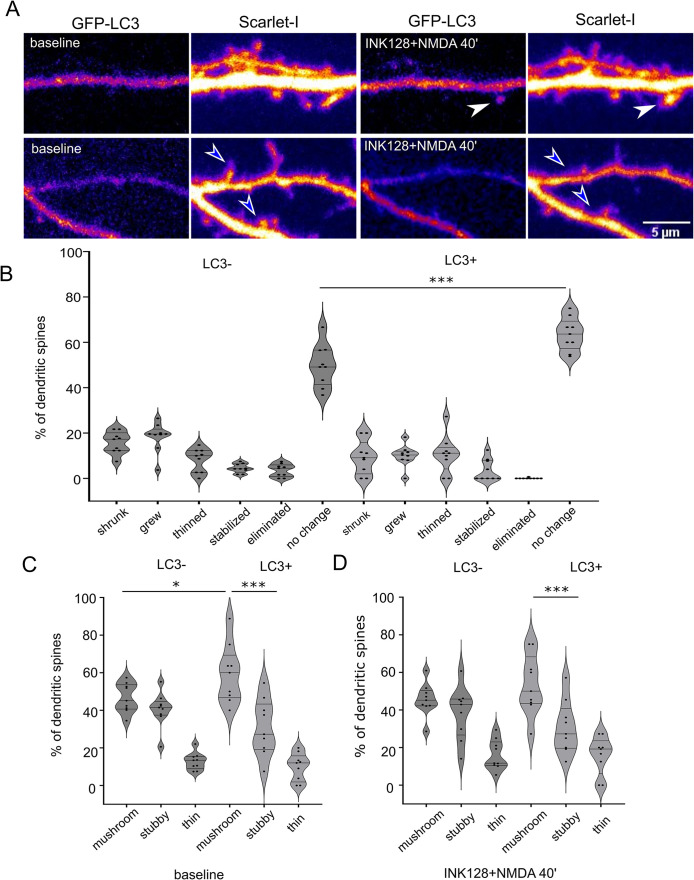
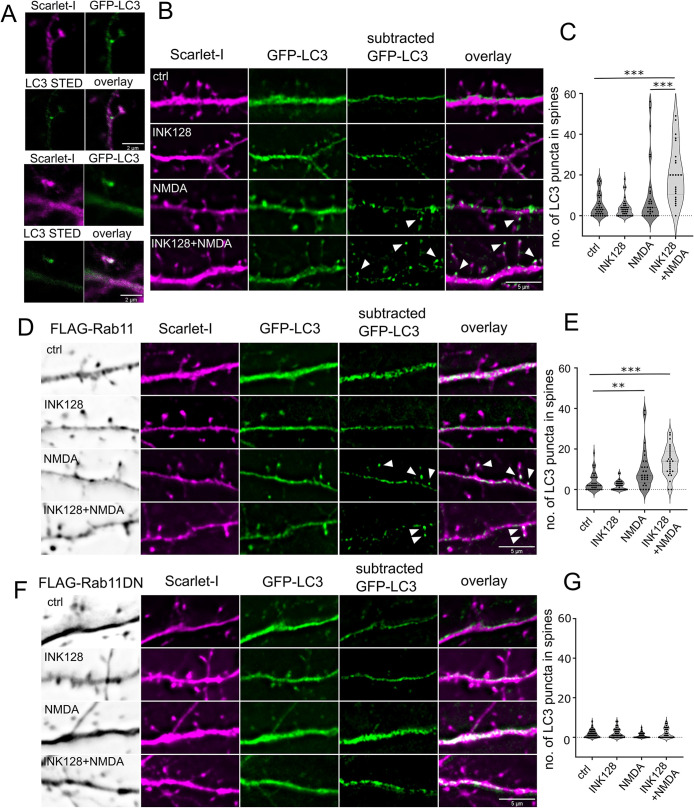
Synaptic plasticity is a process that shapes neuronal connections during neurodevelopment and learning and memory. Autophagy is a mechanism that allows the cell to degrade its unnecessary or dysfunctional components. Autophagosomes appear at dendritic spines in response to plasticity-inducing stimuli. Autophagy defects contribute to altered dendritic spine development, autistic-like behavior in mice, and neurological disease. While several studies have explored the involvement of autophagy in synaptic plasticity, the initial steps of the emergence of autophagosomes at the postsynapse remain unknown. Here, we demonstrate a postsynaptic association of autophagy-related protein 9A (Atg9A), known to be involved in the early stages of autophagosome formation, with Rab11, a small GTPase that regulates endosomal trafficking. Rab11 activity was necessary to maintain Atg9A-positive structures at dendritic spines. Inhibition of mTOR increased Rab11 and Atg9A interaction and increased the emergence of LC3 positive vesicles, an autophagosome membrane-associated protein marker, in dendritic spines when coupled to NMDA receptor stimulation. Dendritic spines with newly formed LC3+ vesicles were more resistant to NMDA-induced morphologic change. Rab11 DN overexpression suppressed appearance of LC3+ vesicles. Collectively, these results suggest that initiation of autophagy in dendritic spines depends on neuronal activity and Rab11a-dependent Atg9A interaction that is regulated by mTOR activity.


Figures

FIGURE 1:
FIGURE 1:
mTOR inhibition decreases Rab11 mobility in dendritic spines. (A) Representative images of neurons transfected, using Lipofectamine 2000, at ∼ 3 wk in culture, with plasmid encoding EGFP (arrowheads) stained with Hoechst33258. The image shows healthy, nonshrunk nuclei of transfected cells. (B) Diagram of treatment and imaging for experiments in Figure 1. Neurons were recorded for 1 min (preincubation recording; pre-30′), then incubated for 30 min to control potential phototoxicity or overheating in the microscope stage. Then, neurons were rerecorded (0′) and incubated for 20 min without (ctrl 20′) or with 300 nM mTOR inhibitor INK128 (INK128 20′) for the final recording. (C) Representative time-lapse images of dendrites of rat hippocampal neurons that were cotransfected on DIV22 with plasmids encoding GFP-Rab11a and RFP and treated the next day with INK128 (300 nM). The figure shows Rab11a vesicles (green), RFP (magenta), an overlay with GFP-Rab11a (fire pseudocolor), and the outline based on the RFP channel (hand-drawn ROI). Arrows indicate dendritic spines with motile vesicles. Imaging occurred ∼17–24 h after transfection. Neurons were imaged three times, always for 1 min, at the baseline (unpublished data, in D and E; INK 128 pre-30′; see panels I and K), 30 min later just before treatment (INK128 0′) and after 20′ incubation with INK128 (INK128 20′). Control neurons (unpublished data in C) were imaged as described above without any treatment (ctrl pre-30′, ctrl 0′, and ctrl 20′, see H and J). Scale bar = 2.5 µm. (D) Western blot analysis of INK128 treatment effects on caspase 3 (casp 3) cleavage in cultured neurons. Primary hippocampal rat neurons (DIV21) were treated with INK128 (300 nM) for 20 min. Extracts were blotted against casp 3 with tubulin as a loading control. (E–G) Western blot analysis of mTORC1 and mTORC2 inhibition by INK128. The same extracts as in (D) were blotted against phosphorylated (Ser235/S236, P-S6) and total S6 and phosphorylated (Ser473, P-Akt) and total Akt to evaluate mTORC1 and mTORC2 suppression, respectively, with tubulin as a loading control. Data are presented as mean gray values for each phosphorylated protein normalized to total protein. n = 6 both for ctrl and INK128. ***p ≤ 0.001 (one-sample t test) (H) Percentage of Rab11a-positive spines in control neurons. (I) Percentage of Rab11a-positive spines in INK128-treated neurons. (J) Percentage of spines with mobile Rab11a in control neurons. (K) Percentage of spines with mobile Rab11a in INK128-treated neurons. The data are presented as a mean percentage of Rab11a positive spines normalized to all spines (H and I) or the mean percentage of Rab11a positive spines with mobile vesicles normalized to all Rab11a positive spines for all analyzed cells (J and K). n = 11 cells for treated and untreated neurons from four independent experiments. *p ≤ 0.05, **p ≤ 0.01 (repeated-measures ANOVA followed by Tukey’s post hoc test, all columns were compared with all columns).
FIGURE 2:
FIGURE 2:
mTOR inhibition targets Rab11 to Atg9A-positive reservoirs. (A) Representative Airyscan images of dendrites of neurons that were transfected with a plasmid encoding EGFP (blue) on DIV22 to allow accurate dendritic spine tracing and immunostained the next day for native Rab11 (magenta) and Atg9A, Hook3, or syntaxin 12 (stx12; green). The overlay channel shows Rab11 (magenta), Atg9A, Hook3, or stx12 (green), and the EGFP channel as an outline. The plasmid was expressed overnight. The neurons were incubated with INK128 (300 nM) for 20 min, fixed, and immunostained. Scale bar = 2.5 µm. The rightmost photomicrographs represent individual dendritic spines indicated in the overlay panels. Arrows indicate exemplary colocalized particles. Scale bar = 1 µm. (B) Colocalization of Rab11 with Atg9A in dendritic spines of neurons that were treated as in (A). (C) Colocalization of Rab11 with Hook3 in dendritic spines of neurons that were treated as in (A). (D) Colocalization of Rab11 with stx12 in dendritic spines of neurons that were treated as in (A). (E) Number of Rab11 and Atg9A particles per spine in neurons treated as in (A). (F) Number of Rab11 and Hook3 particles per spine in neurons treated as in (A). (G) Number of Rab11 and stx12 particles per spine in neurons treated as in (A). Data are presented as percentages of colocalized particles normalized to all particles in each channel (B, C, and D) or the number of total particles normalized to the number of dendritic spines (D, E, and F) for all neurons. The number of cells for Atg9A immunofluorescence analysis: n = 32 (control) and 30 (INK128) neurons from four independent experiments. The number of cells for Hook3 immunofluorescence analysis: n = 28 for both variants from three independent experiments. The number of cells for stx12 immunofluorescence analysis: n = 24 for both variants from three independent experiments. ***p ≤ 0.001 (one-way ANOVA followed by Sidak’s post hoc test). (H) Semiquantitative estimate of the prevalence of Atg9A large vesicles (reservoirs) in the dendritic spines. Same neurons as in B were evaluated for the presence of Atg9A-positive structures > 0.150 µm2 in the spines. The result was normalized to the number of dendritic spines and shown as a percentage. Data are presented as mean. n = 32 and 30 cells for control and INK128 variants from four independent experiments. *p < 0.05 (unpaired t test).
FIGURE 3:
FIGURE 3:
Rab11a GTPase activity is necessary for the presence of Atg9A at dendritic spines. (A) Representative images of DIV22 neurons that were cotransfected with plasmids encoding GFP-Rab11a, DN Rab11a, or constitutively active (CA) Rab11a (green) together with Scarlet-I-Atg9A (magenta) and iRFP702 (blue). Imaging occurred 17–24 h after transfection. Scale bar = 5 µm. (B) Colocalization rate (percentage of colocalized vesicles) of transfected Rab11 variant and Atg9a at dendritic spines. (C) The number of Atg9a particles per spine of neurons transfected with the indicated Rab11 variants. Data are presented as the mean percentage of colocalized Rab11a particles normalized to all particles (B) or the number of Atg9A particles normalized to the number of spines for all cells (C). Number of analyzed cells: n = 30 for Rab11a WT, n = 30 for DN Rab11, and n = 27 for CA Rab11a from three independent experiments. ***p ≤ 0.001 (one-way ANOVA followed by Sidak’s post hoc test).
FIGURE 4:
FIGURE 4:
Rab11a interacts with Atg9A in mouse synaptoneurosomes. (A and B) Western blot analysis of the fractions obtained during synaptoneurosomes (SN) preparation. Enrichment of both pre- and postsynaptic markers and depletion of cytosolic and nuclear markers in the SN fraction relative to the homogenate was observed. Glial marker (Gfap) was present, but not enriched (n = 4 biological replicates, paired t test, *p ≤ 0.05, **p ≤ 0.01, ***p ≤ 0.001). (C and E) Western blot analysis of NMDA stimulation in synaptoneurosomal preparations. Synaptoneurosomes were prepared as in Figure 4A, and levels of protein extracts were blotted against phosphorylated (Ser845; P-GluA1) and total GluA1 to evaluate GluA1 dephosphorylation. Dashed lines indicate membrane image cuts. Data are presented as mean gray values for each phosphorylated protein normalized to total protein. n = 5 for all samples. *p < 0.05, **p < 0.01 (one-sample t test). (D, F, and G) Western blot analysis of mTORC1 inhibition by INK128. Synaptoneurosome extracts were blotted against phosphorylated P-S6 (Ser235/236; C, D) and S6 to evaluate mTORC1 complex suppression. Dashed lines show membrane image cuts. Data are presented as mean gray values for each phosphorylated protein normalized to total protein. n = 5 for all samples. *p < 0.05, **p < 0.01 (one-sample t test). (H) Western blot analysis of Atg9A coimmunoprecipitation with Rab11a from mouse synaptoneurosomes. Samples were first subjected to the treatments and then coimmunoprecipitated with anti-Rab11a antibody (see Materials and Methods). The blot shows the control immunoprecipitation sample following the input fraction (precleared control synaptoneurosome extract). The samples were then treated with INK128 (600 nM) alone, NMDA (50 µM) alone, or NMDA+INK128. The bands marked as * corresponds to posttranslational modifications of Atg9A. (I) Atg9A signal intensity ratios of the respective samples. The lower band (Atg9A without posttranslational modifications) was used for quantification. Mean gray values were normalized to IgG as a loading control and then to the control sample. n = 4. ***p ≤ 0.001 (one-sample t test). (J) Western blot analysis of LC3B coimmunoprecipitation with Rab11a from mouse synaptoneurosomes prepared and treated as in (H). (K) LC3B western blot and signal intensity ratios, calculated as above. The band corresponding to LC3-I was used for quantitation to assess LC3B association with Rab11/Atg9A complex regardless of autophagic flux. n = 3.
FIGURE 5:
FIGURE 5:
Simultaneous mTOR inhibition and NMDA stimulation induces the emergence of LC3+ vesicles at dendritic spines in rat hippocampal cultured neurons. (A) Western blot analysis of levels of caspase 3 (casp 3), LC3B, and p62 in primary hippocampal rat neurons (DIV21) treated with INK128 (300 nM) or DMSO for 15 min and then NMDA (50 µM) for 3 min followed by the medium changed, and incubation with DMSO or INK128 (300 nM) for next 35 min. Tubulin is shown as a loading control. (B) Representative images of a dendrite of a rat hippocampal neuron cotransfected with plasmids encoding EGFP-LC3 and Scarlet-I on DIV22 were treated the next day with INK128 (300 nM) and NMDA (50 µM). The arrow points to a new LC3+ vesicle emerging upon treatment. Scale bar = 2.5 µm. (C–F) Western blot analysis of NMDA application and mTORC1 and mTORC2 inhibition by INK128. Extracts treated as in (A) were blotted against phosphorylated (Ser845; P-GluA1) and total GluA1 to evaluate GluA1 dephosphorylation considered a marker for cLTD, P-S6 (Ser235/236), and S6 to evaluate mTORC1 complex suppression and P-Akt (Ser473) and Akt to evaluate mTORC2 suppression. Tubulin level serves as a loading control. Data are presented as mean gray values for each phosphorylated protein normalized to total protein. n = 7 for all samples. **p ≤ 0.01, ***p ≤ 0,001 (one-sample t test). (G) Neurons that were transfected as in (B) were either untreated or pretreated with INK128 (300 nM) for 15 min and then treated with NMDA for 3 min. The medium was then changed, and the neurons were incubated with or without INK128 (300 nM). Cumulative analysis of EGFP-LC3 vesicles showed that they appeared at dendritic spines at 2-min intervals, starting 6 min after NMDA application (shown as the total number of events normalized to the number of visible spines). Data are presented as a mean of cumulative events normalized to the number of spines for all time points and cells. Error bars show the standard error of the mean. Comparisons refer to the control cells in each time point, respectively. n = 14 control cells. n = 12 INK128-treated cells. n = 10 NMDA-treated cells. n = 11 INK128+NMDA-treated cells. *p ≤ 0.05, **p ≤ 0.01, ***p ≤ 0.001 (two-way ANOVA followed by Dunnett’s post hoc test). (H and I) Cumulative analysis of EGFP-LC3 vesicles of the same neurons as in (G), split into two groups with initial LC3+ puncta number ≤ 6 (H) or > 6 (I). Data are presented as a mean of cumulative events normalized to the number of spines for all time points and cells. Comparisons refer to the control cells in each time point, respectively. Error bars show the standard error of the mean. In (H): n = 11 for control cells, n = 7 for INK128-treated cells, n = 7 for NMDA-treated cells, n = 8 for INK128+NMDA-treated cells. In (I): n = 3 for control cells, n = 5 for INK128-treated cells, n = 3 for NMDA-treated cells, n = 3 for INK128+NMDA treated cells. *p ≤ 0.05, **p ≤ 0.01, ***p ≤ 0.001 (two-way ANOVA followed by Dunnett’s post hoc test).
FIGURE 6:
FIGURE 6:
Dendritic spines that contain EGFP-LC3-positive vesicles after NMDA application are less susceptible to shape change. (A) Representative images of dendrites of a rat hippocampal neuron cotransfected on DIV22 with plasmids encoding GFP-LC3 and Scarlet-I that were treated with INK128 and NMDA the next day. Scale bar = 5 µm. Before treatment, neurons were recorded for 10 min (baseline). Then neurons were pretreated with INK128 (300 nM) for 15 min and next stimulated with NMDA (50 µM) for 3 min (INK128+NMDA 40′). Afterward, media was replaced with conditioned media containing INK128. Neurons were recorded every 2 min for at least 46 min, starting 6 min after NMDA application. Dendritic spines were evaluated for the presence of LC3-positive vesicles throughout the movie. White arrows show examples of dendritic spines where LC3+ puncta appeared. Blue arrowheads show examples of dendritic spines without LC3+ puncta that underwent pruning. (B) Percentage of spines that underwent following changes: grew (over 25% increase in length compared with the baseline and/or change from stubby to mushroom), shrunk (over 25% decrease in length and/or change from mushroom to stubby), thinned (changed type from stubby or mushroom to thin spines), stabilized (thin changed to stubby or mushroom), eliminated (loss of spine confirmed visually over the whole timecourse) or did not change, evaluated for the emergence of LC3 puncta through the time-lapse. Data are presented as percentages of LC3- or LC3+ spines for all cells. n = 9 cells from four independent experiments. One way ANOVA with Sidak’s post hoc test. Columns were compared pairwise in all categories between LC3- and LC3+ spines. There were slightly more spines that grew in LC3- variant than in the LC3+ variant (p = 0.2), which was not shown on the graph for clarity. (***p ≤ 0.001). (C and D) Percentage of spines classified as mushroom, stubby, or thin (see Materials and Methods), measured in the frame in focus minimum 40 min after the NMDA application, for LC3- and LC3+ puncta, respectively. Data are presented as percentages of LC3- or LC3+ spines for all cells. n = 9 cells from four independent experiments One way ANOVA with Sidak post hoc test. All columns were compared with all columns and selected comparisons were presented on the graph. (**p ≤ 0.01, ***p ≤ 0.001).
FIGURE 7:
FIGURE 7:
Rab11 activity is necessary for LC3+ dendritic spine puncta increase upon NMDA application and mTOR inhibition. (A) Example confocal and STED images (20 nm resolution) of LC3+ puncta in the dendritic spine neck and head, respectively. The same cells were evaluated as in (B) The examples come from the INK128 + NMDA treatment variant. Scale bar = 2 µm. (B and C) 22 DIV neurons were transfected with plasmids expressing EGFP-LC3, Scarlet-I and pcDNA as a supplemental plasmid. Neurons were either untreated or pretreated with INK128 (300 nM) for 15 min and then treated with 20 µM NMDA for 5 min. The medium was then changed, and the neurons were incubated with or without INK128 (300 nM) with the addition of Baf1A (100 nm) as an inhibitor of autophagosome acidification. Following the experiment neurons were fixed and immunostained for FLAG-tag together with Rab11 WT and DN overexpressing neurons. Results present number of spherical/ovoid LC3+ puncta over ∼0.47 µm in diameter in the dendritic spine head or neck per cell in view. Scale bar = 5 µm. N = 4 independent experiments, n for each variant: ctrl = 36, INK128 = 35, NMDA = 29, INK128+NMDA = 26. Outliers (5) were removed with ROUT test with Q = 0.1%. Outlier removal with ROUT test did not change which comparisons were significant, nor p intervals. One way ANOVA with Tukey posttest, all columns were compared with all columns. Comparison of INK128 with INK128 NMDA variant was also significant (p ≤ 0.001) but not shown on the graph for clarity (* p ≤ 0.05, *** p ≤ 0.001). (D and E). Neurons from the same experiments with FLAG-Rab11 overexpression instead of pcDNA. Scale bar = 5 µm. N = 4 independent experiments, n for each variant: ctrl = 34, INK128 = 34, NMDA = 28, INK128+NMDA = 28. Outliers (6) were removed with ROUT test with Q = 0.1%. Outlier removal with ROUT test did not change, which comparisons were significant, nor p intervals. One way ANOVA with Tukey post hoc test, all columns were compared with all columns. Comparisons of INK128 with NMDA and INK128 NMDA variant were also significant (p ≤ 0.001) but not shown on the graph for clarity (**p ≤ 0.01, ***p ≤ 0.001). (F and G). Neurons from the same experiments with FLAG-Rab11 DN overexpression instead of pcDNA. Scale bar = 5 µm. N = 4 independent experiments, n for each variant: ctrl = 36, INK128 = 36, NMDA = 31, INK128+NMDA = 34. Outliers (8) were removed with ROUT test with Q = 0.1%. One way ANOVA with Tukey post hoc test, all columns were compared with all columns. Outlier removal with ROUT test did not change, which comparisons were significant, nor p intervals.

References

    1. Aspernig H, Heimbucher T, Qi W, Gangurde D, Curic S, Yan Y, Donner von Gromoff E, Baumeister R, Thien A (2019). Mitochondrial Perturbations Couple mTORC2 to Autophagy in C. elegans. Cell Reports 29, 1399–1409.e5. - PubMed
    1. Bindels DS, Haarbosch L, van Weeren L, Postma M, Wiese KE, Mastop M, Aumonier S, Gotthard G, Royant A, Hink MA, Gadella TWJ (2017). mScarlet: a bright monomeric red fluorescent protein for cellular imaging. Nat Methods 14, 53–56. - PubMed
    1. Boland B, Kumar A, Lee S, Platt FM, Wegiel J, Yu WH, Nixon RA (2008). Autophagy induction and autophagosome clearance in neurons: relationship to autophagic pathology in Alzheimer’s disease. J Neurosci 28, 6926–6937. - PMC - PubMed
    1. Bolte S, Cordelières FP (2006). A guided tour into subcellular colocalization analysis in light microscopy. J Microsc 224, 213–232. - PubMed
    1. Borczyk M, Śliwińska MA, Caly A, Bernas T, Radwanska K (2019). Neuronal plasticity affects correlation between the size of dendritic spine and its postsynaptic density. Sci Rep 9, 1693. - PMC - PubMed

LinkOut - more resources