. 2024 Feb 27;43(2):113706.
doi: 10.1016/j.celrep.2024.113706. Epub 2024 Jan 30.

Systems immunology of transcriptional responses to viral infection identifies conserved antiviral pathways across macaques and humans

Affiliations

Systems immunology of transcriptional responses to viral infection identifies conserved antiviral pathways across macaques and humans

Kalani Ratnasiri et al. Cell Rep. .

Abstract

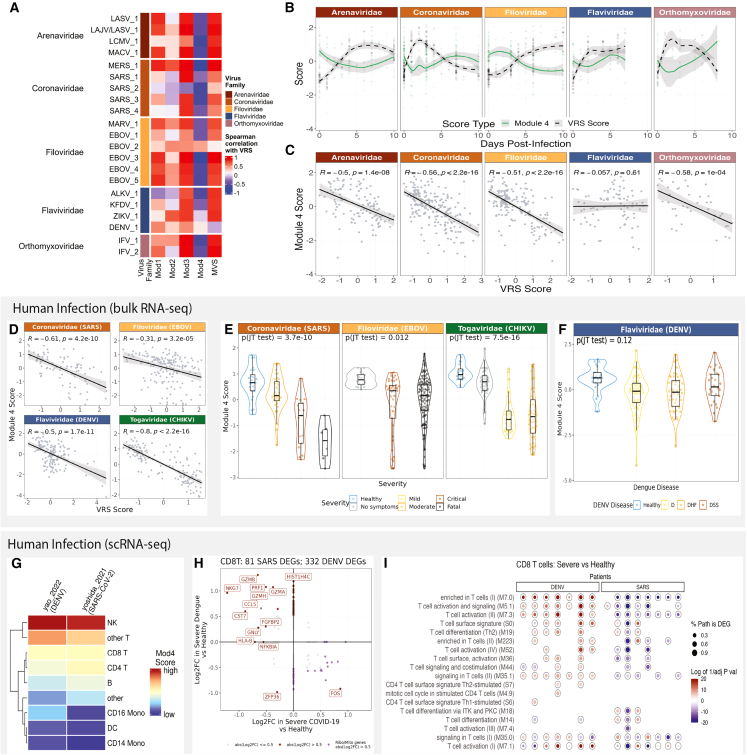
Viral pandemics and epidemics pose a significant global threat. While macaque models of viral disease are routinely used, it remains unclear how conserved antiviral responses are between macaques and humans. Therefore, we conducted a cross-species analysis of transcriptomic data from over 6,088 blood samples from macaques and humans infected with one of 31 viruses. Our findings demonstrate that irrespective of primate or viral species, there are conserved antiviral responses that are consistent across infection phase (acute, chronic, or latent) and viral genome type (DNA or RNA viruses). Leveraging longitudinal data from experimental challenges, we identify virus-specific response kinetics such as host responses to Coronaviridae and Orthomyxoviridae infections peaking 1-3 days earlier than responses to Filoviridae and Arenaviridae viral infections. Our results underscore macaque studies as a powerful tool for understanding viral pathogenesis and immune responses that translate to humans, with implications for viral therapeutic development and pandemic preparedness.

Keywords: CP: Immunology; antiviral immunity; conserved host response to viruses; human immune response; macaques; non-human primates; systems immunology; transcriptomics; virus.


Conflict of interest statement

Declaration of interests The authors declare no competing interests.

Figures

None
Graphical abstract
Figure 1
Figure 1
Human antiviral host response is conserved during viral infection in macaques and driven by myeloid cells (A) Schematic of macaque sample overview and time point distribution. (B) Distribution of the meta-virus signature (MVS) scores comparing uninfected, healthy macaques to those at peak MVS score by viruses across five viral families. Each point represents a blood sample. Data are displayed as both violin plot and box and whisker plots. The whisker above the box plot extends from upper quartile to the highest value within the 75th percentile + 1.5∗interquartile range. The whisker below the box extends from the lower quartile the the lowest actual value that is within the 25th percentile + 1.5∗interquartile range. Significance values were determined using an unpaired, one-sided Wilcoxon ranked-sum test with Bonferroni correction for multiple hypothesis testing. (C) ROC curves for distinguishing macaques with viral infection at peak MVS time point category from uninfected macaques, colored by the viral family associated with infection (382 samples in 21 datasets). (D–G) Association of MVS scores with the known risk factors of disease severity (D) vaccination status, (E) virus strain, (F) age of host, and (G) live virus across four different datasets from macaques infected with Machupo, influenza or Ebola virus. p value was determined by analysis of covariance (ANCOVA) test accounting for MVS score at pre-infection time point and a risk factor of interest as a covariate of the MVS score post infection. Transparent lines represent the linear connection between MVS scores from each individual macaque’s healthy and infected time point, and the solid lines represent the summary line between healthy and infection MVS scores by group. (H–J) UMAP visualization of 56,929 immune cells from 17 animals colored by (H) cell type, (I) day post infection (DPI), and (J) MVS score. (K) Heatmap representing the average MVS score of each cell type across pre-infection and each day post infection, with values scaled by row. scRNA-seq data of whole blood from rhesus macaques infected with EBOV were collected at day 0 and multiple time points post infection. Asterisk values across figure are represented as follows: p value < 0.05, ∗∗p value < 0.01, ∗∗∗p value < 0.001, and ∗∗∗∗p value < 0.0001. WB, whole blood; PBMC, peripheral blood mononuclear cell; MACV, Machupo virus; EBOV, Ebola virus; IFV, influenza virus.
Figure 2
Figure 2
Longitudinal dynamics of the conserved antiviral response differ between viruses (A and C) MVS scores across all datasets up to 10 days post infection across (A) 1,158 human and (C) 734 NHP challenge samples with time category annotated below with smoothed lines indicating the local regression (LOESS) curve fit by viral family. (B and D) Forrest plot tables of the summary statistics generated for each viral infection in (B) human and (D) NHP challenge dataset by time category. Scores are calculated per sample as the difference between the geometric mean of the 161 overexpressed genes and 235 under-expressed genes in each signature and scaled within each dataset. Asterisk values across figure are represented as follows: p value < 0.05, ∗∗p value < 0.01, ∗∗∗p value < 0.001, and ∗∗∗∗p value < 0.0001. SMD, standardized mean difference.
Figure 3
Figure 3
NHPs demonstrate virus-conserved responses to acute RNA viruses that robustly translate to humans (A) Schematic of experimental design for (B)–(K). (B) Significant DEGs at each time point category by viral family (effect size [ES] FDR < 0.05 and abs(ES) > 0.1). (C) Jaccard similarity index of the signature genes between each signature, where annotation across the diagonal denotes the number of genes present in the signature, and all other annotations are the calculated Jaccard index (left). Jaccard similarity index of the blood transcription modules (BTMs) that contain one or more of the signature genes between each signature where annotation across the diagonal denoting same-score comparison is annotated with the number of BTMs represented by the signature, and all other annotations are the calculated Jaccard index. (D) Circos plot of BTM enrichment analysis across positive signature genes by viral family. Each sector represents a viral family, and each point in all the tracks represents a BTM that was significant in at least one virus (p adj < 0.1). Track 2 is a barplot of the geometric mean of the effect sizes of the genes represented by each BTM that were generated from each virus-specific meta-analysis and plotted where the BTM was significant (p adj < 0.1). Each color in track 3 is a granular annotation for each BTM pathway. The inner track connects the same BTM across viral families if they are both (left) positively or (right) negatively enriched. (E) Summary AUROC generated from the specific score (x axis) across the different viral family dataset subsets (y axis) comparing peak infection time category determined by (B) from healthy control animals. (F) AUROC of human data using the NHP viral response signature (VRS) (n = 3,183). (G) Combined violin and box and whisker plots of NHP VRS by viral severity of the samples from (F). Jonckheere-Terpstra (JT) trend test was used to assess the significance of the trend of the MVS score over severity. (H) Violin plots of NHP VRS by virus and disease of the samples from (G). (I) Spearman’s correlation between the calculated MVS score and the generated NHP VRS. Each dot is a single blood sample from an NHP across all time points collected (743 samples). (J) Spearman’s correlation between the calculated MVS (human) score and the generated VRS (NHP) score. Each dot is a single blood sample from various public human gene expression datasets (n = 638). (K) Comparison of signature-enriched BTM pathways in the overexpressed (UP genes) and under-expressed (DOWN genes) genes in the MVS (human) and VRS (NHP) pathways. Top 5 pathways (ordered by p adj) were chosen per signature’s up and down genes. Asterisk values across figure are represented as follows: p value < 0.05, ∗∗p value < 0.01, ∗∗∗p value < 0.001, and ∗∗∗∗p value < 0.0001.
Figure 4
Figure 4
Macaque-discovered antiviral response is consistent in human acute and chronic but not latent viral infections VRS score in blood samples from healthy control subjects versus patients with (A) adenovirus infection, (B) rotavirus infection, (C) acute or latent EBV infection, (D) acute or latent HCMV infection, (E) HIV infection or HIV co-infection with a respiratory virus (RV), (F) chronic HBV infection, and (G) chronic HCV infection. Data presented as box and whisker plots. Significance values were determined using an unpaired, one-sided Wilcoxon ranked-sum test looking at whether healthy VRS scores are less than comparator group VRS scores. Bonferroni correction for multiple hypothesis testing was applied per subfigure, and significance values were assigned by asterisk. Asterisk values across figure are represented as follows: p value < 0.05, ∗∗p value < 0.01, ∗∗∗p value < 0.001, and ∗∗∗∗p value < 0.0001.
Figure 5
Figure 5
T cell responses differ between viruses in macaque and human viral infection (A) Distribution of the Module 4 scores across macaques, comparing uninfected, healthy macaques to those at peak MVS score by viruses across 5 viral families. Each point represents a blood sample. Significance values were determined using an unpaired Wilcoxon ranked-sum test with Bonferroni correction for multiple hypothesis testing and assigned by asterisk. (B) Comparison of Module 4 scores to VRS scores across time in 4 viral families. (C) Comparison of Module 4 scores to VRS scores across the 4 viral species collected within the Flaviviridae family. (D) Module 4 score to VRS score in human data across 4 viral infections. (E) Module 4 scores by viral severity across CHIKV, EBOV, and SARS-CoV-2 viral infection. p values were computed using JT trend test. Data presented as combined violin and box and whisker plots. (F) Module 4 scores across disease time point and dengue disease type. p values were computed using JT trend test. (G) Expression of Module 4 scores by cell type in 2 scRNA-seq datasets. (H) Differential gene expression analysis of CD8 T cells across scRNA-seq data from COVID-19 and dengue patients between patients with severe disease compared to healthy controls. (I) BTM enrichment analysis of differentially expressed genes from each severe patient compared to the dataset’s healthy patients. Color of p adj value was determined by whether pathway analysis was performed on the upregulated genes (red) or the downregulated genes (blue).

References

    1. Rosenberg R. Detecting the emergence of novel, zoonotic viruses pathogenic to humans. Cell. Mol. Life Sci. 2015;72:1115–1125. - PMC - PubMed
    1. Carrasco-Hernandez R., Jácome R., López Vidal Y., Ponce de León S. Are RNA Viruses Candidate Agents for the Next Global Pandemic? A Review. ILAR J. 2017;58:343–358. - PMC - PubMed
    1. Morens D.M., Fauci A.S. Emerging Pandemic Diseases: How We Got to COVID-19. Cell. 2020;182:1077–1092. - PMC - PubMed
    1. Kilpatrick A.M., Randolph S.E. Drivers, dynamics, and control of emerging vector-borne zoonotic diseases. Lancet. 2012;380:1946–1955. - PMC - PubMed
    1. Domingo E., Holland J.J. RNA VIRUS MUTATIONS AND FITNESS FOR SURVIVAL. Annu. Rev. Microbiol. 1997;51:151–178. - PubMed

Publication types

LinkOut - more resources