. 2024 Feb 2;10(5):eadj6315.
doi: 10.1126/sciadv.adj6315. Epub 2024 Jan 31.

Time-resolved chemical monitoring of whole plant roots with printed electrochemical sensors and machine learning

Affiliations

Time-resolved chemical monitoring of whole plant roots with printed electrochemical sensors and machine learning

Philip Coatsworth et al. Sci Adv. .

Abstract

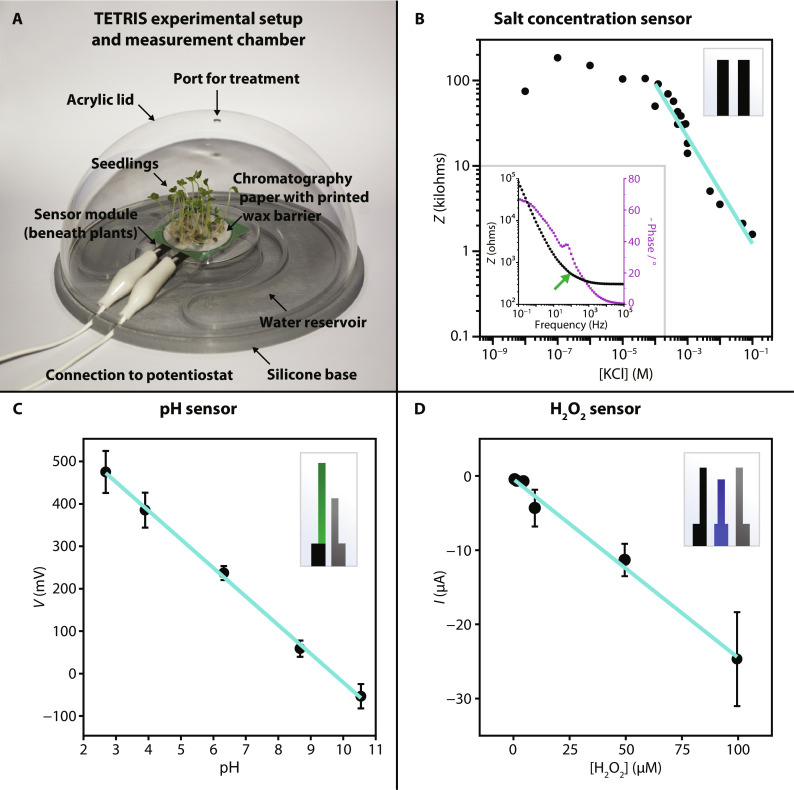
Traditional single-point measurements fail to capture dynamic chemical responses of plants, which are complex, nonequilibrium biological systems. We report TETRIS (time-resolved electrochemical technology for plant root environment in situ chemical sensing), a real-time chemical phenotyping system for continuously monitoring chemical signals in the often-neglected plant root environment. TETRIS consisted of low-cost, highly scalable screen-printed electrochemical sensors for monitoring concentrations of salt, pH, and H2O2 in the root environment of whole plants, where multiplexing allowed for parallel sensing operation. TETRIS was used to measure ion uptake in tomato, kale, and rice and detected differences between nutrient and heavy metal ion uptake. Modulation of ion uptake with ion channel blocker LaCl3 was monitored by TETRIS and machine learning used to predict ion uptake. TETRIS has the potential to overcome the urgent "bottleneck" in high-throughput screening in producing high-yielding plant varieties with improved resistance against stress.


Figures

Fig. 1.
Fig. 1.. Setup of TETRIS.
(A) Schematic of TETRIS, showing sensor fabrication, growth of seedlings, and recording of measurements using a standard laboratory potentiostat. (B) Electrochemical impedance spectroscopy Nyquist plot of a paper disc with 30 kale seedlings (9 days old). (C) H2O2 sensing during the addition of H2O2 (1 mM, 20 μl) to a paper disc with KCl (1 M, 180 μl). (D) pH sensing during the addition of H2SO4 and NaOH to deionized water. (E) Design and materials of our salt concentration, pH, and H2O2 sensors; illustrations not to scale.
Fig. 2.
Fig. 2.. Characterization of TETRIS.
(A) Photograph of TETRIS, where single or multiple sensors can be placed under seedlings grown on paper (kale seedlings pictured). (B) Average impedance response of our salt concentration sensor to various concentrations of KCl at 2 kHz. Solid teal line indicates linear fit of linear range of data. Inset shows the Bode plot of electrochemical impedance spectrum in 0.1 M KCl, where the green arrow shows our chosen frequency of 2 kHz. (C) Calibration curve of pH sensor in 1 M KCl. Error bars show 1 SD (n = 8). (D) Calibration curve of the H2O2 sensor in 1 M KCl. Error bars show 1 SD (100 μM: n = 4; 2 μM: n = 2; 5 to 50 μM: n = 3). Sensor design displayed in the top right corner of each plot (B to D).
Fig. 3.
Fig. 3.. Real-time chemical monitoring of the plant root environment.
(A) Real-time monitoring of H2O2 concentration in the root environment of kale seedlings (green signal, 10 plants, 16 days old) and blank paper control (black signal), with the addition of H2O2 (500 μM, 30 μl) into the paper disc (black arrow). Dashed border inset shows magnified plot. (B) Real-time, simultaneous monitoring of pH (top) and electrical impedance (bottom) of the root environment of kale seedlings (green, purple, and cyan signals; 30 plants; 9 days old) and blank paper control (black signal), with the addition of NaOH solution into the paper disc (black arrows). Data smoothed in OriginPro using a percentile filter (50th percentile, 30 points of window).
Fig. 4.
Fig. 4.. Uptake of ions by kale, tomato, and rice seedlings.
(A) Kale seedlings grown on filter paper were placed onto the impedance sensor within TETRIS, and the electrical impedance was measured in real time. KNO3 (0.1 M, 30 μl) was then added to the filter paper after a rest period of at least 3 hours (arrow). The impedance slowly increased as ions were taken up by the seedlings and the salt concentration in the paper decreased (green signal). This is compared to empty paper substrate (no plants present), where the impedance remained low (black signal), and plants on paper with only water added instead of salt solution, where the impedance remained high (teal signal). Data smoothed in OriginPro using a percentile filter (50th percentile, 100 points of window). (B) An exponential curve of the form c = Btk was plotted between the point of largest salt concentration measured up to where the curve meets the initial baseline concentration, with 5% tolerance. k was found and set as the uptake amount. (C) Effect of number of 9-day-old kale seedlings on relative amount of uptake of constituent ions of KNO3. Error bars indicate 1 SD (n = 3). (D) Effect of age of kale (30 plants) on relative amount of uptake of constituent ions of KNO3. Error bars indicate 1 SD (n = 3). Adding salts to different species: (E) KNO3 (0.1 M, 30 μl) added to 20 tomato Heinz 1350 seedlings on paper (red signal) or empty paper substrate (black signal) and (F) KNO3 (0.1 M, 30 μl) added to eight rice Black Madras seedlings on paper (purple signal) or empty paper substrate (black signal). Data smoothed in OriginPro using a percentile filter (50th percentile, 100 points of window).
Fig. 5.
Fig. 5.. Effect of different salts on normalized rate of uptake.
(A) Rate of uptake of salt from paper disc with 30 kale seedlings (9 days old), relative to control without plants, using TETRIS. (Values at or below 1 are considered to have a net zero or negative ion uptake.) Error bars indicate 1 SD [CdCl2, KCl, and NaCl: n = 3; CaCl2 and Ca(NO3)2: n = 6; LaCl3: n = 7; all others: n = 4]. Statistical analysis showed significant differences between some cation classes (B), but not between anion classes (C), where confidence diamonds show mean uptake, 95% confidence interval and number of data points, and letters show categories with or without significant difference. (D) Pretreatment of 30 kale seedlings (9 days old) with deionized water, NaCl (0.1 M), or LaCl3 (0.1 M) for 4.5 or 24 hours and their effect on the relative change in concentration of Ca(NO3)2. Error bars indicate 1 SD (none: n = 6; LaCl2 24 hours: n = 4; all others: n = 3). (E) Pretreatment of 30 kale seedlings (9 days old) with varying concentrations of LaCl3 for 4 hours and the effect on the relative change in concentration of Ca(NO3)2. Error bars indicate 1 SD (n = 2).
Fig. 6.
Fig. 6.. Using machine learning algorithms to predict normalized rate of uptake (kuptake/kcontrol).
(A) Confusion matrices comparing predicted and experimentally obtained ranges of (kuptake/kcontrol). (B) F1 score (a metric of accuracy combing precision and recall) decreases with increasing number of ranges in the machine learning model.

Similar articles

Cited by

References

    1. Pieruschka R., Schurr U., Plant phenotyping: Past, present, and future. Plant Phenomics 2019, 7507131 (2019). - PMC - PubMed
    1. Felle H. H., Waller F., Molitor A., Kogel K.-H., The mycorrhiza fungus Piriformospora indica induces fast root-surface pH signaling and primes systemic alkalinization of the leaf apoplast upon powdery mildew infection. Mol. Plant Microbe Interact. 22, 1179–1185 (2009). - PubMed
    1. Xu Z., Zhou G., Shimizu H., Plant responses to drought and rewatering. Plant Signal. Behav. 5, 649–654 (2010). - PMC - PubMed
    1. Sirault X. R. R., James R. A., Furbank R. T., A new screening method for osmotic component of salinity tolerance in cereals using infrared thermography. Funct. Plant Biol. 36, 970–977 (2009). - PubMed
    1. Fujimaki S., Maruyama T., Suzui N., Kawachi N., Miwa E., Higuchi K., Base to tip and long-distance transport of sodium in the root of common reed [Phragmites australis (Cav.) Trin. ex Steud.] at steady state under constant high-salt conditions. Plant Cell Physiol. 56, 943–950 (2015). - PubMed

Publication types