. 2024 Feb 2;10(5):eadg7887.
doi: 10.1126/sciadv.adg7887. Epub 2024 Jan 31.

Targeting prostate tumor low-molecular weight tyrosine phosphatase for oxidation-sensitizing therapy

Affiliations

Targeting prostate tumor low-molecular weight tyrosine phosphatase for oxidation-sensitizing therapy

Stephanie M Stanford et al. Sci Adv. .

Abstract

Protein tyrosine phosphatases (PTPs) play major roles in cancer and are emerging as therapeutic targets. Recent reports suggest low-molecular weight PTP (LMPTP)-encoded by the ACP1 gene-is overexpressed in prostate tumors. We found ACP1 up-regulated in human prostate tumors and ACP1 expression inversely correlated with overall survival. Using CRISPR-Cas9-generated LMPTP knockout C4-2B and MyC-CaP cells, we identified LMPTP as a critical promoter of prostate cancer (PCa) growth and bone metastasis. Through metabolomics, we found that LMPTP promotes PCa cell glutathione synthesis by dephosphorylating glutathione synthetase on inhibitory Tyr270. PCa cells lacking LMPTP showed reduced glutathione, enhanced activation of eukaryotic initiation factor 2-mediated stress response, and enhanced reactive oxygen species after exposure to taxane drugs. LMPTP inhibition slowed primary and bone metastatic prostate tumor growth in mice. These findings reveal a role for LMPTP as a critical promoter of PCa growth and metastasis and validate LMPTP inhibition as a therapeutic strategy for treating PCa through sensitization to oxidative stress.


Figures

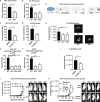
Fig. 1.
Fig. 1.. ACP1 is up-regulated in prostate tumors and correlates negatively with patient survival.
(A to C) ACP1 expression in PRAD from TCGA, processed through UALCAN. ACP1 mRNA in normal and primary prostate tumor tissue. Expression was subclassified by (B) Gleason score and (C) metastasis status (N0 = no lymph node metastasis; N1 = metastases in one to three lymph nodes). Boxes: median, lower, and upper quartiles; whiskers: range of minimum to maximum. Significance reported in UALCAN: *P < 0.05, **P < 0.01, and ***P < 0.001, t test. (D) ACP1 mRNA in PCa patient samples from the Caris Life Sciences cohort stratified by primary (prostate, P), lymph node (LN), and metastatic (Met) biopsy sites. TPM, transcripts per million. Boxes: median, lower, and upper quartiles; whiskers: range of minimum to maximum, excluding statistical outliers (1.5× the inner quartile range). ****P < 0.0001, Mann-Whitney U test. (E and F) ACP1 mRNA assessed by qPCR (E) and LMPTP protein assessed by Western blotting (WB) using mouse anti-LMPTP antibody (F) from five paired tumor/nontumor PCBN prostatectomy samples with Gleason score 8/9. Means ± SEM expression relative to POLR2A (E) or glyceraldehyde 3-phosphate dehydrogenase (GAPDH) (F) is shown. Representative blots (F). *P < 0.05 and **P < 0.01, paired t test. (G) Survival probability of patients with low/medium or high (upper quartile) ACP1 expression from TCGA. Significance was reported in UALCAN using log-rank test. (H) Overall patient survival measured from time of tumor biopsy for samples with low or high ACP1 (<25th and >75th percentiles of overall cohort) from Caris Life Sciences cohort. Survival curves were compared using log-rank test and hazard ratios (HRs) with 95% confidence interval (CI) estimated by Cox proportional hazards model. mOS, median overall survival; d, days. (I) Survival probability of T3 stage patients with low/medium or high (upper tercile) ACP1 expression from TCGA, processed through UCSC Xena. Ticks denote last known survival status. Significance calculated by log-rank test.
Fig. 2.
Fig. 2.. Loss of LMPTP impairs PCa cell growth.
(A and B) WT and LMPTP KO MyC-CaP (A) and C4-2B (B) cells were plated and allowed to grow. After 5 days, cells were fixed and stained with crystal violet. Stain was extracted and quantified by absorbance at 590 nM. Mean ± SEM proliferation relative to WT samples (MyC-CaP: n = 5 per WT and n = 4 per KO line; C4-2B: n = 5 per WT/KO line) is shown. (C to H) SCID mice were injected subcutaneously with MyC-CaP or C4-2B cells suspended in Matrigel. (C) and (G) Tumor volumes of mice inoculated with WT or LMPTP KO MyC-CaP (C) or C4-2B (G) cells were measured with a caliper at the indicated time points. Mean ± SEM tumor volume is shown. (D) and (H) Kaplan-Meier survival plot of mice from [(C) and (G)]. The experimental endpoint was determined when tumors reached 1.5–2 cm long. Significance was determined using the log-rank test. (E) to (F) 14 days after inoculation with WT MyC-CaP cells, mice were placed on regular chow or chow formulated with 0.1% (w/w) LMPTP inhibitor Compd. 23 (black arrow indicates start of treatment). (E) Mean ± SEM tumor volume is shown. (F) Mean ± SEM mouse body weight is shown. *P < 0.05, **P < 0.01, ***P < 0.001, and ****P < 0.0001, one-way analysis of variance (ANOVA) with Dunnett’s correction (A and B) and two-way ANOVA [(C), (E), and (G)].
Fig. 3.
Fig. 3.. LMPTP KO impairs metastatic features of PCa.
(A and B) WT or LMPTP KO MyC-CaP (A) and C4-2B (B) cell invasion through Matrigel-coated transwells. Mean ± SEM number of invaded cells/frame from four (A) or six (B) independent experiments with three transwells each. (C and D) MyC-CaP (C) and C4-2B (D) cell invasion as in (A) and (B) in the presence of 10 μM LMPTP inhibitor Compd. 23 or dimethyl sulfoxide (DMSO). Mean ± SEM number of invaded cells/frame from four independent experiments with three transwells each. (E and F) Colony formation of WT or LMPTP KO MyC-CaP (E) and C4-2B (F) colonies 21 days after seeding on noble agar. Mean ± SEM number of colonies formed/frame (MyC-CaP: n = 4/line; C4-2B: n = 4 for WT/KO1; n = 3 for KO2). (G) Schematic of the BME assay. Human mesenchymal stem cells (hMSCs) were seeded on polycaprolactone (PCL) scaffolds and maintained in osteogenic medium. (H) WT and LMPTP KO C4-2B were seeded on the BME as spheroids and monitored by confocal microscopy 10 days after seeding. Left: Mean ± SEM spheroid size measured by fluorescence intensity. Right: Representative spheroids. Bar, 500 μm. (I) Size of C4-2B spheroids grown in the presence of 10 μM Compd. 23 or DMSO as assessed by confocal microscopy 10 days after seeding on the BME. (J and K) Bone tumor growth assay. Luciferase-expressing MyC-CaP were injected into SCID mice tibias. Tumors were monitored for 10 weeks by luminescence imaging. Left: Mean ± SEM luminescent intensity. Right: Representative images. (J) WT and LMPTP KO MyC-CaP. (K) Mice were administered 0.1% (w/w) Compd. 23 in chow or chow alone. *P < 0.05, **P < 0.01, and ****P < 0.0001, Mann-Whitney U test [(A), (C), (D), and (I)], one-way ANOVA with Dunnett’s correction [(B), (E), (F), and (H)], and two-way ANOVA [(J) and (K)]. rlu, relative light unit.
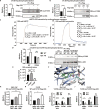
Fig. 4.
Fig. 4.. LMPTP is a key promoter of glutathione synthesis in PCa cells.
(A to D and F and G) WT and LMPTP KO MyC-CaP [(A), (C), and (F)] and C4-2B [(B), (D), and (G)] cells (five biological replicates per cell clone) were grown overnight, collected, and metabolomes were analyzed by UHPLC-MS. (A) and (B) PCA (PC1 versus PC2) of WT and LMPTP KO MyC-CaP (A) and C4-2B (B) cell metabolomes. (C and D) Volcano plot comparison of features from metabolomic analyses between WT and LMPTP KO MyC-CaP (C) and C4-2B (D) cells. Fold change cutoff, 1.5; q value (false discovery rate corrected P value) cutoff, less than 0.05. (E) Scheme of glutathione synthesis pathway. Arrows indicate metabolites increased (green upward arrow) or decreased (red downward arrow) in LMPTP KO cells. (F and G) Intracellular metabolite levels of WT and LMPTP KO MyC-CaP (F) and C4-2B (G) cells within the glutathione synthesis pathway. Mean ± SEM metabolite intensity is shown. (H to K) Intracellular concentrations of glutathione in WT and LMPTP KO MyC-CaP [(H) and (J)] and C4-2B [(I) and (K)] cells were detected using a bioluminescent glutathione detection assay. Mean ± SEM concentrations of total glutathione [(H) and (I)] and oxidized glutathione (GSSG) [(J) and (K)] from four independent experiments are shown. *P < 0.05 and **P < 0.01, Mann-Whitney test [(F) to (K)].
Fig. 5.
Fig. 5.. LMPTP blocks GSS activity via dephosphorylation on Tyr270.
(A, B, and D) Western blot of α-Flag immunoprecipitations. Mean ± SEM pY1000/GSS relative signaling intensity from four independent experiments plus representative blots is shown. (A) C4-2B transfected with Flag-GSS and stimulated with 200 μM pervanadate (PV) or left unstimulated. (B) WT or LMPTP KO C4-2B transfected with Flag-GSS. (C) SPR sensograms. Kinetics data for GSS binding to LMPTP (left) and unrelated DNA-binding HMG-box protein (right). Blue and orange curves show analyte response curve and model fit, respectively. (D) WT or LMPTP KO C4-2B transfected with WT or Y270F Flag-GSS. (E) In vitro GSS enzymatic activity assay (WT: n = 6; Y270E: n = 3; Y270F: n = 3). (F) Glutathione binding site in the structure of unliganded GSS in ribbon representation (blue) with superposed 2HGS (gray). ADP (green), sulfate (pink), glutathione (cyan), Mg2+ ions (yellow), and Tyr270 side chain (brown) from 2HGS are shown as well as sulfate ions in the current structure (yellow/red). Red asterisks denote two loops partially disordered in the unliganded structure. Molecular graphics were performed with UCSF Chimera (67). (G to J) Glutathione levels detected from four independent experiments as in Fig. 4 (H to K). (G) and (H) MyC-CaP (G) or C4-2B (H) transfected with WT or Y270F Flag-GSS. Mean ± SEM relative concentrations of glutathione. (I) and (J) WT or LMPTP KO MyC-CaP (I) or C4-2B (J) transfected with Y270E or Y270F Flag-GSS. Mean ± SEM concentrations of glutathione. ns, nonsignificant. *P < 0.05, **P < 0.01, and ***P < 0.001, Mann-Whitney U test [(A) and (B)], unpaired t test with Welch’s correction (D), one-way ANOVA with Tukey’s method [(E), (G), and (H)], and one-way ANOVA with Šidák method [(I) and (J)]. IP, immunoprecipitation.
Fig. 6.
Fig. 6.. Exogenous GSH abolishes the differences in growth and invasion between WT and LMPTP KO PCa cells.
(A and B) Growth assays of WT and LMPTP KO MyC-CaP (A) and C4-2B (B) cells performed as in Fig. 2 (A and B) in the presence or absence of GSH-MEE or vehicle. (C and D) Invasion assays of WT and LMPTP KO MyC-CaP (C) and C4-2B (D) cells performed as in Fig. 3 (A and B) in the presence of GSH-MEE or vehicle. (A) to (D) Mean ± SEM proliferation [(A) and (B)] or invasion [(C) and (D)] relative to the WT cells for each condition from four independent experiments is shown. ns, nonsignificant. *P < 0.05, Mann-Whitney U test.
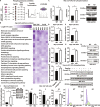
Fig. 7.
Fig. 7.. Loss of LMPTP promotes PCa cell eIF2 signaling.
(A and B) WT and LMPTP KO MyC-CaP and C4-2B cells were grown overnight and lysed in 9 M urea, reduced, alkylated, and digested, and samples were passed through an FeNTA column. Samples were tandem mass tag (TMT) labeled–pooled and analyzed by LC-MS/MS. (A) Scheme of phosphoproteomics workflow. (B) Pathway analysis using Core Analysis in Ingenuity Pathway Analysis (IPA) platform of phosphoproteins displaying log2(KO/WT) signal ratio > |0.59| and P < 0.05. Pathways were ranked according to −log10(P value). Top 25 canonical pathways are shown. (C) Eukaryotic initiation factor 2 (eIF2)-Ser51 phosphorylation assessed in WT and LMPTP KO MyC-CaP cells via WB after 2-hour serum starvation. Left: Mean ± SEM ratio of peIF2/eIF2 and peIF2/GAPDH signaling intensity relative to the WT sample. (Right) Representative blots. (D to H) Atf4 [(D) and (F)] and Nrf2 [(E) and (G)] expression levels assessed in MyC-CaP cells after 4-hour serum starvation. (D) and (E) Mean ± SEM mRNA expression assessed by qPCR and normalized to POLR2A. (F) and (G) Mean ± SEM protein expression assessed by WB and normalized to GAPDH. (H) Representative blots. (I) eIF2-Ser51 phosphorylation assessed in tumors of mice treated with Compd. 23 or regular chow (mice from Fig. 2E; one tumor was removed as an outlier following the Grubbs test). Left: Mean ± SEM ratio of peIF2/eIF2 signaling intensity. Right: peIF2-Ser51, eIF2, and β-actin blots. (J) H2A histone family member X (H2AX)–Ser139 phosphorylation assessed in WT and LMPTP KO MyC-CaP cells via WB following overnight serum starvation. Left: Mean ± SEM ratio of pH2AX-Ser139/H2AX signaling intensity. Right: Representative blots. (K) Cell cycle phases of WT and LMPTP KO MyC-CaP cells were determined by flow cytometry following propidium iodide staining. Left: % cells in G0-G1, S, or G2-M phase. Right: Representative histograms fit with Dean-Jett-Fox model. *P < 0.05, Mann-Whitney U test [(C) to (G) and (J) and (K)], and unpaired t test (I). (C) to (G) and (J) and (K) Data are from four independent experiments.
Fig. 8.
Fig. 8.. Loss of LMPTP activity sensitizes PCa cells to taxane drugs.
(A) WT or LMPTP KO MyC-CaP cells were treated with 2.5 nM docetaxel (DTX) or 1.5 nM cabazitaxel (CBZ) or DMSO for 4 hours. ROS detection was performed using a fluorescent ROS detection assay. (B to E) WT or LMPTP KO MyC-CaP [(B) and (D)] or C4-2B [(C) and (E)] cells were plated and allowed to grow. After 3 days, cells were treated with varying concentrations of docetaxel [(B) and (C)] or cabazitaxel [(D) and (E)]. Growth was quantified on day 5 as described in Fig. 2 (A and B). *P < 0.05 and **P < 0.01, two-way ANOVA.
Fig. 9.
Fig. 9.. Scheme of proposed mechanism.
Proposed model by which LMPTP supports PCa cell glutathione production by dephosphorylating GSS on inhibitory phosphorylation site Tyr270. Dephosphorylation of this site by LMPTP enhances GSS catalytic activity and glutathione production, enabling PCa cell survival, growth, and invasiveness by reducing cellular oxidative stress.

References

    1. Karantanos T., Corn P. G., Thompson T. C., Prostate cancer progression after androgen deprivation therapy: Mechanisms of castrate resistance and novel therapeutic approaches. Oncogene 32, 5501–5511 (2013). - PMC - PubMed
    1. Siegel R. L., Miller K. D., Jemal A., Cancer statistics, 2019. CA Cancer J. Clin. 69, 7–34 (2019). - PubMed
    1. Pignot G., Maillet D., Gross E., Barthelemy P., Beauval J.-B., Constans-Schlurmann F., Loriot Y., Ploussard G., Sargos P., Timsit M.-O., Vincendeau S., Pasticier G., Borchiellini D., Systemic treatments for high-risk localized prostate cancer. Nat. Rev. Urol. 15, 498–510 (2018). - PubMed
    1. Oster G., Lamerato L., Glass A. G., Richert-Boe K. E., Lopez A., Chung K., Richhariya A., Dodge T., Wolff G. G., Balakumaran A., Edelsberg J., Natural history of skeletal-related events in patients with breast, lung, or prostate cancer and metastases to bone: A 15-year study in two large US health systems. Support. Care Cancer 21, 3279–3286 (2013). - PubMed
    1. Logothetis C., Morris M. J., Den R., Coleman R. E., Current perspectives on bone metastases in castrate-resistant prostate cancer. Cancer Metastasis Rev. 37, 189–196 (2018). - PMC - PubMed

Publication types