. 2024 Feb 2;10(5):eadj9479.
doi: 10.1126/sciadv.adj9479. Epub 2024 Jan 31.

Folate depletion induces erythroid differentiation through perturbation of de novo purine synthesis

Affiliations

Folate depletion induces erythroid differentiation through perturbation of de novo purine synthesis

Adam G Maynard et al. Sci Adv. .

Abstract

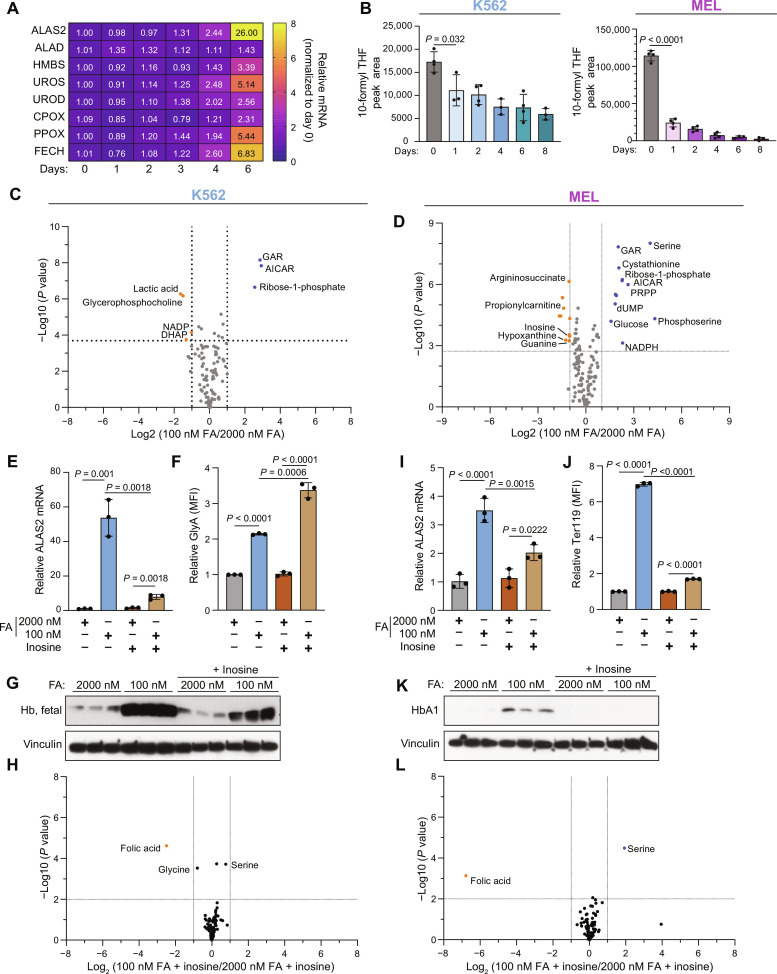
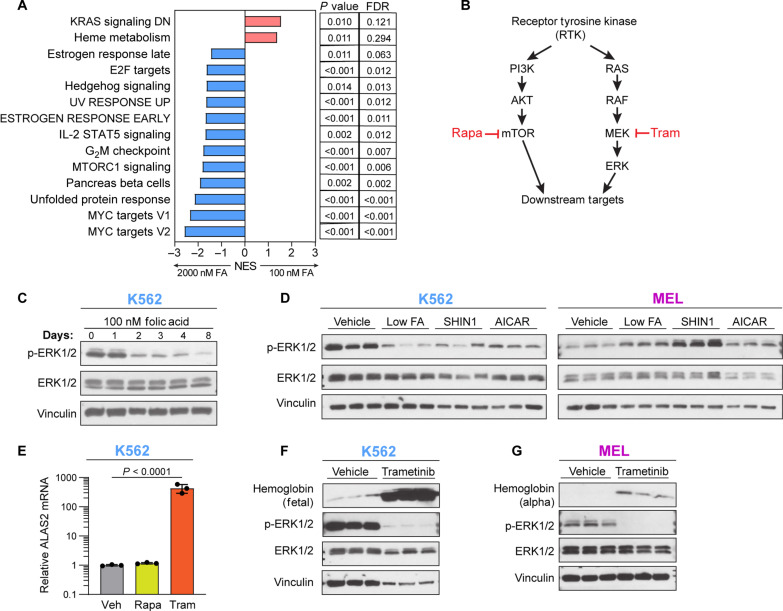
Folate, an essential vitamin, is a one-carbon acceptor and donor in key metabolic reactions. Erythroid cells harbor a unique sensitivity to folate deprivation, as revealed by the primary pathological manifestation of nutritional folate deprivation: megaloblastic anemia. To study this metabolic sensitivity, we applied mild folate depletion to human and mouse erythroid cell lines and primary murine erythroid progenitors. We show that folate depletion induces early blockade of purine synthesis and accumulation of the purine synthesis intermediate and signaling molecule, 5'-phosphoribosyl-5-aminoimidazole-4-carboxamide (AICAR), followed by enhanced heme metabolism, hemoglobin synthesis, and erythroid differentiation. This is phenocopied by inhibition of folate metabolism using the inhibitor SHIN1, and by AICAR supplementation. Mechanistically, the metabolically driven differentiation is independent of mechanistic target of rapamycin complex 1 (mTORC1) and adenosine 5'-monophosphate-activated protein kinase (AMPK) and is instead mediated by protein kinase C. Our findings suggest that folate deprivation-induced premature differentiation of erythroid progenitor cells is a molecular etiology to folate deficiency-induced anemia.


Figures

Fig. 1.
Fig. 1.. Folate depletion induces differentiation in erythroid cancer cell lines.
(A) Experimental timeline (bottom) and proliferation (top) of K562 cultured for 6 days in folate-free RPMI supplemented with 2000 or 100 nM FA. (B) Simplified schematic of de novo purine synthesis. (C) Volcano plot depicting day 6 metabolic changes between K562 cells cultured in 2000 and 100 nM FA. PRPP, phosphoribosyl diphosphate; dTMP, deoxythymidine monophosphate. (D) Schematic of the human heme biosynthesis pathway. (E) Reverse transcription quantitative polymerase chain reaction (RT-qPCR) analysis of heme biosynthesis genes in 2000 nM or 100 nM FA. (F) RT-qPCR analysis of ALAS2 in the indicated cell lines following 6 days culture in 2000 or 100 nM FA. (G) Western blot analysis of hemoglobin (Hb) A1 and fetal expression in K562 over 8 days in 100 nM FA. (H) Cell surface GlyA levels in K562 measured by flow cytometry. MFI, mean fluorescence intensity. (I) Western blot analysis of hemoglobin A1 in MEL. (J) Cell surface Ter119 levels in MEL as measured by flow cytometry. (K) Western blot analysis of hemoglobin A1 in HEL. (L) Cell surface GlyA levels in HEL as measured by flow cytometry. All data shown are means (±SD) of three biological replicates except (E) n = 3 to 4 and (F) n = 2 to 3 (K562 and MEL).
Fig. 2.
Fig. 2.. Purine synthesis is disrupted rapidly following folate deprivation, and this disruption is essential for folate deprivation–induced differentiation.
(A) RT-qPCR analysis of heme synthesis mRNA expression in K562 over 6 days in 100 nM FA. (B) Total 10-formyl THF in K562 (left) and MEL (right), as measured by liquid chromatography–mass spectrometry (LC-MS). (C and D) Volcano plots depicting the metabolic changes between 2000 and 100 nM FA at day 2 in K562 (C) and MEL (D). DHAP, dihydroxyacetone phosphate; dUMP, deoxyuridine monophosphate. (E) RT-qPCR analysis of ALAS2 mRNA levels in K562 following 6 days in 2000 or 100 nM FA, with or without inosine (100 μM) supplementation. (F) Cell surface GlyA in K562 following 6 days in 2000 or 100 nM FA with or without inosine (100 μM) supplementation as measured by flow cytometry. (G) Western blot analysis of hemoglobin levels following 6 days in 2000 or 100 nM FA with or without inosine supplementation (100 μM). (H) Metabolic changes in K562 cultured in inosine supplemented with 100 nM versus 2000 nM FA medium. (I) RT-qPCR analysis of Alas2 mRNA levels in MEL following 6 days in 2000 or 100 nM FA, with or without inosine (100 μM) supplementation. (J) Cell surface Ter119 in MEL following 6 days in 2000 or 100 nM FA with or without inosine (100 μM) supplementation as measured by flow cytometry. (K) Western blot analysis of hemoglobin levels following 6 days in 2000 or 100 nM FA with or without inosine supplementation (100 μM). (L) Metabolic changes in MEL cultured in inosine supplemented with 100 nM versus 2000 nM FA medium. All data shown are means (±SD) of three biological replicates except (B) K562 (n = 3 to 4) and MEL (n = 4).
Fig. 3.
Fig. 3.. 1C metabolism inhibition and AICAR supplementation induce erythroid differentiation.
(A and B) AICAR peak area in (A) K562 and (B) MEL following 8 days in 100 nM FA as measured by LC-MS. (C) Schematic depicting the target of SHMT inhibitor, SHIN1. (D and E) Cell proliferation of (D) K562 and (E) MEL over 6 days following treatment with vehicle, 100 nM FA, SHIN1 (1.25 μM), or AICAR (500 nM). (F and G) Intracellular AICAR levels in (F) K562 and (G) MEL following 2-day treatment with vehicle, 100 nM FA, SHIN1 (1.25 μM), or AICAR (500 nM) as measured by LC-MS. (H) Induction of differentiation, as measured by GlyA expression in K562 following 6-day treatment with vehicle, 100 nM FA, SHIN1 (1.25 μM), or AICAR (500 nM). (I) Induction of differentiation, as measured by Ter119 expression in MEL following 6-day treatment with vehicle, 100 nM FA, SHIN1 (1.25 μM), or AICAR (500 nM). All data shown are means (±SD) of three biological replicates except [(A) and (B)] n = 4.
Fig. 4.
Fig. 4.. Folate depletion and 1C metabolism inhibition induce alterations to RAS signaling.
(A) GSEA using hallmark gene sets on K562 cells in 100 or 2000 nM FA. UV, ultraviolet; IL-2, interleukin-2; STAT5, signal transducers and activators of transcription 5; FDR, false discovery rate; NES, normalized enrichment score. DN, down. (B) Simplified schematic of RAS signaling with two inhibitors, trametinib (tram) and rapamycin (Rapa). PI3K, phosphatidylinositol 3-kinase. (C) RAS signaling activity over 8 days in 100 nM FA in K562, as determined by phosphorylation of extracellular signal–regulated kinase 1/2 (ERK1/2). (D) RAS pathway activity in K562 and MEL following 4-day treatment with 100 nM FA, SHIN1 (1.25 μM), or AICAR (500 nM). (E) RT-qPCR analysis of K562 ALAS2 mRNA expression following 4-day treatment with rapamycin (100 nM) or trametinib (30 nM). (F and G) Western blotting of RAS activity and hemoglobin expression following 4-day treatment with trametinib (30 nM). All data shown are means (±SD) of three biological replicates.
Fig. 5.
Fig. 5.. AMPK is not necessary, nor sufficient, to induce erythroid differentiation.
(A and B) Western blot analysis of AMPK signaling in K562 (A) and MEL (B) over 8-day culture in 100 nM FA as determined by phosphorylation of ACC and ULK1. (C and D) Western blot analysis of AMPK signaling and hemoglobin expression in (C) K562 and (D) MEL following 6-day treatment with vehicle, 100 nM FA, SHIN1 (1.25 μM), or AICAR (500 nM). (E and F) Cell surface GlyA or Ter119 expression as measured by flow cytometry in (E) K562 and (F) MEL following treatment with the AMPK agonist, GSK126 (10 μM). (G) RT-qPCR analysis of ALAS2 mRNA expression in AMPKa1/a2 wild-type (WT) and DKO K562 cells cultured in 2000 or 100 nM FA for 6 days. (H to K) Comparison of the fold change of 100 nM/2000 nM FA versus SHIN1/vehicle [(H) and (J)] and AICAR/vehicle versus 100 nM/2000 nM [(I) and (K)], in K562 (I) and MEL [(J) and (K)]. UDP, uridine 5′-diphosphate; GlcNAc, N-acetylglucosamine; ns, not significant. All data shown are means (±SD) of three biological replicates.
Fig. 6.
Fig. 6.. PKC activation is necessary for inducing erythroid differentiation.
(A) RT-qPCR analysis of ALAS2 mRNA expression and surface GlyA following 6-day treatment with low FA, SHIN1, or AICAR, in combination with the PKC inhibitor, GFX (5 μM) in K562. (B) RT-qPCR analysis of Alas2 mRNA expression and surface Ter119 following 6-day treatment with low FA, SHIN1, or AICAR, in combination with GFX in MEL. (C) Western blot analysis of PKC signaling in K562 cells treated with low FA, SHIN1 (1.25 μM), or AICAR (500 nM) treatment plus PKC inhibition with GFX (5uM) for 4 days. (D and E) Selected metabolite abundance following 6-day culture of (D) K562 or (E) MEL in 2000 or 100 nM FA plus GFX (5 μM). (F) Western blot analysis of hemoglobin as treated in (D) and (E). All data shown are means (±SD) of three biological replicates except [(D) and (E)] n = 4.
Fig. 7.
Fig. 7.. Folate deprivation induces differentiation in murine primary erythroid progenitor cells.
(A) Schematic representing murine fetal erythropoiesis from a population of BFU-E and CFU-E progenitor cells isolated from E14.5 fetal livers. HSC, hematopoietic stem cell; RBC, red blood cell. (B) Cell surface Ter119 levels on erythroid progenitor cells following 4-day treatment with vehicle, SHIN1 (1.25 μM), inosine (100 μM), or SHIN1 + inosine. (C) Cell surface TFRC levels on erythroid progenitor cells following 4-day treatment with vehicle, SHIN1, inosine, or SHIN1 + inosine. (D) Flow cytometry quadrant analysis of Ter119 and TFRC expression following 4-day treatment with vehicle, SHIN1, inosine, or SHIN1 + inosine. (E) Representative flow cytometry plots from quantification in (D). (F) RT-qPCR analysis of Alas2 mRNA expression in murine primary erythroid progenitor cells treated for 4 days with SHIN1, inosine, or SHIN1 + inosine. (G) Metabolic changes of vehicle- or SHIN1-treated (2 days) murine primary erythroid progenitor cells. (H) Metabolic changes of vehicle- or SHIN1-treated (2 days) murine primary erythroid progenitor cells supplemented with inosine. (I) PCA analysis of metabolite profiling data from murine primary erythroid progenitor cells with and without SHIN1 treatment and inosine supplementation. (I) Metabolic changes of vehicle- or SHIN1-treated (2 days) murine primary erythroid progenitor cells. (J) Ter119- and TFRC-positive erythroid progenitor cells following 4-day culture in vehicle, SHIN1, GFX (5 μM), or SHIN1 + GFX. Progenitor cells were cultured in SFEM II expansion medium. All data shown are means (±SD) of three biological replicates.
Fig. 8.
Fig. 8.. Model of folate depletion induced differentiation.
Normal erythropoiesis involves commitment and expansion of hematopoietic stem cells into the erythroid lineage. Late expansion of erythroid progenitors is followed by terminal differentiation into red blood cells (top). Following folate depletion, we observe a premature induction of differentiation of erythroid lineage cells and an inhibition of expansion. Premature differentiation can deplete the erythroid progenitor population by preventing expansion and inducing differentiation (bottom). These findings subsequently recapitulate the clinical observations of folate deficiency included megaloblastic anemia.

References

    1. Hitchings G. H., Burchall J. J., Inhibition of folate biosynthesis and function as a basis for chemotherapy. Adv. Enzymol. Relat. Areas Mol. Biol. 27, 417–468 (1965). - PubMed
    1. Crider K. S., Yang T. P., Berry R. J., Bailey L. B., Folate and DNA methylation: A review of molecular mechanisms and the evidence for folate’s role. Adv. Nutr. 3, 21–38 (2012). - PMC - PubMed
    1. De Santis M. C., Porporato P. E., Martini M., Morandi A., Signaling pathways regulating redox balance in cancer metabolism. Front. Oncol. 8, 126 (2018). - PMC - PubMed
    1. Ducker G. S., Rabinowitz J. D., One-carbon metabolism in health and disease. Cell Metab. 25, 27–42 (2017). - PMC - PubMed
    1. Wilkinson J. F., Israels M. C., Fletcher F., Folic acid in the treatment of pernicious anaemia. Lancet 2, 156–158 (1946). - PubMed

Publication types