. 2024 Jan 31;16(732):eadg7895.
doi: 10.1126/scitranslmed.adg7895. Epub 2024 Jan 31.

Myeloid and lymphoid expression of C9orf72 regulates IL-17A signaling in mice

Affiliations

Myeloid and lymphoid expression of C9orf72 regulates IL-17A signaling in mice

Francesco Limone et al. Sci Transl Med. .

Abstract

A mutation in C9ORF72 is the most common cause of amyotrophic lateral sclerosis (ALS) and frontotemporal dementia (FTD). Patients with ALS or FTD often develop autoimmunity and inflammation that precedes or coincides with the onset of neurological symptoms, but the underlying mechanisms are poorly understood. Here, we knocked out murine C9orf72 in seven hematopoietic progenitor compartments by conditional mutagenesis and found that myeloid lineage C9orf72 prevents splenomegaly, loss of tolerance, and premature mortality. Furthermore, we demonstrated that C9orf72 plays a role in lymphoid cells to prevent interleukin-17A (IL-17A) production and neutrophilia. Mass cytometry identified early and sustained elevation of the costimulatory molecule CD80 expressed on C9orf72-deficient mouse macrophages, monocytes, and microglia. Enrichment of CD80 was similarly observed in human spinal cord microglia from patients with C9ORF72-mediated ALS compared with non-ALS controls. Single-cell RNA sequencing of murine spinal cord, brain cortex, and spleen demonstrated coordinated induction of gene modules related to antigen processing and presentation and antiviral immunity in C9orf72-deficient endothelial cells, microglia, and macrophages. Mechanistically, C9ORF72 repressed the trafficking of CD80 to the cell surface in response to Toll-like receptor agonists, interferon-γ, and IL-17A. Deletion of Il17a in C9orf72-deficient mice prevented CD80 enrichment in the spinal cord, reduced neutrophilia, and reduced gut T helper type 17 cells. Last, systemic delivery of an IL-17A neutralizing antibody augmented motor performance and suppressed neuroinflammation in C9orf72-deficient mice. Altogether, we show that C9orf72 orchestrates myeloid costimulatory potency and provide support for IL-17A as a therapeutic target for neuroinflammation associated with ALS or FTD.


Conflict of interest statement

Competing interests: K.E. is a founder of Q-State Biosciences, QurAlis, and EnClear Therapies, and is employed at BioMarin Pharmaceutical. G.G. and I.K. are employed at UCB Biopharma SPRL. J.K. is a former employee of UCB Biopharma SPRL and is currently employed at F. Hoffmann-LaRoche. J.Y.W. is currently affiliated with STEMCELL Technologies Inc. AG. A.B and K.E. are authors on a pending patent that describes methods for suppressing inflammation induced by gut microbes (WO/2021/231804). All other authors declare they have no conflict of interest.

Figures

Fig. 1.
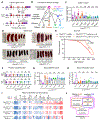
Fig. 1.. C9orf72 in myeloid and lymphoid lineages opposes autoimmunity and IL-17A production.
(A) C9orf72 gene locus schematic and conditional mutagenesis strategy. Wt: C9orf72 endogenous allele; 2Lox (2L): LoxP sites flanking exon 4-5; Δ: Cre-recombined allele with premature stop codon. (B) Hematopoietic stem and progenitor populations targeted for Cre recombination (Vav1: hematopoietic; Mx1: myeloid & lymphoid; LysM: myeloid; CD2: lymphoid; CD4: CD4+ and CD8+ T cells; CD19: B cells; Foxp3: Treg cells). (C) Spleen weight of the following genotypes: 5-month-old Vav1-Cre− (n=7 per group) or Vav1-Cre+ (n=6 per group); 4-month-post-poly(I:C) Mx1-Cre− (n=10 per group) or Mx1-Cre+ (n=9 per group); 9-month-old LysM-Cre− (n=10 per group) or LysM-Cre+ (n=10 per group); 12-month-old CD2-Cre− (n=6 per group) or CD2-Cre+ (n=5 per group); 11-month-old, CD19-Cre− (n=8 per group) or CD19-Cre+ (n=8 per group); 15-month-old, CD4-Cre− (n=8 per group), CD4-Cre+ (n=5 per group); 11-month-old, Foxp3-Cre− (n=10 per group), Foxp3-Cre+ (n=8 per group); Each dot represents one mouse (Cre− controls filled, Cre+ open); data were analyzed by unpaired Student’s t-test (Vav1, LysM, CD2, CD4, Foxp3) or Mann-Whitney test (Mx1, CD19) between Cre+ and Cre− mice within each strain. (D) Spleens from mice with conditional deletion of C9orf72 in the indicated lineages. (E) Survival of mice reared at Harvard University facility during the same two-year period. Animals that met pre-defined euthanasia criteria were considered a lethal event. C9orf72+/+ and C9orf72−/− mice euthanized for reasons unrelated to the pre-defined criteria were censored at time of euthanasia; data were analyzed by Gehan-Breslow-Wilcoxon test. (F to I) Peripheral blood analysis of male and female mice evaluated in the following animals: 5-month-old Vav1-Cre− (n=4-9 per group) or Vav1-Cre+ (n=6-11 per group); 4-month post-poly(I:C) Mx1-Cre− or Mx1-Cre+ (n=9 per group); 9-month-old LysM-Cre− (n=6-9 per group) or LysM-Cre+ (n=7-15 per group); 12-month-old CD2-Cre− (n=5-8 per group) or CD2-Cre+ (n=4-10 per group); 11-month-old, CD19-Cre− (n=8-11 per group) or CD19-Cre+ (n=6-8 per group); 15-month-old, CD4-Cre− (n=8 per group), CD4-Cre+ (n=5 per group); 11-month-old, Foxp3-Cre− (n=4-10 per group), Foxp3-Cre+ (n=3-8 per group). Cre− (filled dot) and Cre+ (unfilled dot) mice are shown for each genotype. Plasma IgM and IgG autoantibodies against 124 self-antigens (F); data were analyzed by Mann-Whitney test. Blood platelet counts (G); data were analyzed by Student t-test (LysM, CD2, CD19, Foxp3) or Mann-Whitney test (Vav1, CD4). Blood neutrophil counts (H); data were analyzed by Student t-test (Vav1, LysM, CD2, CD19, Foxp3) or Mann-Whitney test (CD4). (I) Heatmap of individual plasma cytokine concentrations; arrowhead points to IL-17A, color normalized from low (blue) to high (red); data were analyzed by two-way ANOVA with Sidak’s correction for multiple comparisons. (J) Summary of phenotypes in C9orf72 conditional mutant mice. For all panels: * p < 0.05, ** p < 0.01, ns: not significant.
Fig. 2.
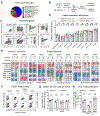
Fig. 2.. Macrophage-expressed C9orf72 restrains CD80 co-stimulation.
(A) Classification of antibody targets in mass cytometry panel. (B) Mass cytometry workflow from spleen of male and female littermates at 2- or 8-months of age. (C) Gating scheme of 9 defined splenocyte populations. (D) Cellular abundance of each gated population from spleen. Dendritic cell (DC). 2mo: C9orf72+/+ (n=7 per group); C9orf72−/− (n=9 per group); 8mo: C9orf72+/+ (n=7 per group); C9orf72−/− (n=8 per group), dots represent individual mice; data were analyzed by one-way ANOVA with Sidak’s correction for multiple comparisons (Macrophage, CD8 DC) or Kruskal-Wallis test with Dunn’s correction for multiple comparisons (CD8+ DC, CD4+CD8+T, Monocyte, Neutrophil, CD4+T, CD8+T, B cell). (E) Average effector median staining intensity on surface of gated splenic populations. For each effector, color scale was normalized from lowest (blue) to highest (red) expression across populations. Data were analyzed by Student’s t-test or Mann-Whitney test with Bonferroni’s correction for multiple comparisons, * p < 0.0056. (F) Representative flow cytometry plots of CD11b and CD80 among CD45+ cells in the indicated tissues from C9orf72+/+ (top) or C9orf72−/− (bottom). mLN, mesenteric lymph node. (G) Quantification of CD11bhi CD80+ cells in the indicated tissues; dots represent individual mice; data analyzed by two-way ANOVA with Sidak’s correction for multiple comparisons. (H) Percentage of OTII T cell receptor transgenic T cells with diluted carboxy fluorescein succinimidyl ester (CFSE) signal after 4 days in co-culture with tissue enriched Ovalbumin (OVA) peptide-loaded macrophages; dots represent individual wells; data were analyzed by two-way ANOVA with Sidak’s correction for multiple comparisons. Unless otherwise stated, * p < 0.05, ** p < 0.01, ns. not significant.
Fig. 3.
Fig. 3.. CD80 is enriched in microglia from C9orf72−/− mice and patients with C9ORF72 ALS.
(A and B) Mass cytometry of forebrain and spinal cord of male and female littermates at 8 months of age (C9orf72+/+, n=7; C9orf72+/−, n=7; C9orf72−/−, n=8). One C9orf72+/+ forebrain sample was excluded due to failed tissue isolation. (A) Representative CD80 and CD86 expression in microglia (left, CD45mid CD11b+ CD39+ CX3CR1+) and monocytes (right, CD45hi CD11b+ Ly6C+). Numbers on plots represent percent of the gated population. (B) Abundance of each gated population. Each dot represents one animal; data were analyzed by one-way ANOVA with Dunnett’s correction for multiple comparisons. (C) Representative human spinal cords stained for Iba1 (green), CD80 (red), and DAPI (blue); scale 10μm. (D) CD80 intensity per Iba1+ human spinal cord microglia with n > 440 microglia imaged per case (left axis, violin plot). Overlaid dot represents the average microglia CD80 intensity per case (right axis). Data were analyzed by unpaired Student’s t-test of average microglia CD80 intensity between C9ORF72 ALS cases (n=4) and non-ALS controls (n=3). For all panels: * p < 0.05, ** p < 0.01, ns. not significant.
Fig. 4.
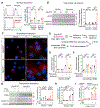
Fig. 4.. C9orf72 governs CD80 trafficking in response to TLR agonist and cytokine exposure.
CRISPR/Cas9-edited Raw 264.7 murine macrophage cells with intact (C9orf72WT) or LOF mutated (C9orf72Δ) C9orf72 locus were used for in vitro studies in all panels. Each dot represents one well. (A) Surface antibody staining and flow cytometry for CD80 or MHCII after 18hr exposure to vehicle or TLR2 agonist Pam3csk4. (B) Whole cell lysate western blot and densitometry quantification analysis 18hrs after exposure to vehicle or Pam3csk4. (C) Immunofluorescent staining for CD80 (red) after 18hr exposure to vehicle or Pam3csk4. (D) Experimental design with PIKFyve lipid kinase inhibitor Apilimod to disrupt vesicle trafficking. (E) Surface or (F) intracellular CD80 staining intensity by flow cytometry. (G) Whole cell lysate western blot and quantification after 18hr exposure to vehicle or recombinant murine IFN-γ with or without recombinant murine IL-17A. (H) Surface antibody staining for CD80 and flow cytometry after 18hr vehicle or cytokine exposure. (I) C9orf72Δ cells transfected with GFP or human C9ORF72 expression plasmid 2 days before 18hr stimulation, surface staining for CD80 and analysis by flow cytometry. Each dot represents one replicate; all experiments were repeated at least twice; data were analyzed by two-way ANOVA with Sidak’s correction for multiple comparisons; * p < 0.05. ** p < 0.01. ns. not significant.
Fig. 5.
Fig. 5.. C9orf72−/− microglia and endothelial cells exhibit a coordinated inflammatory gene profile.
(A) Single cell RNA sequencing workflow from spinal cord and brain cortex at 2, 4 and 8 months of age in female C9orf72+/+ (n=3) and C9orf72−/− (n=3) littermates. (B) Total number of genes differentially expressed (adjusted p < 0.05) between C9orf72+/+ and C9orf72−/− populations. Up-regulated genes are red, down-regulated genes are blue. Abbreviations include endothelia (Endo), microglia (Micro), astrocyte (Astro), pericyte (Peri), oligodendrocyte (Oligo), spinal cord (Crd), brain cortex (Ctx). (C to E) Module score of genes upregulated in endothelial cells (C), microglia (D), or astrocytes (E) across C9orf72−/− (red) and C9orf72+/+ (gray) populations. (F and G) gProfiler pathway enrichment based on genes increased in C9orf72−/− (F) microglia or (G) endothelial cells. (H and I) gProfiler pathway enrichment based on genes decreased in C9orf72−/− (H) microglia or (I) endothelial cells. Gene Ontology (GO); Biological Pathways (BP); Cell Compartment (CC); Kyoto Encyclopedia of Genes and Genomes (KEGG). (J) Genes differentially expressed between C9orf72+/+ and C9orf72/− microglia in spinal cord and cortex by age. (K) Genes differentially expressed between C9orf72+/+ and C9orf72/− endothelial cells in spinal cord and cortex by age.
Fig. 6.
Fig. 6.. Il-17a deficiency reduces CD80 expression in C9orf72−/− gut and spinal cord.
(A to C) Cellular abundance of each gated population at 6 months of age. (A) Ly6G+ Neutrophil, CD4+ T cell, and CD19+ B cell abundance per spleen. (B) Ly6G+ Neutrophil, CD4+ T cell, and CD19+ B cell abundance per mLN. (D) Spleen and mLN CD11b+ CD80hi cell abundance. (E) Representative surface staining of CD80 on CD11b+ spinal cord cells. (F) Spinal cord CD45mid CD11b+ CD80hi microglia and CD45hi CD11b+ CD80hi monocyte/neutrophil abundance. C9orf72+/+ Il-17a+/+ (n=4 per group); C9orf72+/+Il-17a+/− (n=4 per group); C9orf72+/+ Il-17a−/− (n=4 per group); C9orf72−/− Il-17a+/+ (n=5 per group); C9orf72 −/− Il-17a +/− (n=7 per group); C9orf72 −/− Il-17a −/− (n=3 per group) with sexes combined. One C9orf72−/− Il-17a+/− spinal cord sample was excluded due to failed isolation of cells within it; each dot represents one mouse; horizontal bars represents mean; data were analyzed by one-way ANOVA with Dunnett’s correction multiple comparisons within spleen Neutrophil, CD4+, B cell, mLN Neutrophil, B cell, CD80hi CD11b+ and spinal cord CD45hi CD11b+ CD80hi monocyte/neutrophil or Kruskal-Wallis test with Dunn’s multiple comparisons within spleen CD80hi CD11b+, mLN CD4+ and spinal cord CD45mid CD11b+ CD80hi microglia ; * p < 0.05, ** p < 0.01, ns. not significant.
Fig. 7.
Fig. 7.. Therapeutic neutralization of IL-17A improves motor performance in C9orf72−/− mice.
(A) Study design with female (open symbol) and male (closed symbol) C9orf72+/+ (n=22 female and n=16 male) and C9orf72−/− (n=11 female and n=25 male) mice. Treatment groups included C9orf72+/+ mice treated with vehicle (n=38), C9orf72−/− mice treated with isotype control antibody (n=6 female and n=12 male; n=2 males not assessed due to premature mortality) and C9orf72−/− mice treated with anti-IL-17A antibody (n=5 female and n=13 male; n=1 female not assessed due to premature mortality). (B and C) Rotarod performance of (B) females and (C) males over study duration. Data presented as mean ± SEM. For bar plots, each dot represents average fold change in performance of individual mice over 6 weeks relative to pre-treatment; data were analyzed by one-way ANOVA with Tukey’s correction for multiple comparisons. (D and E) Neutrophil count in peripheral blood of (D) females and (E) males over study duration. For bar plots, each dot represents individual mice at week 6 time point; data were analyzed by (D) one-way ANOVA with Tukey’s correction for multiple comparisons and (E) Kruskal-Wallis test with Dunn’s correction for multiple comparisons. (F) Normalized gene expression of single cell dissociated myelin-depleted spinal cord cells evaluated in the following animals: C9orf72+/+ mice treated with vehicle (n=6 female and n=9 male), C9orf72−/− mice treated with isotype control antibody (n=3 female and n=6 male) and C9orf72−/− mice treated with anti-IL-17A antibody (n=3 female and n=7 male). Each dot represents one mouse; horizontal bar represents mean; data were analyzed by two-way ANOVA with Tukey’s correction for multiple comparisons; for all panels: * p < 0.05, ** p < 0.01, ns. not significant.

Comment in

References

    1. Majounie E, Renton AE, Mok K, Dopper EGP, Waite A, Rollinson S, Chiò A, Restagno G, Nicolaou N, Simon-Sanchez J, van Swieten JC, Abramzon Y, Johnson JO, Sendtner M, Pamphlett R, Orrell RW, Mead S, Sidle KC, Houlden H, Rohrer JD, Morrison KE, Pall H, Talbot K, Ansorge O, Chromosome 9-ALS/FTD Consortium, French research network on FTLD/FTLD/ALS, ITALSGEN Consortium, Hernandez DG, Arepalli S, Sabatelli M, Mora G, Corbo M, Giannini F, Calvo A, Englund E, Borghero G, Floris GL, Remes AM, Laaksovirta H, McCluskey L, Trojanowski JQ, Van Deerlin VM, Schellenberg GD, Nalls MA, Drory VE, Lu C-S, Yeh T-H, Ishiura H, Takahashi Y, Tsuji S, Le Ber I, Brice A, Drepper C, Williams N, Kirby J, Shaw P, Hardy J, Tienari PJ, Heutink P, Morris HR, Pickering-Brown S, Traynor BJ, Frequency of the C9orf72 hexanucleotide repeat expansion in patients with amyotrophic lateral sclerosis and frontotemporal dementia: a cross-sectional study. Lancet Neurol 11, 323–330 (2012). - PMC - PubMed
    1. Donnelly CJ, Zhang P-W, Pham JT, Haeusler AR, Heusler AR, Mistry NA, Vidensky S, Daley EL, Poth EM, Hoover B, Fines DM, Maragakis N, Tienari PJ, Petrucelli L, Traynor BJ, Wang J, Rigo F, Bennett CF, Blackshaw S, Sattler R, Rothstein JD, RNA toxicity from the ALS/FTD C9ORF72 expansion is mitigated by antisense intervention. Neuron 80, 415–428 (2013). - PMC - PubMed
    1. Ash PEA, Bieniek KF, Gendron TF, Caulfield T, Lin W-L, Dejesus-Hernandez M, van Blitterswijk MM, Jansen-West K, Paul JW, Rademakers R, Boylan KB, Dickson DW, Petrucelli L, Unconventional translation of C9ORF72 GGGGCC expansion generates insoluble polypeptides specific to c9FTD/ALS. Neuron 77, 639–646 (2013). - PMC - PubMed
    1. Mori K, Weng S-M, Arzberger T, May S, Rentzsch K, Kremmer E, Schmid B, Kretzschmar HA, Cruts M, Van Broeckhoven C, Haass C, Edbauer D, The C9orf72 GGGGCC repeat is translated into aggregating dipeptide-repeat proteins in FTLD/ALS. Science 339, 1335–1338 (2013). - PubMed
    1. Belzil VV, Bauer PO, Prudencio M, Gendron TF, Stetler CT, Yan IK, Pregent L, Daughrity L, Baker MC, Rademakers R, Boylan K, Patel TC, Dickson DW, Petrucelli L, Reduced C9orf72 gene expression in c9FTD/ALS is caused by histone trimethylation, an epigenetic event detectable in blood. Acta Neuropathol 126, 895–905 (2013). - PMC - PubMed

Publication types