. 2024 Apr:70:103047.
doi: 10.1016/j.redox.2024.103047. Epub 2024 Jan 27.

Reactive oxygen species generation by reverse electron transfer at mitochondrial complex I under simulated early reperfusion conditions

Affiliations

Reactive oxygen species generation by reverse electron transfer at mitochondrial complex I under simulated early reperfusion conditions

Caio Tabata Fukushima et al. Redox Biol. 2024 Apr.

Abstract

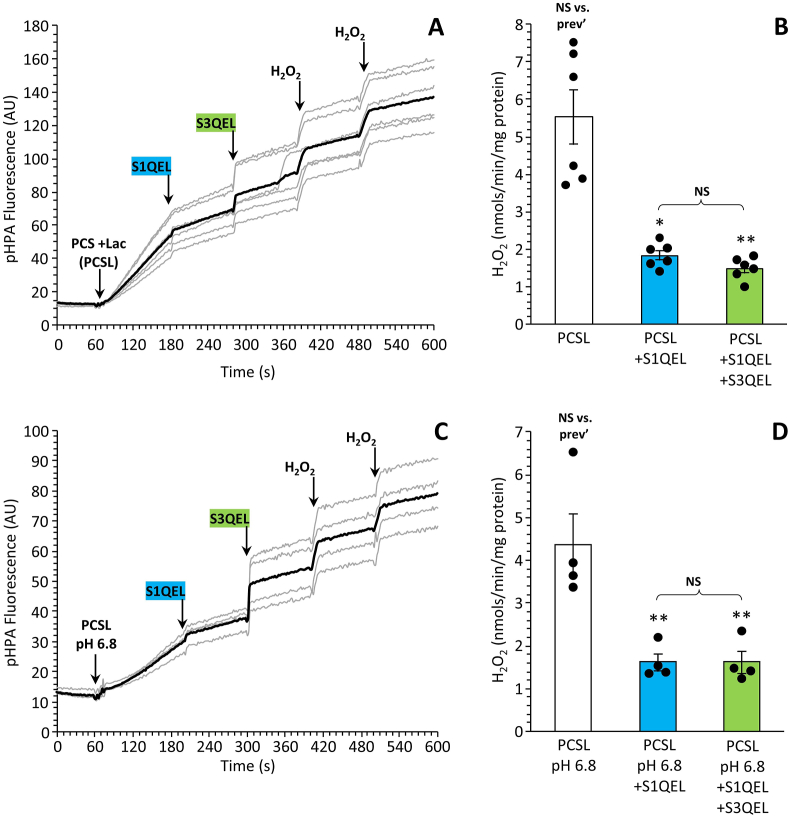
Ischemic tissues accumulate succinate, which is rapidly oxidized upon reperfusion, driving a burst of mitochondrial reactive oxygen species (ROS) generation that triggers cell death. In isolated mitochondria with succinate as the sole metabolic substrate under non-phosphorylating conditions, 90 % of ROS generation is from reverse electron transfer (RET) at the Q site of respiratory complex I (Cx-I). Together, these observations suggest Cx-I RET is the source of pathologic ROS in reperfusion injury. However, numerous factors present in early reperfusion may impact Cx-I RET, including: (i) High [NADH]; (ii) High [lactate]; (iii) Mildly acidic pH; (iv) Defined ATP/ADP ratios; (v) Presence of the nucleosides adenosine and inosine; and (vi) Defined free [Ca2+]. Herein, experiments with mouse cardiac mitochondria revealed that under simulated early reperfusion conditions including these factors, total mitochondrial ROS generation was only 56 ± 17 % of that seen with succinate alone (mean ± 95 % confidence intervals). Of this ROS, only 52 ± 20 % was assignable to Cx-I RET. A further 14 ± 7 % could be assigned to complex III, with the remainder (34 ± 11 %) likely originating from other ROS sources upstream of the Cx-I Q site. Together, these data suggest the relative contribution of Cx-I RET ROS to reperfusion injury may be overestimated, and other ROS sources may contribute a significant fraction of ROS in early reperfusion.

Keywords: Complex-I; Ischemia; Mitochondria; Reactive oxygen species; Reperfusion; Reverse electron transfer.


Conflict of interest statement

Declaration of competing interest The authors hereby state that they have no conflicts of interest, financial or otherwise, regarding the content of this paper.

Figures

Fig. 1
Fig. 1
Baseline ROS Generation by Cx-I RET. Mouse heart mitochondria were incubated as described in the methods, with ROS generation measured by pHPA fluorescence. (A):pHPA fluorescent traces (individual traces in gray, average in black). Where indicated, succinate, rotenone, and H2O2 were added. (B): Quantitation of H2O2 generation rates from traces as shown in A. Individual data points are superimposed on bars showing means ± SEM. (C): As in A, but with use of S1QEL and subsequently S3QEL instead of rotenone. (D): As in B. ***p < 0.0005 vs. baseline condition. NS: not significant.
Fig. 2
Fig. 2
Impact of NADH on ROS. (A): Schematic showing the incubation system to generate NADH from PDH, with export of acetyl-CoA from mitochondria by carnitine, thus avoiding engagement of the TCA cycle. (B): NADH fluorescence in isolated mitochondria (λEX 340 nm/λEM 460 nm), with sequential additions of pyruvate, carnitine, ADP, and rotenone. Representative trace from 3 similar experiments. (C):pHPA fluorescent traces (individual traces in gray, average in black). Where indicated, pyruvate, carnitine, succinate, S1QEL, S3QEL and H2O2 were added sequentially. (D): Quantitation of H2O2 generation rates from traces as shown in C. Individual data points are superimposed on bars showing means ± SEM. **p < 0.005 vs. baselne condition. NS: not significant.
Fig. 3
Fig. 3
Impact of Lactate and Acidic pH on ROS. (A):pHPA fluorescent traces (individual traces in gray, average in black). Where indicated, pyruvate, carnitine, succinate, lactate, S1QEL, S3QEL and H2O2 were added sequentially. (B): Quantitation of H2O2 generation rates from traces as shown in A. Individual data points are superimposed on bars showing means ± SEM. (C): As in A, but at pH 6.8. (D): As in B. *p < 0.05, **p < 0.005, vs. baseline condition. NS: not significant.
Fig. 4
Fig. 4
Impact of Ischemia-Like ATP/ADP on ROS. (A): Schematic showing the creatine kinase (CK) and phosphocreatine/creatine (PCr/Cr) buffer system. (B):pHPA fluorescent traces. Where indicated, substrates, S1QEL, S3QEL and H2O2 were added sequentially. Two independent traces are shown for each ATP/ADP condition (color coded), with the data offset vertically by 20 units for clarity. (C): Quantitation of H2O2 generation rates from traces as shown in B. Individual data points are superimposed on bars (color-coded to match B) showing means ± SEM. Individual data points are superimposed on bars showing means ± SEM. *p < 0.05, **p < 0.005, vs. baseline condition. NS: not significant.
Fig. 5
Fig. 5
Impact of Purine Nucleosides and Ca2+on ROS. (A): Effect of adenosine or inosine on ROS generation (original pHPA traces not shown). Graph shows rates of H2O2 generation calculated from traces, with the ischemia-like ATP/ADP condition from previous figure (red bar) forming the baseline condition for addition of nucleosides. (B): Quantitation of H2O2 generation rates under different prevailing free [Ca2+] conditions. The baseline condition herein represents the presence of both adenosine and inosine from panel A. Individual data points are superimposed on bars showing means ± SEM. *p < 0.05, **p < 0.005, ***p < 0.0005, vs. baseline condition. NS: not significant.
Fig. 6
Fig. 6
Overall Comparison of Conditions (A): Comparison of all conditions studied herein, with developments to the model system proceeding left-to-right. Blue bars show S1QEL-sensitive component of ROS, green the S3QEL-sensitive, and gray the component not attributable to either source. The bars show absolute values of H2O2 (see Y-axis) with standard errors, while numbers within the bars show the percentage contribution of each component to the total. (B): Visualization of the overall and contributing components of ROS generation in the original (succinate only) and final (simulated early reperfusion) conditions. Each colored box represents 1 unit of ROS, with the original condition assigned to 100 units. In the final model, overall ROS is 56 % of that seen in the original model. Contribution of each component is color-coded as per panel A, and % contributions scaled appropriately. Values are ±95 % confidence intervals.

Update of

References

    1. Chouchani E.T., et al. Ischaemic accumulation of succinate controls reperfusion injury through mitochondrial ROS. Nature. 2014;515:431–435. doi: 10.1038/nature13909. - DOI - PMC - PubMed
    1. Zhang J., et al. Accumulation of succinate in cardiac ischemia primarily occurs via canonical Krebs cycle activity. Cell Rep. 2018;23:2617–2628. doi: 10.1016/j.celrep.2018.04.104. - DOI - PMC - PubMed
    1. Pell V.R., Chouchani E.T., Murphy M.P., Brookes P.S., Krieg T. Moving forwards by blocking back-flow: the yin and yang of MI therapy. Circ. Res. 2016;118:898–906. doi: 10.1161/CIRCRESAHA.115.306569. - DOI - PMC - PubMed
    1. Hochachka P.W., Owen T.G., Allen J.F., Whittow G.C. Multiple end products of anaerobiosis in diving vertebrates. Comp. Biochem. Physiol. B. 1975;50:17–22. doi: 10.1016/0305-0491(75)90292-8. - DOI - PubMed
    1. Taegtmeyer H. Metabolic responses to cardiac hypoxia. Increased production of succinate by rabbit papillary muscles. Circ. Res. 1978;43:808–815. doi: 10.1161/01.res.43.5.808. - DOI - PubMed

LinkOut - more resources