. 2024 Jul;44(7):1199-1207.
doi: 10.1177/0271678X241230733. Epub 2024 Jan 31.

The associations between synaptic density and "A/T/N" biomarkers in Alzheimer's disease: An 18F-SynVesT-1 PET/MR study

Affiliations

The associations between synaptic density and "A/T/N" biomarkers in Alzheimer's disease: An 18F-SynVesT-1 PET/MR study

Junpeng Li et al. J Cereb Blood Flow Metab. 2024 Jul.

Abstract

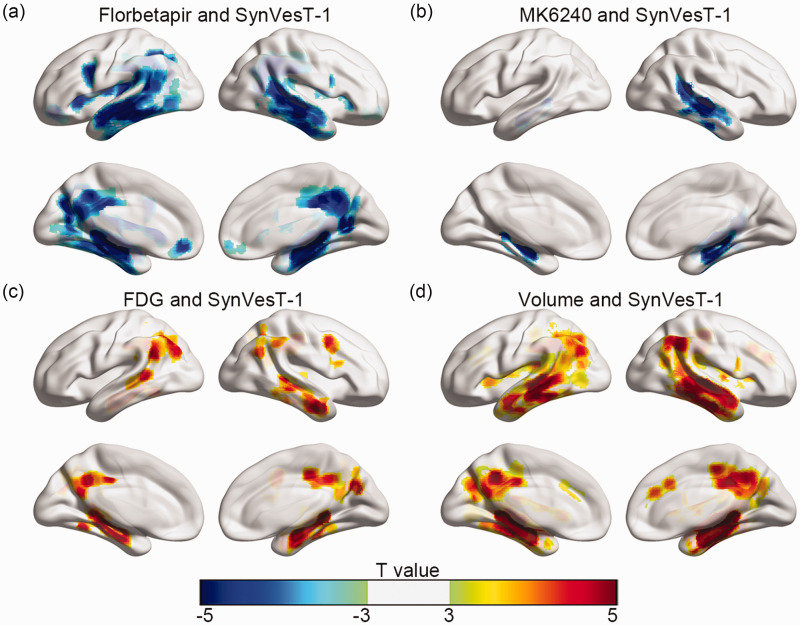
A newly developed SV2A radiotracer, 18F-SynVesT-1, was used in this study to investigate synaptic density and its association with Alzheimer's disease (AD) "A/T/N" biomarkers. The study included a cohort of 97 subjects, consisting of 64 patients with cognitive impairment (CI) and 33 individuals with normal cognition (CU). All subjects underwent 18F-SynVesT-1 PET/MR and 18F-florbetapir PET/CT scans. Additionally, a subgroup of individuals also underwent 18F-MK-6240, 18F-FDG PET/CT, plasma Aβ42/Aβ40 and p-tau181 tests. The differences in synaptic density between the groups and the correlations between synaptic density and AD "A/T/N" biomarkers were analyzed. The results showed that compared to the CU group, the CI with Aβ+ (CI+) group exhibited the most pronounced synapse loss in the hippocampus, with some loss also observed in the neocortex. Furthermore, synaptic density in the hippocampus and parahippocampal gyrus showed associations with AD biomarkers detected by both imaging and plasma tests in the CI group. The associations between synaptic density and FDG uptake and hippocampal volume were also observed in the CI+ group. In conclusion, the study demonstrated significant synaptic density loss, as measured by the promising tracer 18F-SynVesT-1, and its close correlation with "A/T/N" biomarkers in patients with both Alzheimer's clinical syndrome and pathological changes.

Keywords: Synaptic vesicle glycoprotein 2A; amyloid-β deposition; cognitive performance; glucose metabolism; plasma biomarkers.


Conflict of interest statement

Declaration of conflicting interestsThe author(s) declared no potential conflicts of interest with respect to the research, authorship, and/or publication of this article.

Figures

Figure 1.
Figure 1.
Group differences between (a) overall CI and CU, (b) CI+ and CU, (c) CI+ and CI− and (d) CI− and CU by voxelwise analysis. The color bar represents the t value with a statistical threshold of p < 0.05, cluster-level FWE correction.
Figure 2.
Figure 2.
Association of “A/T/N” biomarkers with synaptic density in all the subjects by voxelwise analysis. (a) Negative correlation of global 18F-Flobetapir SUVRs with synaptic density; (b) Negative correlation of 18F-MK-6240 SUVRs in the MTL with synaptic density; (c) Positive correlation of glucose metabolism in the MTL with synaptic density and (d) Positive correlation of hippocampal volume with synaptic density. The color bar represents the t value with a statistical threshold of p < 0.05, cluster-level FWE correction.
Figure 3.
Figure 3.
Correlations of “A/T/N” biomarkers with synaptic density by ROI-based analysis in the CI+, CI− and CU groups. (a–d) Correlations of hippocampal 18F-SynVesT-1 SUVRs with global 18F-Flobetapir SUVRs, 18F-MK-6240 SUVRs in the MTL, 18F-FDG SUVRs in the MTL and hippocampal volume and (e–h) Correlations of 18F-SynVesT-1 SUVRs in the PHG with global 18F-Flobetapir SUVRs, 18F-MK-6240 SUVRs in the MTLs, 18F-FDG SUVRs in the MTL and hippocampal volume.
Figure 4.
Figure 4.
Correlations between synaptic density and plasma biomarkers. The correlations of (a) plasma Aβ42/40 and (b) plasma p-tau181 levels with synaptic density in the overall cohort. The correlations of hippocampal synaptic density with (c) plasma Aβ42/40 and (d) plasma p-tau181 levels in the CI+ and CU groups. The correlations of synaptic density in the PHG with (e) plasma Aβ42/40 and (f) plasma p-tau181 levels in the CI+ and CU groups. The color bar in the voxelwise results represents the T value with a statistical threshold of p < 0.05, cluster-level FWE correction.

References

    1. Jack CR, Jr, Knopman DS, Jagust WJ, et al.. Hypothetical model of dynamic biomarkers of the Alzheimer’s pathological cascade. Lancet Neurol 2010; 9: 119–128. - PMC - PubMed
    1. Coleman PD, Yao PJ. Synaptic slaughter in Alzheimer’s disease. Neurobiol Aging 2003; 24: 1023–1027. - PubMed
    1. Pickett EK, Koffie RM, Wegmann S, et al.. Non-fibrillar oligomeric amyloid-beta within synapses. J Alzheimers Dis 2016; 53: 787–800. - PubMed
    1. Ondrejcak T, Klyubin I, Corbett GT, et al.. Cellular prion protein mediates the disruption of hippocampal synaptic plasticity by soluble tau in vivo. J Neurosci 2018; 38: 10595–10606. - PMC - PubMed
    1. Pereira JB, Janelidze S, Ossenkoppele R, et al.. Untangling the association of amyloid-beta and tau with synaptic and axonal loss in Alzheimer’s disease. Brain 2021; 144: 310–324. - PMC - PubMed

MeSH terms

LinkOut - more resources