. 2025 Jan:67:331-348.
doi: 10.1016/j.jare.2024.01.028. Epub 2024 Jan 29.

Dehydrocostus lactone suppresses gastric cancer progression by targeting ACLY to inhibit fatty acid synthesis and autophagic flux

Affiliations

Dehydrocostus lactone suppresses gastric cancer progression by targeting ACLY to inhibit fatty acid synthesis and autophagic flux

Yuxuan Chen et al. J Adv Res. 2025 Jan.

Abstract

Introduction: Dehydrocostus lactone (Dehy), a natural sesquiterpene lactone from Saussurea lappa Clarke, displays remarkable efficacy in treating cancer and gastrointestinal disorders. However, its anti-gastric cancer (GC) effect remains poorly understood.

Objectives: Our study aimed to elucidate the anti-GC effect of Dehy and its putative mechanism.

Methods: The anti-GC effect was assessed with MTT, colony formation, wound healing and transwell invasion assays. Cell apoptosis rate was detected by Annexin V-FITC/PI binding assay. Network pharmacology analysis and XF substrate oxidation stress test explored the underlying mechanism and altered metabolic phenotype. Lipogenic enzyme expressions and neutral lipid pool were measured to evaluate cellular lipid synthesis and storage. Biolayer interferometry and molecular docking investigated the direct target of Dehy. Autophagosomes were observed by transmission electron microscopy and MDC staining, while the autophagic flux was detected by mRFP-GFP-LC3 transfection. The clinical significance of ACLY was confirmed by tissue microarrays. Patient-derived xenograft (PDX) models were adopted to detect the clinical therapeutic potential of Dehy.

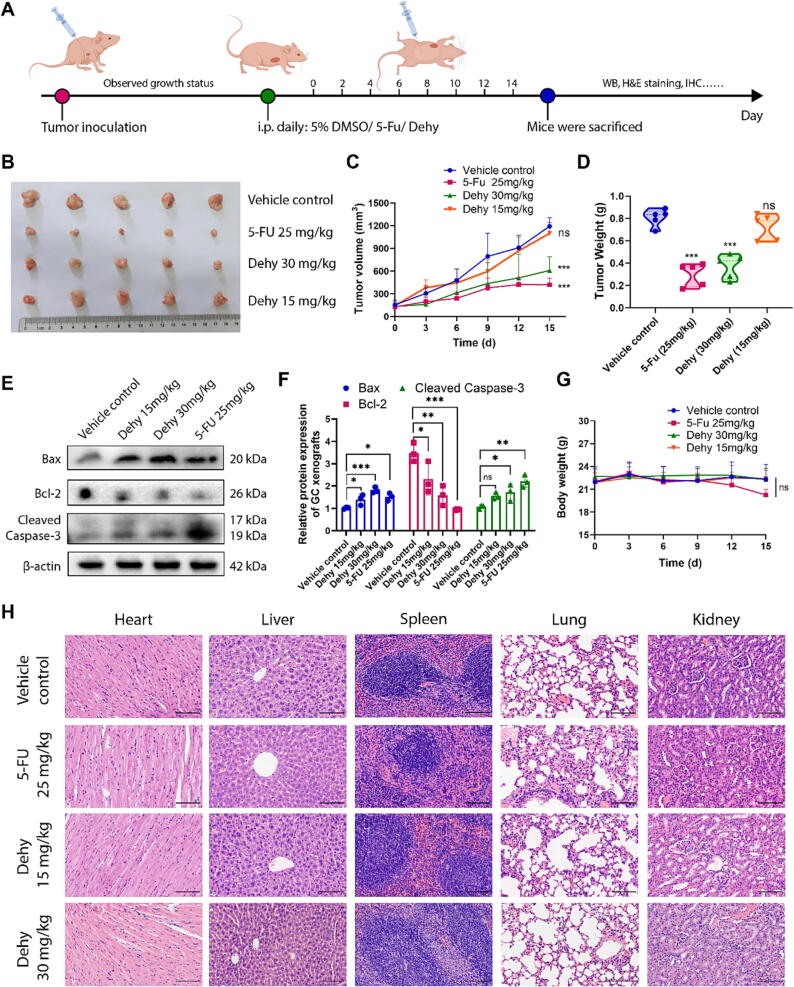
Results: Dehy prominently suppressed GC progression both in vitro and in vivo. Mechanistically, Dehy down-regulated the lipogenic enzyme ACLY, thereby reducing fatty acid synthesis and lipid reservation. Moreover, IKKβ was identified as the direct target of Dehy. Dehy inhibited the phosphorylation of IKKβ, promoting the ubiquitination and degradation of ACLY, thereby resulting in lipid depletion. Subsequently, GC cells initiated autophagy to replenish the missing lipids, whereas Dehy impeded this cytoprotective mechanism by down-regulating LAMP1 and LAMP2 expressions, which disrupted lysosomal membrane functions, ultimately leading to apoptosis. Additionally, Dehy exhibited potential in GC clinical therapy as it enhanced the efficacy of 5-Fluorouracil in PDX models.

Conclusions: Our work identified Dehy as a desirable agent for blunting abnormal lipid metabolism and highlighted its inhibitory effect on protective autophagy, suggesting the future development of Dehy as a novel therapeutic drug for GC.

Keywords: ACLY; Autophagy; Dehydrocostus lactone; Gastric cancer; Lipid metabolism; Ubiquitination.


Conflict of interest statement

Declaration of competing interest The authors declare that they have no known competing financial interests or personal relationships that could have appeared to influence the work reported in this paper.

Figures

None
Graphical abstract
Fig. 1
Fig. 1
Dehy inhibits the proliferation and migration of GC cells in vitro. (A) Chemical structure of Dehy. (B-C) MKN-28 and AGS cells were incubated with different concentrations of Dehy (0, 5, 10, 15, 20, 25 μM) for 24 and 48 h respectively. The inhibition rate of cell proliferation is represented as percent of the control. (D) Colony formation ability of MKN-28 and AGS cells after incubation with 0, 5, 10 or 15 μM Dehy. The colonies were stained with crystal violet. (E) The number of colonies was counted and statistically analyzed with ImageJ software. (F) Representative photomicrographs of the wound healing assay at 0, 24 and 48 h. Scale bars, 200 μm. (G) The rate of cell migration is quantified and represented as the percentage of the control. (H) Representative photomicrographs of the transwell invasion assay following Dehy treatment (0, 5, 10, 15 μM) for 24 h. Scale bars, 200 μm. GC cells were stained with crystal violet. (I) The number of invasion cells was counted and statistically analyzed with ImageJ software. Data were presented as mean ± SD (n = 3). Statistical difference was determined through one-way or two-way ANOVA, *P < 0.05, **P < 0.01, ***P < 0.001. (For interpretation of the references to colour in this figure legend, the reader is referred to the web version of this article.)
Fig. 2
Fig. 2
Dehy induces apoptosis in GC cells. (A-B) MKN-28 and AGS cells were treated with Dehy at indicated concentrations (0, 5, 10, and 15 μM) for 24 h, and cell apoptosis was measured by Annexin V-FITC/PI staining coupled with flow cytometry. The apoptosis rate was the sum of early and late apoptosis. (C-D) MKN-28 and AGS cells were treated with Dehy (0, 5, 10, and 15 μM) for 24 h, and the expression levels of Bcl-2, Bax, and Cleaved Caspase-3 were detected by Western blot. The relative protein expression levels were calculated and statistically analyzed. (E) Representative fluorescence images of JC-1-stained MKN-28 and AGS cells with or without Dehy treatment. Scale bars, 100 μm. (F) Red (aggregates)/green (monomers) fluorescence intensity for JC-1 staining, reflecting the mitochondrial membrane potential of GC cells. Approximately 60 cells were randomly selected and quantified for each condition. Data were presented as mean ± SD (n = 3). Statistical difference was determined through one-way ANOVA, *P < 0.05, **P < 0.01, ***P < 0.001. (For interpretation of the references to colour in this figure legend, the reader is referred to the web version of this article.)
Fig. 3
Fig. 3
Dehy inhibits the growth of GC in tumor xenografts. (A) Schematic overview of the in vivo experiment. (B) Representative pictures of the tumors from mice treated with Dehy (15 and 30 mg/kg), 5-FU (25 mg/kg), or vehicle control. n = 5 per group. (C-D) Tumor volume and weight in (B). (E-F) Protein levels of Bcl-2, Bax, and Cleaved Caspase-3 in the tumor samples were detected by Western blot. Relative protein expression levels were calculated and statistically analyzed. (G) The body weight of the mice was measured every 3 days during the treatment. (H) Representative H&E staining images of the hearts, livers, spleens, lungs and kidneys from the mice. Scale bars, 100 μm. Data were presented as mean ± SD (n = 3). Statistical difference was determined through one-way ANOVA, *P < 0.05, **P < 0.01, ***P < 0.001.
Fig. 4
Fig. 4
Dehy demonstrates potential in regulating the lipid metabolism of GC cells. (A) Venn diagram depicts the intersection between Dehy and GC disease targets. (B) Enrichment analysis of KEGG pathway showed that Dehy participated in metabolic process, regulation of lipolysis in adipocytes, lysosome and apoptosis, etc. The top 20 enrichment KEGG pathways were shown in the bubble chart. (C) Enrichment analysis of GO concerning biological processes, cell component and molecular function. The top 10 enrichment GO terms were shown in the histogram. (D) XF substrate oxidation stress test was performed in AGS cells treated with or without Dehy (15 μM), and the oxygen consumption rates (OCR) were measured with the treatment of indicated pathway inhibitors. (E-F) The parameters of basal respiration and maximal respiration in AGS cells were calculated from (D). Data were presented as mean ± SD (n = 3). Statistical difference was determined through two-tail student’s t-test, *P < 0.05, **P < 0.01, ***P < 0.001 versus the vehicle control group.
Fig. 5
Fig. 5
Dehy inhibits de novo FA synthesis in GC cells. (A) Schematic overview of de novo FA synthesis in cancer cells. (B-C) Western blot demonstrates the inhibitory effect of Dehy on the expressions of ACLY, ACC and FASN in MKN-28 and AGS cells. Relative protein expression levels were calculated and statistically analyzed. (D-E) Representative fluorescence imaging of neutral lipids stained with BODIPY 493/503 (green) in MKN-28 and AGS cells treated with Dehy (0, 5, 10, and 15 μM) for 24 h. Nuclei were stained with DAPI (blue). Scale bar, 100 μm. The relative average fluorescence intensity was analyzed with ImageJ software. (F-G) Western blot analysis of ACLY, ACC and FASN in GC xenografts. Relative protein expression levels were calculated and statistically analyzed. (H-I) Representative Immunofluorescence images of mice tumor tissues stained for ACLY (red) from vehicle control, 5-FU (25 mg/kg), and Dehy (15 and 30 mg/kg) treatment groups. Nuclei were stained with DAPI (blue). Scale bar, 50 μm. The relative average fluorescence intensity was analyzed with ImageJ software. Data were presented as mean ± SD (n = 3). Statistical difference was determined through one-way ANOVA, *P < 0.05, **P < 0.01, ***P < 0.001. (For interpretation of the references to colour in this figure legend, the reader is referred to the web version of this article.)
Fig. 6
Fig. 6
Dehy directly binds to IKKβ and inhibits its phosphorylation to promote ACLY ubiquitination. (A) After treated with Dehy (0, 5, 10, and 15 μM) for 24 h, the mRNA levels of ACLY in MKN-28 and AGS cells were measured by qRT-PCR. (B-C) Western blot detected ACLY protein levels in MKN-28 and AGS cells following Dehy treatment (15 μM), with or without MG132 (10 μM), 3-MA (5 mM). (D) Co-IP was performed using anti-ACLY or IgG antibodies, and ubiquitination levels of ACLY were detected by Western blot in MKN-28 and AGS cells following MG132 (10 μM, 6 h) treatment, in the presence or absence of Dehy (15 μM, 24 h). (E-F) Western blot analysis of p-ACLY (Ser455) in MKN-28 and AGS cells following Dehy treatment (0, 5, 10, and 15 μM) for 24 h. Relative protein expression levels were calculated and statistically analyzed. (G-H) Western blot analysis of p-IKKβ and IKKβ in GC cells after treatment with Dehy (0, 5, 10, and 15 μM) for 24 h. Relative protein expression levels were calculated and statistically analyzed. (I) Biolayer interferometry analysis of the interactions between Dehy and IKKβ. (J) Molecular docking simulated the binding of Dehy to IKKβ. The 2D image reveals that Dehy interacts with several amino acids including Arg452, Gln448, Met456, Met552, and Gly553. Red and blue dotted lines signify the hydrogen bonds between Dehy and IKKβ. Data were presented as mean ± SD (n = 3). Statistical difference was determined through one-way ANOVA, *P < 0.05, **P < 0.01, ***P < 0.001. (For interpretation of the references to colour in this figure legend, the reader is referred to the web version of this article.)
Fig. 7
Fig. 7
Dehy inhibits autophagic flux by disrupting lysosomal membrane functions in GC cells. (A-B) Western blot analysis of p62, Beclin-1 and LC3A/B in MKN-28 and AGS cells after Dehy treatment (0, 5, 10, and 15 μM) for 24 h. Relative protein expression levels were calculated and statistically analyzed. (C-D) After treating AGS cells with Dehy (0, 5, 10, and 15 μM) for 24 h, the autophagic vacuoles were stained with MDC (green) and observed under fluorescence microscopy. Scale bar, 50 μm. The quantitative analysis of MDC staining was performed by ImageJ software. (E-F) The soluble and insoluble fractions were obtained from the GC cells that incubated with Dehy (0, 5, 10, and 15 μM). Protein levels of p62 were analyzed by Western blot and quantified by ImageJ software. (G-H) Western blot analysis of P62, Beclin-1 and LC3A/B in MKN-28 and AGS cells after treated with or without Dehy (15 μM) for 12, 24 and 48 h. Relative protein expression levels were calculated and statistically analyzed. (I) Representative fluorescence imaging photographs of AGS cells transfected with mRFP-GFP-LC3 adenovirus. The cells were transiently transfected with the adenovirus and then incubated with or without Dehy (15 μM), or HCQ (20 μM) for 24 h. Scale bar: 5 μm. (J) Autophagosomes were observed by transmission electron microscopy in MKN-28 cells treated with or without Dehy (15 μM) for 24 h. The red arrows showed the autophagosomes. Scale bar, 2 μm (up) and 500 nm (down). (K-L) Protein levels of LAMP1 and LAMP2 were detected in MKN-28 and AGS cells after Dehy treatment (0, 5, 10, and 15 μM) for 24 h. Relative protein expression levels were calculated and statistically analyzed. (M−N) Western blot analysis of LAMP1, LAMP2 and p62 in GC xenografts. Relative protein expression levels were calculated and statistically analyzed. Data were presented as mean ± SD (n = 3). Statistical difference was determined through one-way or two-way ANOVA, *P < 0.05, **P < 0.01, ***P < 0.001. (For interpretation of the references to colour in this figure legend, the reader is referred to the web version of this article.)
Fig. 8
Fig. 8
Overexpression of ACLY blunts the pro-apoptotic effect of Dehy in DC cells. (A-B) MKN-28 and AGS cells were transfected with pcDNA-NC or pcDNA-ACLY for 24 h followed by exposure to Dehy (15 μM, 24 h). The protein levels of ACLY, p62, Beclin-1, LC3A/B, Bcl-2, and Bax were determined by Western blot. Relative protein expression levels were calculated and statistically analyzed. (C-D) Following pcDNA transfection and Dehy treatment (15 μM, 24 h), cellular neutral lipids were stained with BODIPY 493/503 (green). Nuclei were stained with DAPI (blue). Scale bar, 100 μm. The relative average fluorescence intensity was analyzed with ImageJ software. (E-F) Following pcDNA transfection and Dehy treatment (15 μM, 24 h), we measured cell apoptosis rate by using Annexin V-FITC/PI staining coupled with flow cytometry. Data were presented as mean ± SD (n = 3). Statistical difference was determined through one-way ANOVA, *P < 0.05, **P < 0.01, ***P < 0.001. (For interpretation of the references to colour in this figure legend, the reader is referred to the web version of this article.)
Fig. 9
Fig. 9
Dehy suppresses tumor growth and enhances the therapeutic efficacy of 5-FU in GC PDX models. (A) Representative images of ACLY IHC staining in tissue microarrays, which consist of matched pairs of GC and adjacent stomach tissues from 99 patients. (B) 20 samples from each group were randomly selected in (A), and their ACLY expression levels were statistically analyzed. (C) Schematic overview of the in vivo experiment. (D) Representative pictures of the tumors from mice treated with vehicle control, 5-FU (25 mg/kg), Dehy (30 mg/kg), or combination therapy of 5-FU (25 mg/kg) and Dehy (30 mg/kg). n = 5 per group. (E-F) Tumor weight and volume in (D). (G) The body weight of the mice was measured every 3 days during the treatment. (H-I) Protein levels of ACLY, LAMP1, LAMP2, p62, Bcl-2 and Bax in the tumor samples were detected by Western blot. Relative protein expression levels were calculated and statistically analyzed. Data were presented as mean ± SD (n = 3). Statistical difference was determined through one-way ANOVA, *P < 0.05, **P < 0.01, ***P < 0.001.

References

    1. Sung H., et al. Global Cancer Statistics 2020: GLOBOCAN Estimates of Incidence and Mortality Worldwide for 36 Cancers in 185 Countries. CA: a cancer journal for clinicians. 2021;71(3):209–249. - PubMed
    1. Yoshinami Y, Shoji HA-O., Recent advances in immunotherapy and molecular targeted therapy for gastric cancer. (2056-5623 (Print)). - PMC - PubMed
    1. Singh S., et al. Lead phytochemicals for anticancer drug development. Front Plant Sci. 2016;7:1667. - PMC - PubMed
    1. Hu Q., et al. PTR; Phytotherapy research: 2023. Natural products targeting signaling pathways associated with regulated cell death in gastric cancer: Recent advances and perspectives. - PubMed
    1. Li Q., et al. Antitumor activity and mechanism of costunolide and dehydrocostus lactone: Two natural sesquiterpene lactones from the Asteraceae family. Biomedicine & pharmacotherapy = Biomedecine & pharmacotherapie. 2020;125 - PubMed

LinkOut - more resources