

Distance Matters: Investigating No-Shows in a Large Rural Provider Network
- PMID: 38296643
- PMCID: PMC11149957
- DOI: 10.3121/cmr.2023.1853
Distance Matters: Investigating No-Shows in a Large Rural Provider Network
Abstract
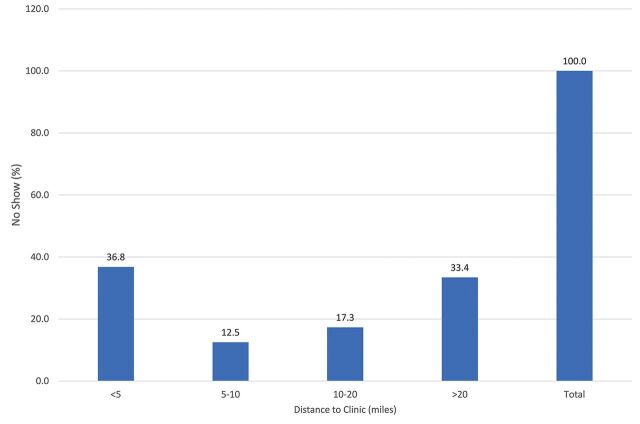
Background/Objective: No-shows have a negative effect on healthcare outcomes. It is unclear, however, whether patients' distance from the clinic is associated with higher no-show rates. To fill this knowledge gap, we examined the relationship between patients' distance from the clinic and no-shows in a rural provider network.Methods: Data from Marshfield Clinic Health System's scheduling system, including 263,464 recent patient appointments in 2021 were analyzed. The outcome was no-shows, defined as when patients missed an appointment (categorized as yes/no). The exposure was the distance to the clinic, measured in miles as a straight-line distance from the clinic in the patient's zip code to the facility where the appointment was held (classified as <5 miles, 5-10, 10-20; >20, and used as continuous). Covariates were patient demographics, appointments, providers, and insurance status. Chi-square and logistic regression were used with p-values ≤.05 considered statistically significant.Results: The no-show rate was 8.0%. Patients who lived <5 miles (8.3%) and >20 miles (8.2%) from the clinic had higher no-show rates than those who lived between 10-20 miles (8.0%) and 5-10 miles (7.6%), at P=0.001. In the adjusted model, the odds of no-show were similar between patients who did not show and those who did (OR:1.00,95%CI:1.00-1.00). No-shows were more likely among male patients compared to females (OR:1.14,95%CI:1.11-1.18), Spanish compared to English speakers (OR:1.34,95%CI:1.20-1.50), prior no-show compared to no prior no-show (OR:4.42,95%CI:4.27-4.48), >4 weeks lead time compared to <1 day (OR:5.45,95%CI:4.98-5.97), and Medicaid compared to non-Medicaid patients (OR:1.56,95%CI:1.49-1.63).Conclusion: Our analysis showed patients who lived <5 miles and >20 miles from the clinic had higher no-show rates. The odds of a no-show were comparable between patients who showed up and those who did not. Male patients, Spanish-speaking patients, patients with a history of no-shows, and Medicaid beneficiaries were more likely to miss their appointments. Understanding the impact of these variables on no-show rates can assist healthcare providers in developing strategies to improve patient access and reduce no-show rates. These findings imply that rural patients may face a variety of barriers when seeking healthcare, necessitating a comprehensive approach to addressing this issue.
Keywords: Distance from the Clinic; No-Show Appointments; Rural Provider Network.
Copyright © 2023 Marshfield Clinic Health System.
Conflict of interest statement
Disclosures: The authors have disclosed no personal or financial conflicts of interest or financial support related to this work.
Figures
References
-
- Daghistani T, AlGhamdi H, Alshammari R, AlHazme RH.. Predictors of outpatients’ no-show: big data analytics using apache spark. Journal of Big Data. 2020;7(1):108. doi:10.1186/s40537-020-00384-9. - DOI
-
- Li Y, Tang SY, Johnson J, Lubarsky DA.. Individualized No-Show Predictions: Effect on Clinic Overbooking and Appointment Reminders. Production and Operations Management. 2019;28(8):2068-2086. doi:10.1111/poms.13033. - DOI
MeSH terms
LinkOut - more resources
Full Text Sources
Medical
Miscellaneous