

Optimizing sequence design strategies for perturbation MPRAs: a computational evaluation framework
- PMID: 38296821
- PMCID: PMC10939410
- DOI: 10.1093/nar/gkae012
Optimizing sequence design strategies for perturbation MPRAs: a computational evaluation framework
Abstract
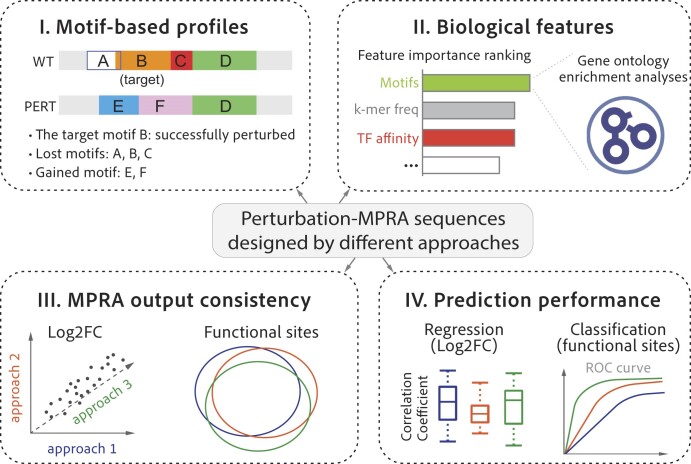
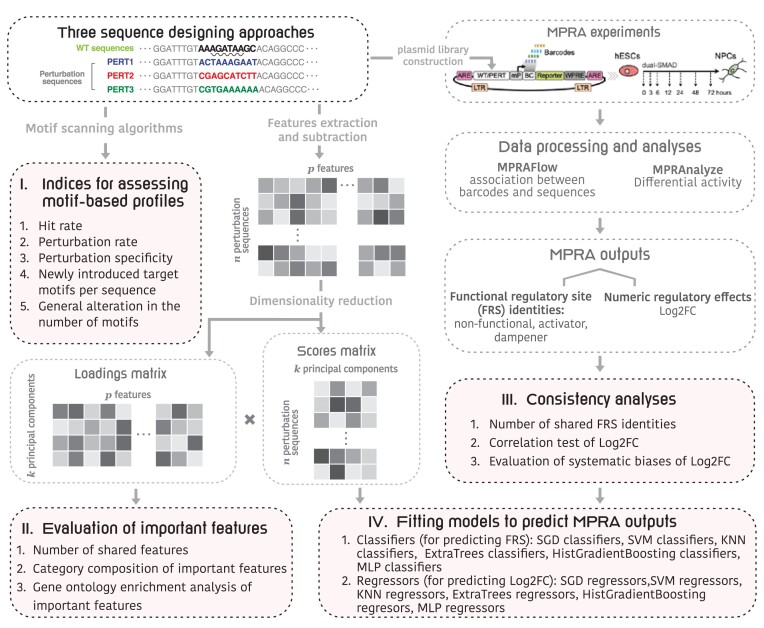
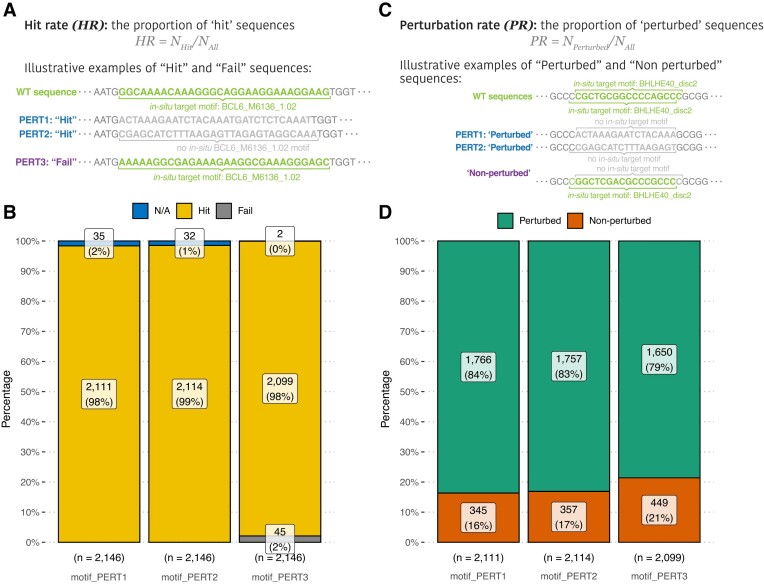
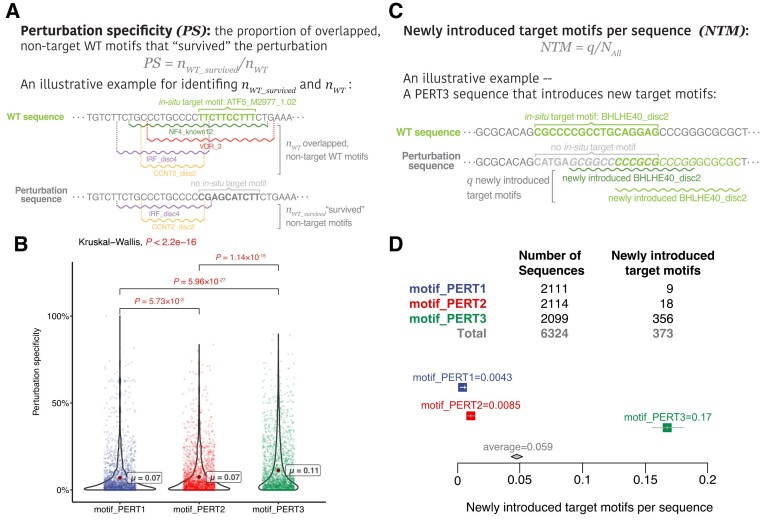
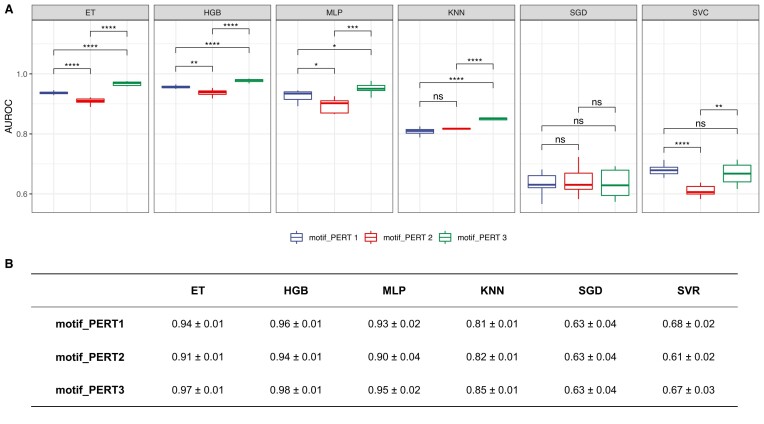
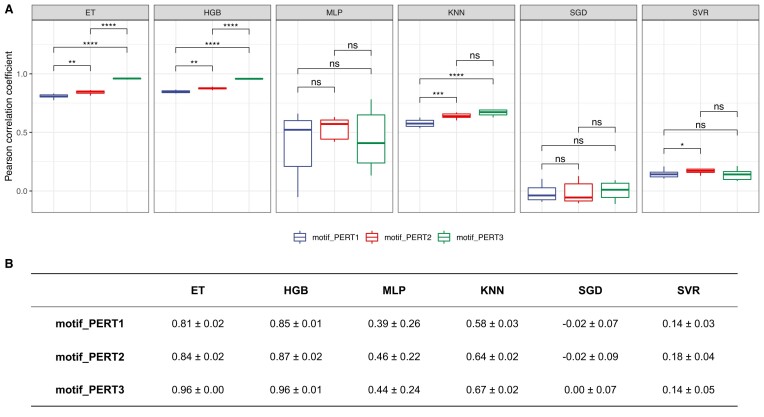
The advent of perturbation-based massively parallel reporter assays (MPRAs) technique has facilitated the delineation of the roles of non-coding regulatory elements in orchestrating gene expression. However, computational efforts remain scant to evaluate and establish guidelines for sequence design strategies for perturbation MPRAs. In this study, we propose a framework for evaluating and comparing various perturbation strategies for MPRA experiments. Within this framework, we benchmark three different perturbation approaches from the perspectives of alteration in motif-based profiles, consistency of MPRA outputs, and robustness of models that predict the activities of putative regulatory motifs. While our analyses show very similar results across multiple benchmarking metrics, the predictive modeling for the approach involving random nucleotide shuffling shows significant robustness compared with the other two approaches. Thus, we recommend designing sequences by randomly shuffling the nucleotides of the perturbed site in perturbation-MPRA, followed by a coherence check to prevent the introduction of other variations of the target motifs. In summary, our evaluation framework and the benchmarking findings create a resource of computational pipelines and highlight the potential of perturbation-MPRA in predicting non-coding regulatory activities.
© The Author(s) 2024. Published by Oxford University Press on behalf of Nucleic Acids Research.
Figures
Update of
-
Best practices for perturbation MPRA-a computational evaluation framework of sequence design strategies.bioRxiv [Preprint]. 2023 Sep 29:2023.09.27.559768. doi: 10.1101/2023.09.27.559768. bioRxiv. 2023. Update in: Nucleic Acids Res. 2024 Feb 28;52(4):1613-1627. doi: 10.1093/nar/gkae012. PMID: 37808807 Free PMC article. Updated. Preprint.
Similar articles
-
Best practices for perturbation MPRA-a computational evaluation framework of sequence design strategies.bioRxiv [Preprint]. 2023 Sep 29:2023.09.27.559768. doi: 10.1101/2023.09.27.559768. bioRxiv. 2023. Update in: Nucleic Acids Res. 2024 Feb 28;52(4):1613-1627. doi: 10.1093/nar/gkae012. PMID: 37808807 Free PMC article. Updated. Preprint.
-
Genome-scale high-resolution mapping of activating and repressive nucleotides in regulatory regions.Nat Biotechnol. 2016 Nov;34(11):1180-1190. doi: 10.1038/nbt.3678. Epub 2016 Oct 3. Nat Biotechnol. 2016. PMID: 27701403 Free PMC article.
-
Deciphering regulatory DNA sequences and noncoding genetic variants using neural network models of massively parallel reporter assays.PLoS One. 2019 Jun 17;14(6):e0218073. doi: 10.1371/journal.pone.0218073. eCollection 2019. PLoS One. 2019. PMID: 31206543 Free PMC article.
-
Massively parallel reporter assay: a novel technique for analyzing the regulation of gene expression.Yi Chuan. 2023 Oct 20;45(10):859-873. doi: 10.16288/j.yczz.23-180. Yi Chuan. 2023. PMID: 37872110 Review.
-
Massively Parallel Reporter Assays for High-Throughput In Vivo Analysis of Cis-Regulatory Elements.J Cardiovasc Dev Dis. 2023 Mar 29;10(4):144. doi: 10.3390/jcdd10040144. J Cardiovasc Dev Dis. 2023. PMID: 37103023 Free PMC article. Review.
Cited by
-
Comprehensive network modeling approaches unravel dynamic enhancer-promoter interactions across neural differentiation.bioRxiv [Preprint]. 2024 May 23:2024.05.22.595375. doi: 10.1101/2024.05.22.595375. bioRxiv. 2024. Update in: Genome Biol. 2024 Aug 14;25(1):221. doi: 10.1186/s13059-024-03365-w. PMID: 38826254 Free PMC article. Updated. Preprint.
-
Comprehensive network modeling approaches unravel dynamic enhancer-promoter interactions across neural differentiation.Genome Biol. 2024 Aug 14;25(1):221. doi: 10.1186/s13059-024-03365-w. Genome Biol. 2024. PMID: 39143563 Free PMC article.
References
-
- Agarwal V., Inoue F., Schubach M., Martin B.K., Dash P.M., Zhang Z., Sohota A., Noble W.S., Yardimci G.G., Kircher M. et al. . Massively parallel characterization of transcriptional regulatory elements in three diverse human cell types. 2023; bioRxiv doi:06 March 2023, preprint: not peer reviewed10.1101/2023.03.05.531189. - DOI
-
- Deng C., Whalen S., Steyert M., Ziffra R., Przytycki P.F., Inoue F., Pereira D.A., Capauto D., Norton S., Vaccarino F.M. et al. . Massively parallel characterization of psychiatric disorder-associated and cell-type-specific regulatory elements in the developing human cortex. 2023; bioRxiv doi:16 February 2023, preprint: not peer reviewed10.1101/2023.02.15.528663. - DOI - PubMed
MeSH terms
Substances
Grants and funding
LinkOut - more resources
Full Text Sources
Molecular Biology Databases
