. 2024 Mar 21;52(5):2446-2462.
doi: 10.1093/nar/gkae049.

Large-scale duplication events underpin population-level flexibility in tRNA gene copy number in Pseudomonas fluorescens SBW25

Affiliations

Large-scale duplication events underpin population-level flexibility in tRNA gene copy number in Pseudomonas fluorescens SBW25

Zahra Khomarbaghi et al. Nucleic Acids Res. .

Abstract

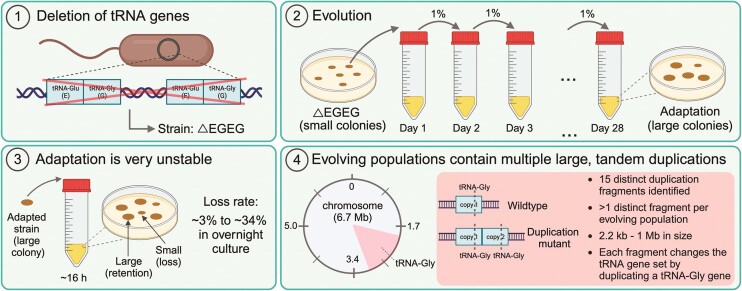
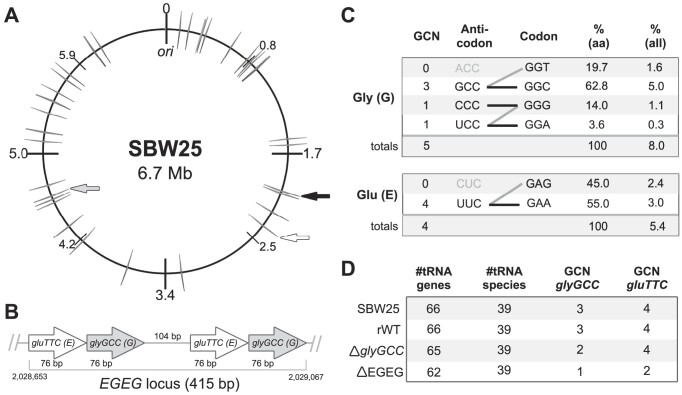
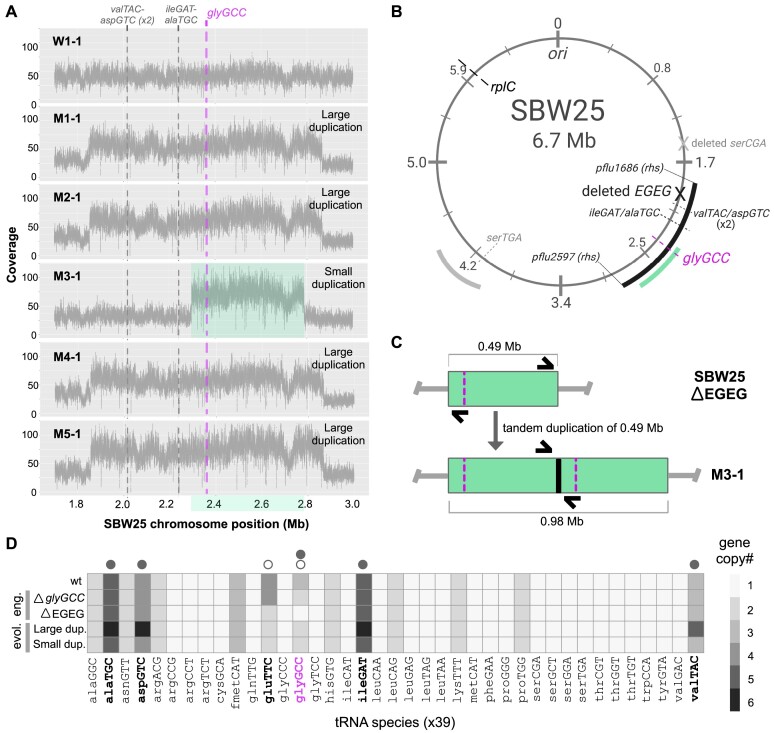
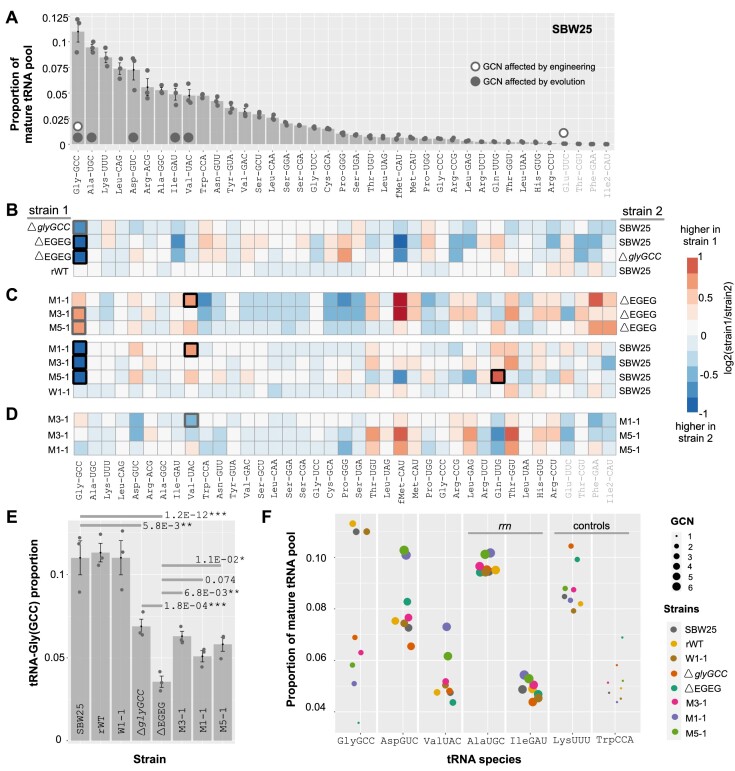
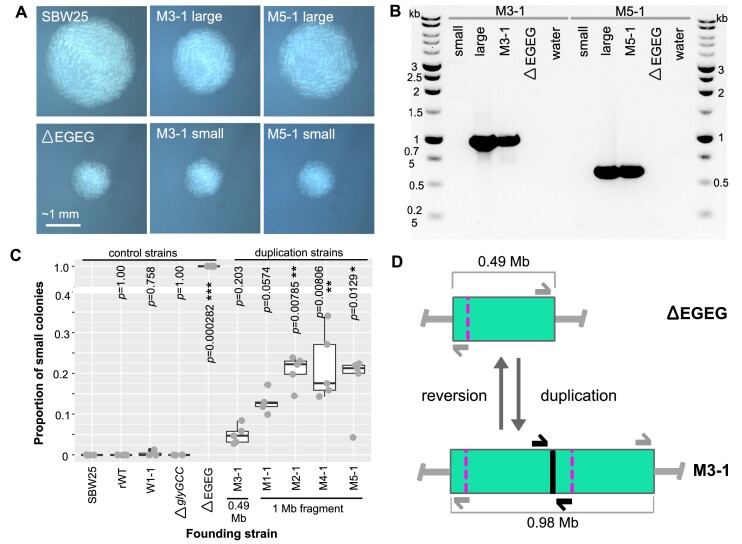
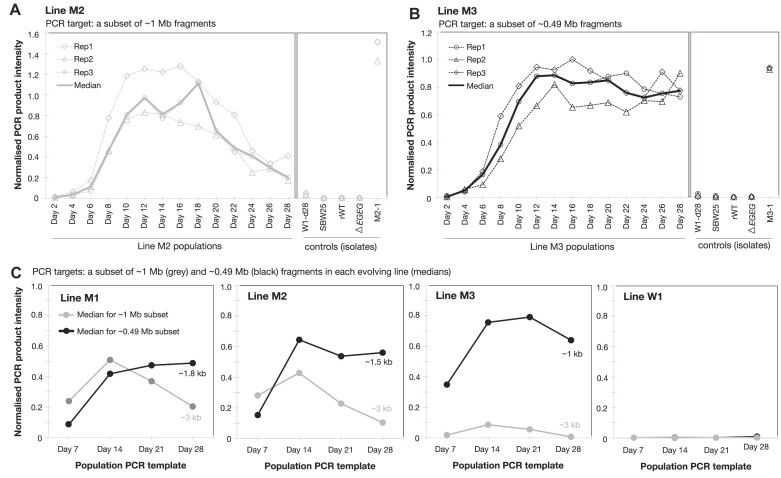
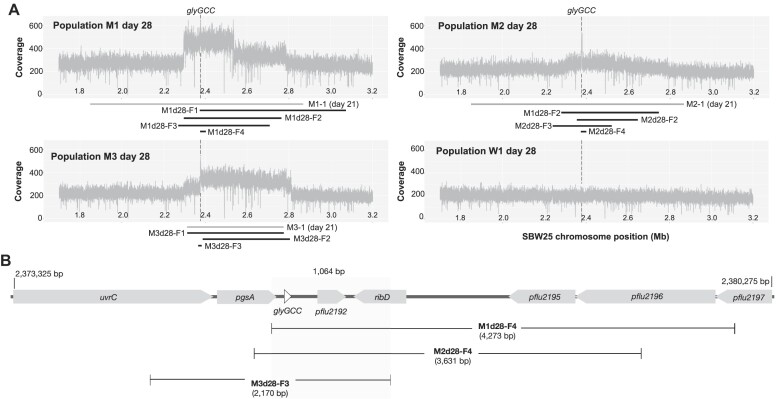
The complement of tRNA genes within a genome is typically considered to be a (relatively) stable characteristic of an organism. Here, we demonstrate that bacterial tRNA gene set composition can be more flexible than previously appreciated, particularly regarding tRNA gene copy number. We report the high-rate occurrence of spontaneous, large-scale, tandem duplication events in laboratory populations of the bacterium Pseudomonas fluorescens SBW25. The identified duplications are up to ∼1 Mb in size (∼15% of the wildtype genome) and are predicted to change the copy number of up to 917 genes, including several tRNA genes. The observed duplications are inherently unstable: they occur, and are subsequently lost, at extremely high rates. We propose that this unusually plastic type of mutation provides a mechanism by which tRNA gene set diversity can be rapidly generated, while simultaneously preserving the underlying tRNA gene set in the absence of continued selection. That is, if a tRNA set variant provides no fitness advantage, then high-rate segregation of the duplication ensures the maintenance of the original tRNA gene set. However, if a tRNA gene set variant is beneficial, the underlying duplication fragment(s) may persist for longer and provide raw material for further, more stable, evolutionary change.


Figures

Graphical Abstract
Graphical Abstract
Figure 1.
Figure 1.
Translation of glycine (G) and glutamic acid (E) in P. fluorescens SBW25. (A) Cartoon of the SBW25 chromosome depicting loci predicted by GtRNAdb2.0 to encode canonical tRNAs. Grey lines = tRNA loci (each representing between one and four tRNA genes); black arrow = gluTTC-glyGCC-gluTTC-glyGCC (‘EGEG’) tRNA locus deleted by genetic engineering; white arrow = glyGCC lone tRNA locus (encoding the remaining copy of glyGCC); grey arrow = gluTTC-alaGGC-gluTTC-alaGGC tRNA locus (encoding the remaining two copies of gluTTC). (B) Details of the EGEG tRNA locus indicated by the black arrow in panel A. (C) Putative translational relationships between anticodons and codons for glycine (top) and glutamic acid (bottom). Codons are listed with their cognate anticodons (black = tRNA species encoded in genome; grey = not encoded). Predicted anticodon-codon matching patterns are indicated by joining lines (black = cognate match; grey = wobble match). Percentage contribution of each codon to (i) the relevant amino acid (% aa), and (ii) all amino acids, is provided to 1 d.p. from GtRNAdb2.0 (tRNAscan-SE version 2.0.2; February 2019) (7). (D) Details of the tRNA gene sets carried by engineered genotypes.
Figure 2.
Figure 2.
Deletion of the four gene tRNA locus EGEG reduces SBW25 growth in rich, undefined (KB) and poorer, defined (M9 + glucose) media. (AB) Colonies of SBW25, reconstructed wildtype (the engineering control, rWT), and the two engineered genotypes ΔglyGCC and ΔEGEG at room temperature for 30 h on KB agar, or 72 h on M9 agar. Scale bar applies to all four images in each panel. (CD) Growth (measured as absorbance at 600 nm) of the same genotypes in liquid KB for 8 h, or M9 for 16 h. Lines show the mean of 7 replicates at 5-minute intervals; error bars are ± 1 SE. (E–H) Maximum growth rates (change in absorbance; mOD min−1) and lag times of growth profiles in panel C (KB), and panel D (M9). In all four panels, red and blue lines are the medians of SBW25 and ΔEGEG, respectively. Non-parametric Dunn's tests, followed by the Benjamini-Hochberg procedure to correct for multiple comparisons, were used to test for a difference in medians between pairs of genotypes in each panel. Stars indicate statistically significant P-values for a difference from SBW25 (red stars) or ΔEGEG (blue stars).
Figure 3.
Figure 3.
The growth defect caused by deleting four-gene tRNA locus gluTTC-glyGCC-gluTTC-glyGCC (EGEG) undergoes repeated compensation during a serial transfer experiment. (A) Colonies of founders SBW25, ΔEGEG, and six genotypes from day 21 of the serial transfer evolution experiment, grown on KB agar for 30 h at room temperature. Scale bar applies to all images. (B) Growth in liquid KB culture. Lines show the mean of 7 replicates at 5-minute intervals; error bars are ± 1 SE. (CD) Maximum growth rate (change in absorbance; mOD min−1) and lag time for each growth profile in panel B. In both panels, red and blue lines are the medians of SBW25 and ΔEGEG, respectively. Non-parametric Dunn's tests, followed by the Benjamini-Hochberg procedure to correct for multiple comparisons, were used to test for a difference in medians between pairs of genotypes. Stars indicate statistically significant P-values for a difference from SBW25 (red stars) or ΔEGEG (blue stars). The data for SBW25, rWT and ΔEGEG also appears in Figure 2. (E) Box plots of the relative fitness of competitor 1 (x-axis) and competitor 2 (horizontal bars at top). Direct, one-to-one competitions were performed in liquid KB for 24 h (28°C, shaking). Between 5 and 8 replicate competitions were performed for each genotype pair. Relative fitness >1 means that the first competitor wins, <1 means that the second competitor wins. Statistically significant deviations of relative fitness from 1 were determined using either one-tailed one-sample t-tests, followed by a Benjamini-Hochberg correction for multiple comparisons. Data points from all replicates are overlaid on boxplots, and ***P< 0.001, **P <0.01, *P< 0.05.
Figure 4.
Figure 4.
Large-scale, tandem duplications compensate for the deletion of EGEG. (A) Number of raw sequencing reads covering 1.8–3.0 Mb of the reference genome. A jump to 2-fold coverage is evident in the genotypes isolated from mutant populations (M1-1 to M5-1), and not in the control genotype isolated from the representative wildtype population (W1-1). The ∼0.49 Mb region of double coverage shared by all mutants is highlighted in green; tRNA genes are shown by dotted lines. (B) Cartoon depicting the positions of duplicated regions on the SBW25 genome. Black arc = ∼1 Mb duplication (in M1-1, M2-1, M4-1, M5-1); green arc = ∼0.49 Mb duplication (in M3-1); grey arc = distinct ∼0.4 Mb region in which duplication fragments have previously been reported (6). Duplicated tRNA genes are marked by dotted lines; deleted tRNA genes are marked with a cross. Image drawn using BioRender.com. (C) Depiction of the duplication event in M3-1, resulting in an additional ∼0.49 Mb of DNA and double copies of all genes in the duplicated region. Thick black line = duplication junction, which can be amplified using a duplication junction PCR (primer positions in black; see Supplementary Text S2). (D) Heatmap showing differences in the gene copy numbers coding for 39 tRNA species between wildtype (wt), engineered (eng.) and evolved (evol.) genotypes. Open/closed circles = tRNA species whose gene copy number changed by engineering/evolution.
Figure 5.
Figure 5.
glyGCC gene copy number changes are mirrored in the mature tRNA pool. (A) Proportions of the 39 tRNA species in the SBW25 mature tRNA pool (highest to lowest). Light grey = excluded tRNA species. Open / closed circles = tRNA species whose gene copy number (GCN) changes by engineering / evolution in downstream experiments. (B—D) Heatmaps of differences in tRNA species proportions (expressed as log2-fold change(strain1/strain2); see Supplementary Table S5) between genotype pairs, to detect the effect of engineering (panel B) and evolution (panels C, D). Box outlines indicate statistical significance (DESeq2 adjusted P-values; thin line P> 0.01; thick grey line 0.01 < P> 0.001; thick black line P< 0.001). (E) Bar graph of tRNA-Gly(GCC) proportion by genotype. Bars = means of three replicates ±1 SE. DESeq2 adjusted P-values show tRNA-Gly(GCC) differences between genotypes pairs. (F) Scatter plot of mean proportions ±1 SE of seven tRNA species, by genotype. GCN for the first five tRNA species varies by engineering and/or evolution (indicated by point size), while the final two tRNA species are controls (constant GCN). rrn= tRNA species genes co-localize with rRNA operons.
Figure 6.
Figure 6.
The large-scale, tandem duplications are rapidly lost in overnight culture. (A) Two colony morphologies – large and small—are observed when plating from overnight cultures of duplication-carrying genotypes (colonies from duplication genotypes M3-1 and M5-1 are presented here). All images taken under the same magnification after ∼48 h incubation on KB agar at room temperature (∼21°C). Scale bar applies to all images in panel. (B) Small colonies no longer amplify the unique junction introduced by the relevant duplication fragment (illustrated by the thick black lines in M3-1 cartoon of panel D). (C) Duplication fragment loss was quantified as the proportion of small colonies when plating from an overnight culture. Five replicates were included per genotype, and at least 41 colonies were counted per replicate. Boxplots summarize the data (medians), and grey dots are individual replicates. Statistical significance of a difference in the median proportion of small colonies compared to SBW25 (wildtype) was calculated using a Dunn test (with Benjamini-Hochberg correction for multiple comparisons). Significance levels: *0.05 < P< 0.001, **0.01 < P< 0.001, ***P< 0.001. (D) Cartoon depicting the gain and loss of duplication fragments, leading to a mixed population of the duplication genotype (here, M3-1) and ΔEGEG.
Figure 7.
Figure 7.
The complex evolutionary dynamics of large-scale duplication fragments in evolving mutant populations. Duplication junction PCRs were used to follow the dynamics of subsets of ∼1 Mb and ∼0.49 Mb duplications across evolving populations. The intensity of the PCR product obtained across each emergent duplication junction was measured relative to a PCR product amplified from a control region located outside of the genomic region affected by duplication events. Various control samples—in which (almost) all or none of the population is expected to carry duplication fragments—were included in each set of PCRs (see Methods for further details). The subsets of ∼1 Mb (A; primer pair M1and2_junct_f/M5_junct_r) and ∼0.49 Mb (B; primer pair M3_junct_f/r) duplications show different evolutionary trajectories in the lines in which they were originally identified; the ∼1 Mb fragment rises and then wanes in line M2, while the ∼0.49 Mb fragment rises to, and is maintained for longer at, a high level in line M3. (C) Multiple duplication fragments arise and compete within evolving populations. Each PCR was performed in triplicate, and the median is presented (for full data sets see Supplementary Figure S5A; Supplementary Table S6).
Figure 8.
Figure 8.
Eleven distinct duplication fragments are detected in mutant lines M1, M2 and M3 on day 28 of the evolution experiment. (A) Number of raw sequencing reads covering 1.7–3.2 Mb of the reference genome, shown for the three mutant lines (M1, M2, M3) and one representative wildtype control line (W1) on day 28. Large changes in coverage can be seen in all mutant populations (but not the wildtype population). The black bars below each plot indicate approximate positions of each computationally predicted duplication (see Table 2); grey bars show the duplication identified in the corresponding day 21 isolate (see Table 1). (B) Structure of the ∼7 kb genomic region containing the three smallest duplication fragments. Grey highlighting indicates the 1064 bp that is duplicated in all three fragments. This region contains two complete genes: tRNA gene glyGCC and predicted pseudogene pflu2192 (see Supplementary Table S3).

Similar articles

Cited by

References

    1. Gingold H., Pilpel Y. Determinants of translation efficiency and accuracy. Mol. Syst. Biol. 2011; 7:481. - PMC - PubMed
    1. Rak R., Dahan O., Pilpel Y. Repertoires of tRNAs: the couplers of genomics and proteomics. Annu. Rev. Cell Dev. Biol. 2018; 34:239–264. - PubMed
    1. Abbott J.A., Francklyn C.S., Robey-Bond S.M. Transfer RNA and human disease. Front. Genet. 2014; 5:158. - PMC - PubMed
    1. Lant J.T., Berg M.D., Heinemann I.U., Brandl C.J., O’Donoghue P Pathways to disease from natural variations in human cytoplasmic tRNAs. J. Biol. Chem. 2019; 294:5294–5308. - PMC - PubMed
    1. Knight J.R.P., Garland G., Poyry T., Mead E., Vlahov N., Sfakianos A., Grosso S., De-Lima-Hedayioglu F., Mallucci G.R., Von Der Haar T. et al. . Control of translation elongation in health and disease. Dis. Model Mech. 2020; 13:dmm043208. - PMC - PubMed