. 2024 Jan 31;15(1):945.
doi: 10.1038/s41467-024-45143-z.

Effect of aging on the human myometrium at single-cell resolution

Affiliations

Effect of aging on the human myometrium at single-cell resolution

Paula Punzon-Jimenez et al. Nat Commun. .

Abstract

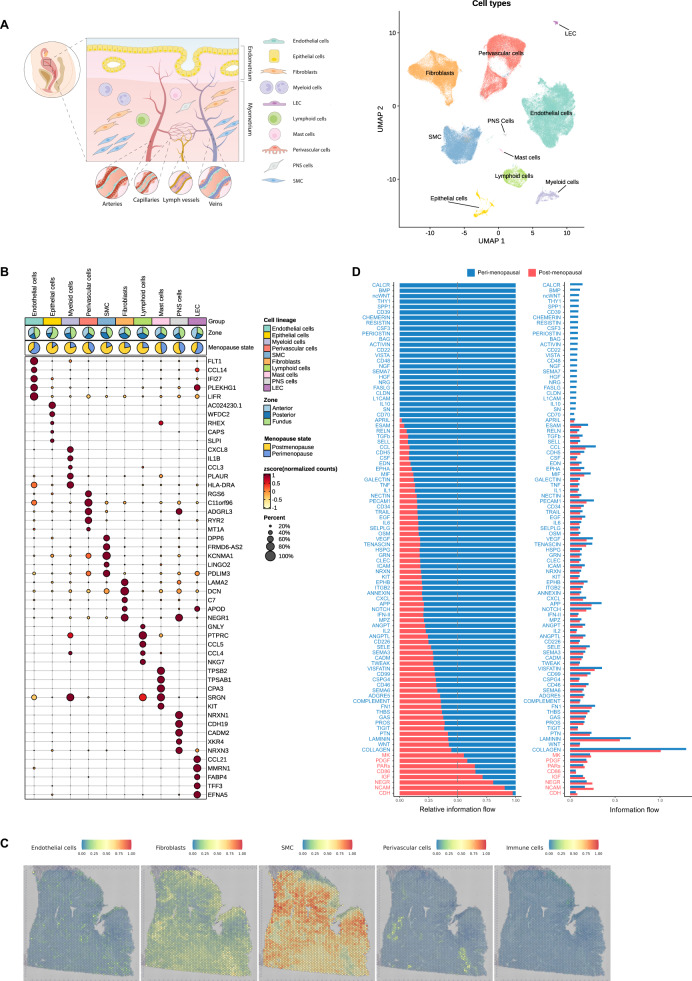
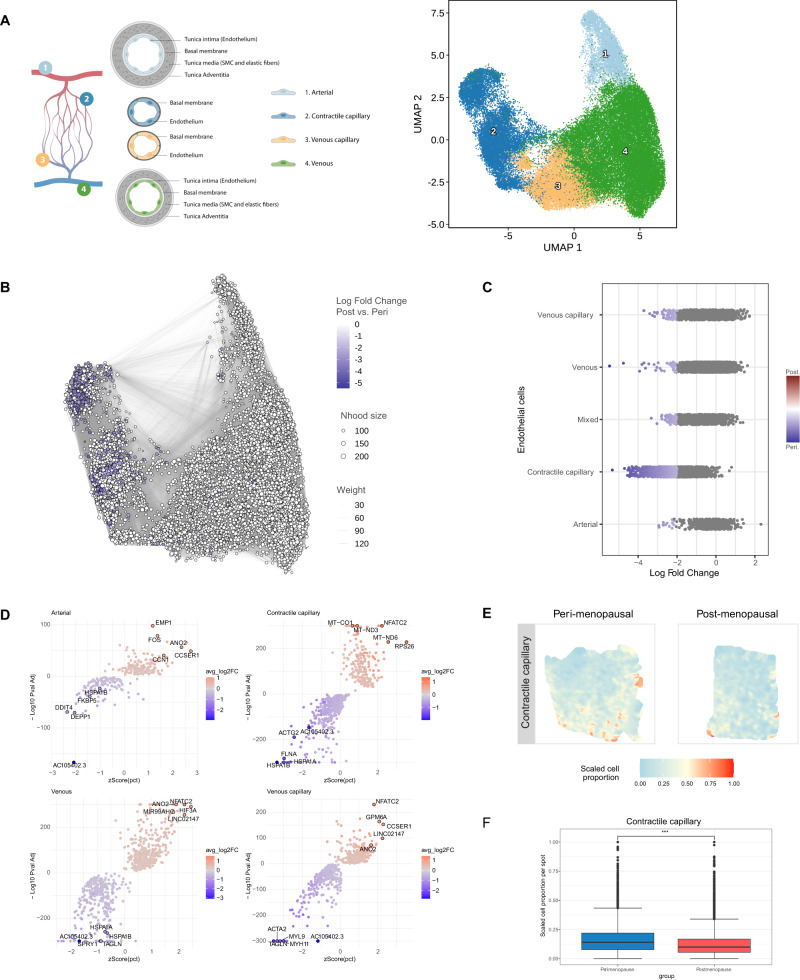
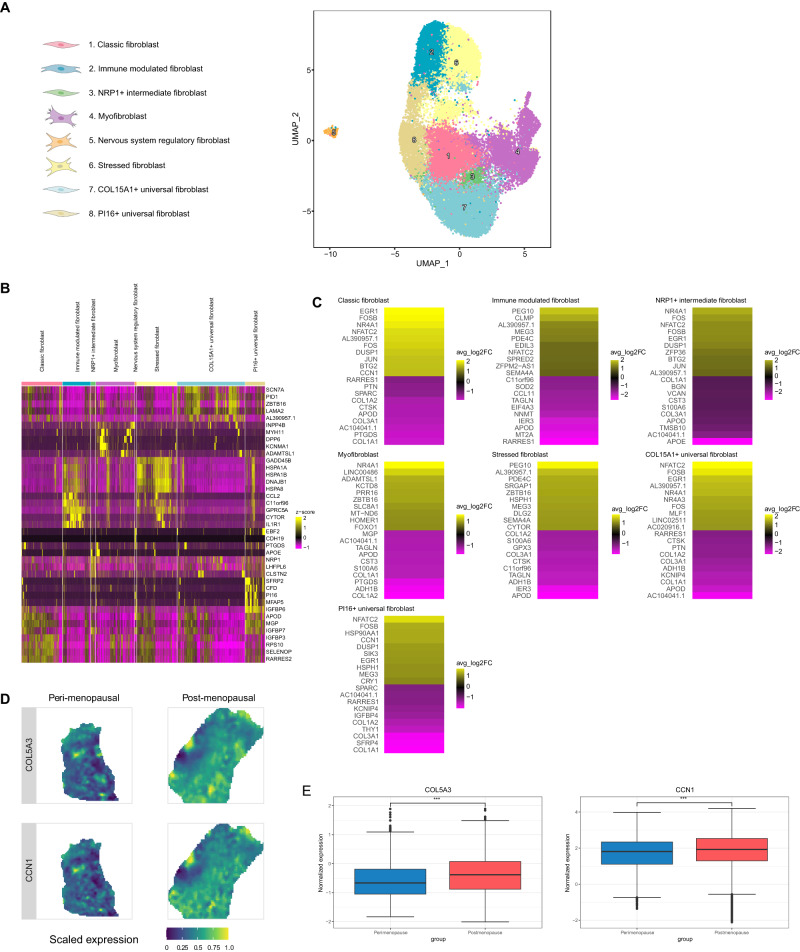
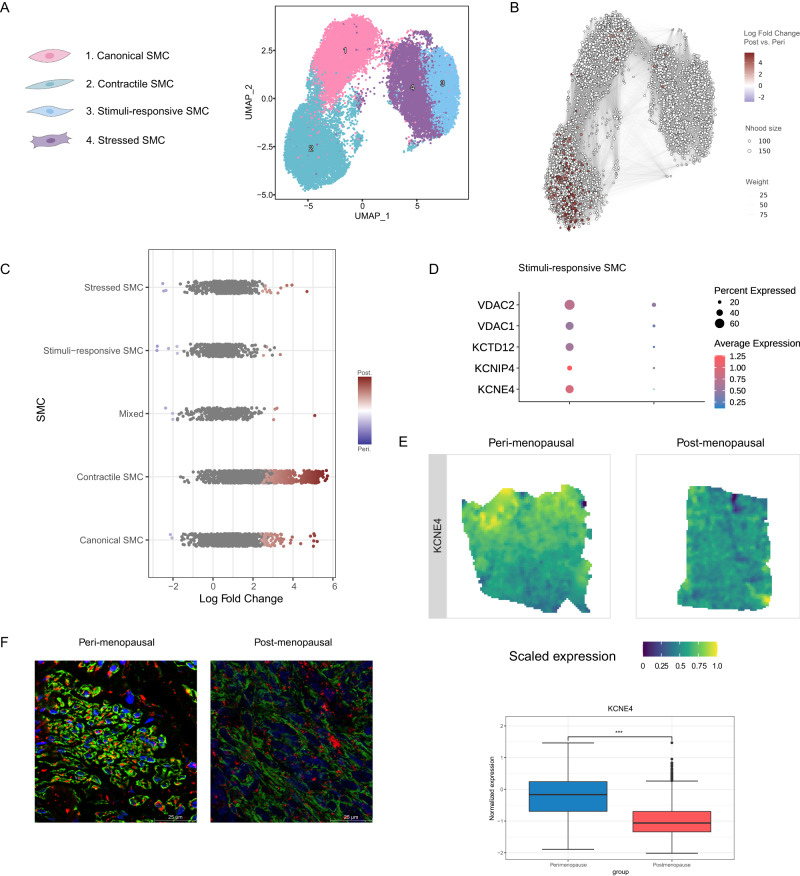
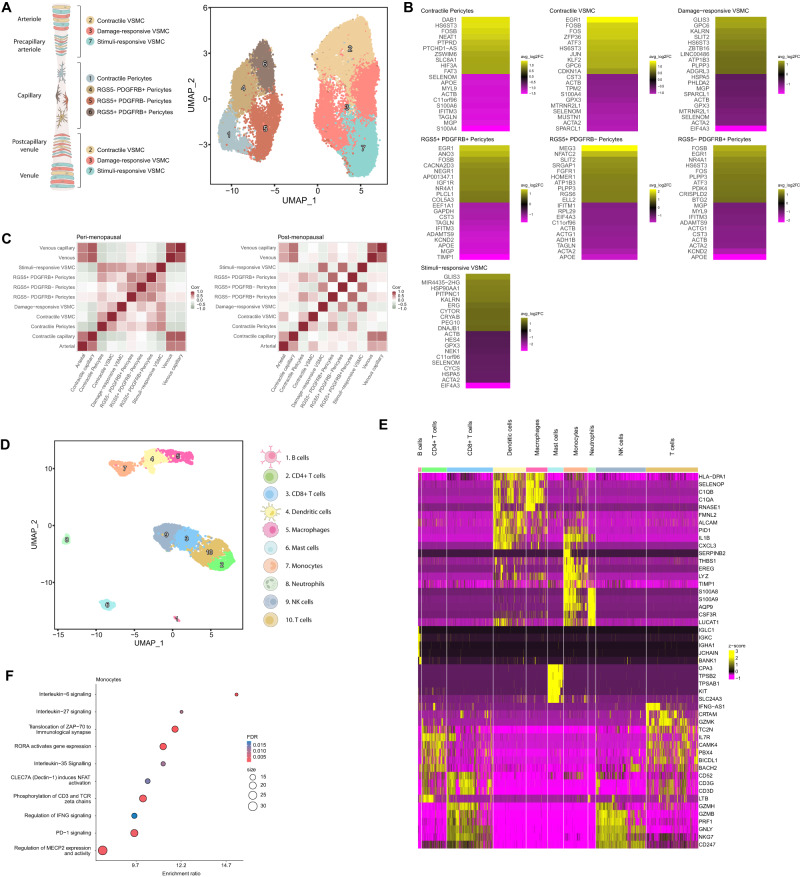
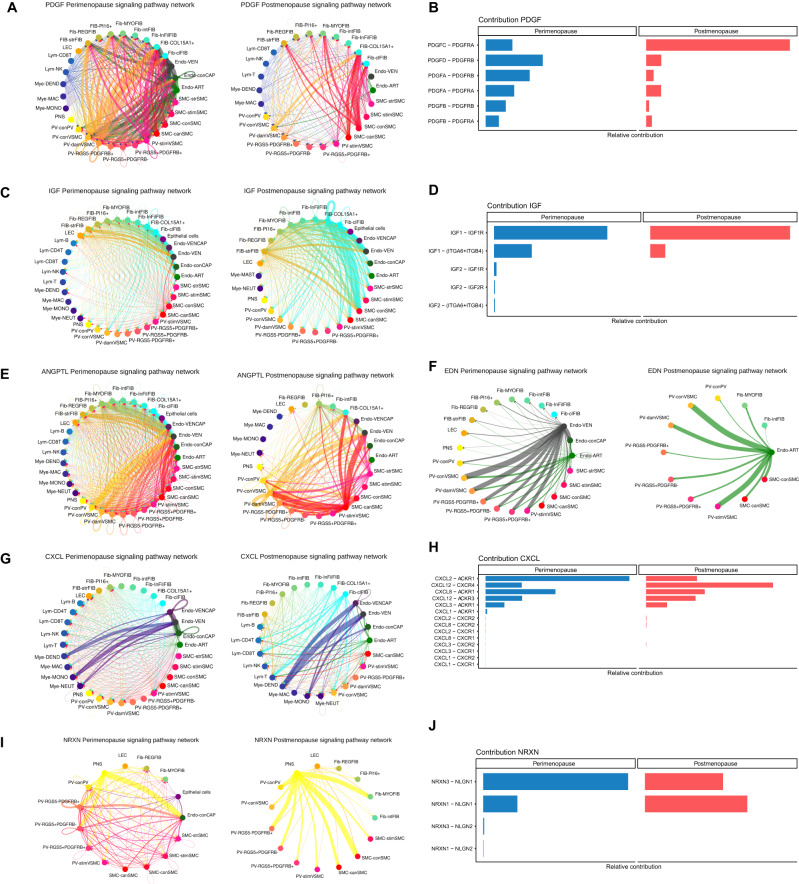
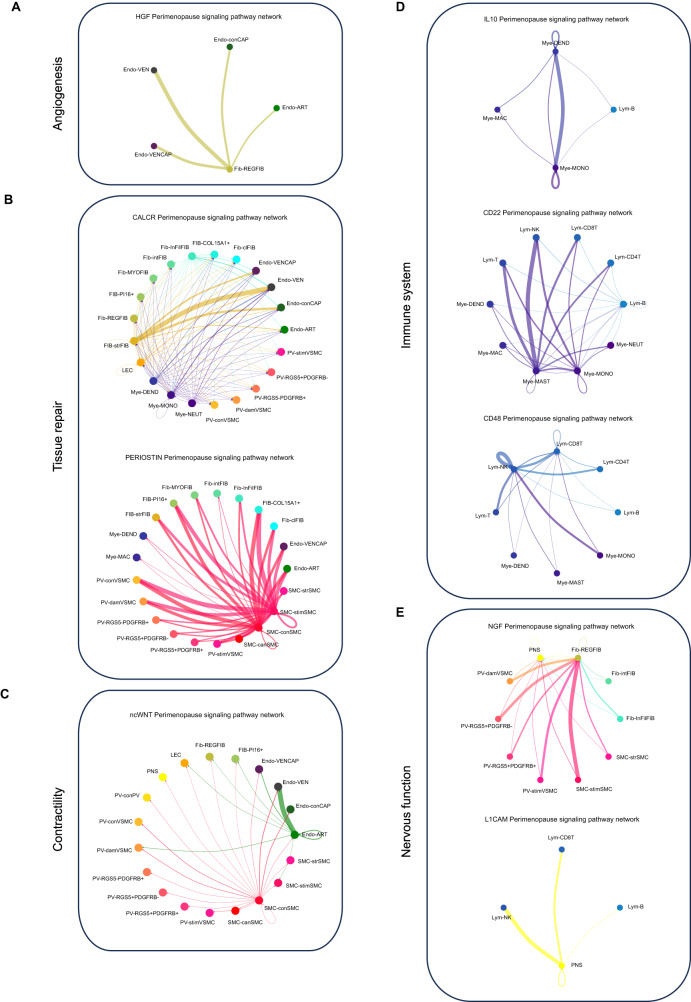
Age-associated myometrial dysfunction can prompt complications during pregnancy and labor, which is one of the factors contributing to the 7.8-fold increase in maternal mortality in women over 40. Using single-cell/single-nucleus RNA sequencing and spatial transcriptomics, we have constructed a cellular atlas of the aging myometrium from 186,120 cells across twenty perimenopausal and postmenopausal women. We identify 23 myometrial cell subpopulations, including contractile and venous capillary cells as well as immune-modulated fibroblasts. Myometrial aging leads to fewer contractile capillary cells, a reduced level of ion channel expression in smooth muscle cells, and impaired gene expression in endothelial, smooth muscle, fibroblast, perivascular, and immune cells. We observe altered myometrial cell-to-cell communication as an aging hallmark, which associated with the loss of 25 signaling pathways, including those related to angiogenesis, tissue repair, contractility, immunity, and nervous system regulation. These insights may contribute to a better understanding of the complications faced by older individuals during pregnancy and labor.


Conflict of interest statement

The authors declare no competing interests.

Figures

Fig. 1
Fig. 1. Integrated Single-Cell Atlas of the Human Myometrium.
A Schematic representation of the human uterus and identified cell types within the myometrium (left). Visualization of uniform manifold approximation and projection (UMAP) showing an integrative clustering of high-quality cells/nuclei from human myometria (perimenopausal, n = 6; postmenopausal, n = 14) at 0.5 resolution (right). B Dotplot indicating the relative expression of each identified cell type’s top five discriminatory genes (color indicates average expression, while dot size represents the percentage of cells expressing specific genes). Pie charts illustrate the proportion of cells according to menopausal state (perimenopause in blue, postmenopause in yellow) and myometrial zone (light blue -anterior region, dark blue - posterior region, and green - fundus). C Panels displaying the spatial location of endothelial cells, fibroblasts, SMCs, PV cells, and immune cells in the myometrium. D Relative and absolute flows of differentially active signaling pathways during myometrial aging (comparing perimenopausal and postmenopausal myometria). LECs lymphatic endothelial cells, PNS peripheral nervous system, SMCs smooth muscle cells.
Fig. 2
Fig. 2. Endothelial Dysfunction in the Aging Myometrium.
A Schematic representation of the endothelial cells (left) and UMAP visualization of the principle endothelial subpopulations in the myometrium at 0.5 resolution (right). B Neighborhood graph highlighting the differential abundance of endothelial cells in the aging myometrium. Dot size represents neighborhoods, while edges depict the number of cells shared between neighborhoods. Neighborhoods colored in blue represent those with a significant decrease in cell abundance during myometrial aging. C Beeswarm plot of differential cell abundance by cell type. X-axis represents the log-fold change in abundance during myometrial aging. Each dot represents a neighborhood; neighborhoods colored in blue represent those with a significant decrease in cell abundance in postmenopausal myometria. D Volcano plots representing age-related differentially expressed genes in each endothelial cell subpopulation. Positive LogFC indicates overexpression in the postmenopause myometrium, whereas negative LogFC indicates overexpression in the perimenopausal myometrium. The statistical test applied was a MAST test with p-values corrected for multiple comparisons by FDR. E Representative refined spatial maps of contractile capillary cells in the perimenopausal (left) and postmenopausal (right) myometrium (n = 3 peri and 5 post-menopausal samples). Colors represent the scaled proportion of this cell type in each location (red indicates the highest proportion of contractile capillary cells in that tissue). F Boxplot of the scaled cell proportions of contractile capillary per spot split in the postmenopausal and perimenopausal myometrium (n = 3 peri and 5 post-menopausal samples; the center line shows the median for the data and error bars extend to the largest and smallest value no further than 1.5 inter-quartile range; Unpaired two-sided Wilcoxon test where ***p value < 2.2e−16). Nhood size Neighborhood size. Source data are provided as a Source Data file.
Fig. 3
Fig. 3. Age-related changes in the myometrial fibroblast population.
A UMAP visualization displaying the fibroblast subpopulations in the myometrium at 0.6 resolution. B Heatmap showing the relative expression of the top five discriminatory genes in each subpopulation. C Heatmap showing the genes with the top ten highest and lowest LogFC values in the postmenopausal vs. perimenopausal myometrium for each subpopulation. Positive LogFC indicates overexpression in the postmenopausal myometrium, whereas negative LogFC indicates overexpression in the perimenopausal myometrium. D Representative refined spatial maps of the expression of COL5A3 and CCN1 in the perimenopausal (left) and postmenopausal (right) myometrium (n = 3 peri and 5 post-menopausal samples). Color indicates expression levels in each spot (yellow indicates the highest expression of each gene in the tissue). E Boxplot of the spatial expression of the collagen COL5A3 (left) and fibroblast senesce marker CCN1 (right) genes in the perimenopausal and postmenopausal myometrium (n = 3 peri and 5 post-menopausal samples; the center line shows the median for the data and error bars extend to the largest and smallest value no further than 1.5 inter-quartile range; Unpaired two-sided Wilcoxon test where ***p value < 2.2e−16). Source data are provided as a Source Data file.
Fig. 4
Fig. 4. Increased abundance but reduced functionality of SMCs accompanies myometrial aging.
A UMAP visualization of the four distinct SMC subpopulations. B Neighborhood graph highlighting the differential abundance of SMCs in the aging myometrium. Neighborhoods colored in dark red represent those with significantly increased abundance in the postmenopausal myometrium at 0.6 resolution. C Beeswarm plot of differential SMC abundance by cell type. D Dot plots representing the differential gene expression of voltage channel encoding genes during myometrial aging in stimuli-response SMCs. Dot size indicates the percentage of stimuli-response SMC that express the gene, while color indicates average expression. E Spatial expression (top) and boxplot (bottom) of potassium voltage-gated channel gene KCEN4 in representative refined spatial maps of perimenopausal (n = 3; left) and postmenopausal (n = 5; right) myometrium, where color indicates expression levels in each spot (the center line shows the median for the data and error bars extend to the largest and smallest value no further than 1.5 inter-quartile range; Unpaired two-sided Wilcoxon test where ***p value < 2.2e−16). F Representative inmunofluorescence image of ACTA2 (green) and VDAC1/2 (red) in peri (n = 3; left) and postmenopause (n = 3; right). Scale bar = 25 µm. SMC smooth muscle cells, Nhood size Neighborhood size, ACTA2 Actin Alpha 2, VDAC1/2 Voltage-dependent anion-selective channel 1/2. Source data are provided as a Source Data file.
Fig. 5
Fig. 5. Impairments in the Myometrial Perivascular and Immune Cell Populations Associated with Myometrial Aging.
A Schematic representation of PV subtypes surrounding the myometrial microvasculature from the arteriole to the venule: arterioles and venules are surrounded by a single layer of contractile VSMCs, while pericytes (characterized by a stellate shape) are usually found surrounding smaller and transitional vessels such as precapillary arterioles and postcapillary venules. Contractile pericytes provide support in capillaries (left). UMAP visualization displaying the PV subpopulations at 0.8 resolution (right). B Heatmap showing the genes with the top ten highest and lowest LogFC values in the postmenopausal vs. perimenopausal myometrium for each PV subpopulation. Positive LogFC indicates overexpression in the postmenopausal myometrium, whereas negative LogFC indicates overexpression in the perimenopausal myometrium. C Correlation of the spatial distribution of endothelial and PV cell populations in the perimenopausal (left) and postmenopausal (right) myometrium, with color scaled by correlation value (darker red indicates a higher correlation between the location of the indicated cell types). D UMAP visualization displaying the immune cell sub-clusters present in the myometrium at 0.5 resolution. E Heatmap showing the relative expression of the top five discriminatory genes in each subpopulation. F Dotplot showing the representative biological processes and pathways affected in monocytes during myometrial aging based on differential gene expression. Significant over-representation of biological processes and pathways (color intensity) shown by each gene set (dot size) from perimenopausal and postmenopausal monocytes. VSMC vascular smooth muscle cells, NK natural killer, FDR false discovery rate.
Fig. 6
Fig. 6. Age-related changes in myometrial cell-to-cell communication.
Arrows between cell types are colored according to the cell type emitting the signal. The relative thickness of each line depicts the expression-based strength of the interaction between cell types. CCC chord plots for A PDGF, C IGF, E ANGPTL, F EDN, G CXCL and I NRXN signaling pathways in the perimenopausal (left) and postmenopausal myometrium (right). The relative contribution of ligand-receptor pairs to CCC in the B PDGF, D IGF, H CXCL, and J NRXN signaling pathways in the perimenopausal (left) and postmenopausal myometrium (right). PDGF platelet-derived growth factor, IGF insulin growth factor, ANGPTL angiopoietin-like, EDN endothelin, CXCL C-X-C Motif Chemokine Ligand, NRXN nerve transmission-associated neurexin, Fib fibroblasts, Endo endothelial, SMC smooth muscle cells, VSMC vascular smooth muscle cells, PV perivascular, LEC lymphatic endothelium, Mye myeloid, Lym lymphoid, VEN venous, ART arterial, str stressed, stim stimuli-response, con contractile, can canonical, dam damage-response, MAC macrophages, DEND dendritic, NK natural Killer, MONO monocytes, NEUT neutrophils, REG nervous system regulatory fibroblast, MYO myofibroblast, int NRP1 intermediate, Inf immune modulated fibroblast, Cl classic.
Fig. 7
Fig. 7. Lost Signaling Pathways in the Aging Myometrium.
CCC chord diagrams displaying signaling pathways active in the perimenopausal myometrium but lost during aging, including those related to A angiogenesis (HGF), B homeostasis and tissue repair (CALCR, PERIOSTIN), C contractility (ncWNT), D immune processes (IL10, CD22, CD48) and E nervous system regulation (NGF, L1CAM). Arrows between cell types show the direction of the interactions and follow the color code of cell types commonly detected in menopause. The relative thickness of each line depicts the expression-based strength of the interaction between cell types.

References

    1. Beard JR, et al. The World report on ageing and health: A policy framework for healthy ageing. Lancet. 2016;387:2145–2154. doi: 10.1016/S0140-6736(15)00516-4. - DOI - PMC - PubMed
    1. Kontis V, et al. Future life expectancy in 35 industrialised countries: projections with a Bayesian model ensemble. Lancet. 2017;389:1323–1335. doi: 10.1016/S0140-6736(16)32381-9. - DOI - PMC - PubMed
    1. Wu Y, Li M, Zhang J, Wang S. Unveiling uterine aging: Much more to learn. Ageing Res Rev. 2023;86:101879. doi: 10.1016/j.arr.2023.101879. - DOI - PubMed
    1. Ledford H. How the run-up to menopause changes the brain. Nature. 2023;617:25–27. doi: 10.1038/d41586-023-01474-3. - DOI - PubMed
    1. Say L, et al. Global causes of maternal death: A WHO systematic analysis. Lancet Glob. Health. 2014;2:e323–e333. doi: 10.1016/S2214-109X(14)70227-X. - DOI - PubMed