. 2024 Feb 1;15(1):953.
doi: 10.1038/s41467-024-45206-1.

Mitochondrial protein C15ORF48 is a stress-independent inducer of autophagy that regulates oxidative stress and autoimmunity

Affiliations

Mitochondrial protein C15ORF48 is a stress-independent inducer of autophagy that regulates oxidative stress and autoimmunity

Yuki Takakura et al. Nat Commun. .

Abstract

Autophagy is primarily activated by cellular stress, such as starvation or mitochondrial damage. However, stress-independent autophagy is activated by unclear mechanisms in several cell types, such as thymic epithelial cells (TECs). Here we report that the mitochondrial protein, C15ORF48, is a critical inducer of stress-independent autophagy. Mechanistically, C15ORF48 reduces the mitochondrial membrane potential and lowers intracellular ATP levels, thereby activating AMP-activated protein kinase and its downstream Unc-51-like kinase 1. Interestingly, C15ORF48-dependent induction of autophagy upregulates intracellular glutathione levels, promoting cell survival by reducing oxidative stress. Mice deficient in C15orf48 show a reduction in stress-independent autophagy in TECs, but not in typical starvation-induced autophagy in skeletal muscles. Moreover, C15orf48-/- mice develop autoimmunity, which is consistent with the fact that the stress-independent autophagy in TECs is crucial for the thymic self-tolerance. These results suggest that C15ORF48 induces stress-independent autophagy, thereby regulating oxidative stress and self-tolerance.


Conflict of interest statement

The authors declare no competing interests.

Figures

Fig. 1
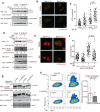
Fig. 1. C15ORF48 expression activates AMPK-ULK1 signaling.
a A549 cells stably expressing C15ORF48 (A549/C15ORF48) or the empty (A549/empty) vector were fixed and stained with anti-C15ORF48 antibody and MitoTracker. Nuclei were counter-stained with TO-PRO-3. Representative images are shown from three independent experiments. b A549/empty and A549/C15ORF48 cells were analyzed for mitochondrial membrane potential by staining with TMRM (30 nM) for 30 min. Median TMRM fluorescence intensities are shown as the mean ± SD. Statistical significance was calculated using two-tailed unpaired Student’s t test (n = 3, biological replicates). c A549/empty and A549/C15ORF48 cells were analyzed for intracellular ATP levels. ATP amount in a cell is shown as the mean ± SD. Statistical significance was calculated using two-tailed unpaired Student’s t test (n = 3, biological replicates). d A549/empty and A549/C15ORF48 cells were lysed and subjected to western blotting with indicated antibodies. Band intensity was measured, and quantitative ratios are shown. Data are representative of three independent experiments with three biological replicates.
Fig. 2
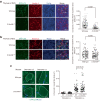
Fig. 2. C15ORF48 expression activates autophagy independently of starvation or mitochondrial stress.
a A549/empty and A549/C15ORF48 cells were treated with bafilomycin A1 (Baf A1, 200 μM, 1 h) or untreated 3 h after replacement of culture media and then subjected to western blotting as in Fig. 1d. b, c A549/empty and A549/C15ORF48 cells were treated with bafilomycin A1 (Baf A1, 200 μM, 1 h) or untreated 3 h after replacement of culture media. Cells were fixed and stained with anti-LC3 antibodies. Nuclei were counter-stained with PI (b). Numbers of LC3 puncta in each cell were calculated and are shown as means ± SDs. Statistical significance was calculated using two-way ANOVA followed by Tukey’s multiple comparisons test (n = 70 cells from two independent experiments) (c). d A549/empty and A549/C15ORF48 cells were incubated for 4 h after replacement of culture media with fresh media containing DMSO (0.1%) or SBI-0206965 (SBI, 10 μM). After incubation, cells were subjected to western blotting as in Fig. 1d. e, f A549/C15ORF48 cells were treated with bafilomycin A1 (Baf A1, 200 μM, 1 h) or left untreated 3 h after replacement of culture media with fresh media containing DMSO (0.1%) or SBI-0206965 (SBI, 10 μM). Cells were fixed and stained with anti-LC3 antibody. LC3 puncta and nuclei were visualized as in Fig. 2b (e). Numbers of LC3 puncta in each cell were calculated as shown in Fig. 2c. Statistical significance was calculated using two-way ANOVA followed by Tukey’s multiple comparisons test (n = 70 cells from two independent experiments) (f). g A549/empty and A549/C15ORF48 cells were unstarved or starved with HBSS (3 h) 1 h after replacement of culture media and then subjected to western blotting as in Fig. 1d. h A549/empty and A549/C15ORF48 cells were treated with Mitophagy dye, and Mitophagy dye-positive cells (boxed areas) were detected by flow cytometry (left). Percentages of mitophagy dye-positive cells in CCCP-untreated cells, which show basal mitophagy levels, are shown as the mean ± SD (right). Statistical significance was calculated using two-tailed unpaired Student’s t test (n = 5, biological replicates). Not significant, N.S.
Fig. 3
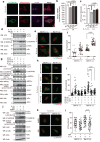
Fig. 3. Induction of endogenous C15ORF48 increases autophagy.
a A549 cells were stimulated with IL-1α (10 ng/mL) or unstimulated for 24 h. After incubation, cells were fixed and stained with anti-C15ORF48 antibody and MitoTracker. Nuclei were counter stained with TO-PRO-3. Representative images are shown from three independent experiments. b, c A549 cells were transfected with the indicated siRNAs for 48 h and then stimulated with IL-1α (10 ng/mL) or unstimulated for 24 h. After incubation, median TMRM (b) or ATP amount in a cell (c) was analyzed and is shown as mean ± SD. Statistical significance was calculated using two-way ANOVA followed by Tukey’s multiple comparisons test (n = 3, biological replicates). d, e, f A549 cells were stimulated or unstimulated with IL-1α (10 ng/mL) for 20 h. After incubation, media were replaced with fresh media with or without IL-1α for an additional 4 h. Half the samples were treated with bafilomycin A1 (Baf A1, 200 μM) for the final 1 h. After incubation, cells were subjected to western blotting as in Fig. 1d (d). Alternatively, cells were fixed and analyzed for LC3 puncta by immunocytochemistry, as in Fig. 2b, c. Statistical significance was calculated using two-way ANOVA followed by Tukey’s multiple comparisons test (n = 70 cells from two independent experiments) (e, f). g, h, i As in Fig. 3d, e, f, except that cells were transfected with the indicated siRNAs for 48 before IL-1α stimulation. j, k, l A549 cells were stimulated or unstimulated with IL-1α (10 ng/mL) for 20 h. After incubation, media were replaced with fresh media together with or without IL-1α for an additional 4 h. Some samples were treated with DMSO (0.1%) or SBI-0206965 (SBI, 10 μM) for the final 4 h. Cells were used for western blotting (j) and LC3 puncta analysis by immunocytochemistry (k, l), as in Fig. 3d, e, f.
Fig. 4
Fig. 4. High expression of endogenous C15ORF48 enhances autophagy.
a A549 and MDA-MB-231 cells were lysed and subjected to western blotting with the indicated antibodies. Data are representative of three independent experiments with three biological replicates. b, c As in Fig. 2b, c, except that A549 and MDA-MB-231 cells were used. Statistical significance was calculated using two-way ANOVA followed by Tukey’s multiple comparisons test (n = 70 cells from two independent experiments). d MDA-MB-231 cells were transfected with the indicated siRNAs for 48 h. After incubation, cells were used for ATP assays. ATP amount in a cell is shown as means ± SDs. Statistical significance was calculated using two-way ANOVA followed by Tukey’s multiple comparisons test (n = 3, biological replicates). e MDA-MB-231 cells were transfected with the indicated siRNAs for 48 h. 44 h after transfection, media were replaced with fresh media. After incubation, cells were lysed and subjected to western blotting, as in Fig. 1d. f, g MDA-MB-231 cells were transfected with the indicated siRNAs for 48 h. 44 h after transfection, media were replaced with fresh media. Half the samples were treated with bafilomycin A1 (Baf A1, 200 μM) for the final 1 h. Cells were fixed and analyzed for LC3 puncta by immunocytochemistry, as in Fig. 2b, c. Statistical significance was calculated using two-way ANOVA followed by Tukey’s multiple comparisons test (n = 70 cells from two independent experiments).
Fig. 5
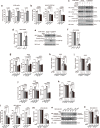
Fig. 5. C15ORF48-induced autophagy protects cells from oxidative stress.
Glutathione concentrations in A549/empty and A549/C15ORF48 cells (a) or A549/C15ORF48 cells transfected with the indicated siRNAs (48 h) (b) are shown as means ± SDs. Statistical significance was calculated using two-tailed unpaired Student’s t test (a) or two-way ANOVA followed by Tukey’s multiple comparisons test (b) (n = 3, biological replicates). c A549/empty and A549/C15ORF48 cells were transfected with the indicated siRNAs (48 h) and subjected to western blotting, as in Fig. 1d. d A549/empty and A549/C15ORF48 cells (20,000 cells/well) were treated with or without H2O2 (300 μM, 18 h) and subjected to an MTT assay. The quantitative ratio of MTT absorbance in H2O2-treated cells normalized to that in untreated cells is shown as the mean ± SD. Statistical significance was calculated using two-tailed unpaired Student’s t test (n = 8, biological replicates). e A549/empty and A549/C15ORF48 cells were treated or untreated with H2O2 (300 μM, 6 h) and subjected to western blotting, as in Fig. 1d. f As in Fig. 5d, except that RSL3 (20 μM, 24 h) was used. g, j A549 cells were transfected with the indicated siRNAs for 24 h. After incubation, cells were treated with IL-1α (10 ng/mL) or untreated for 24 h and subjected to glutathione assays, as in Fig. 5b. h, k As in Fig. 5d, except that A549 cells transfected with the indicated siRNAs (24 h) and treated with or without IL-1α (10 ng/mL, 24 h) were used. Statistical significance was calculated using two-way ANOVA followed by Tukey’s multiple comparisons test (n = 3, biological replicates). i As in Fig. 5h, except that RSL3 (20 μM, 24 h) was used. l As in Fig. 5b, except that MDA-MB-231 cells were used. m As in Fig. 5h, except that MDA-MB-231 cells were used (H2O2, 100 μM, 6 h). n As in Fig. 5e, except that MDA-MB-231 cells transfected with the indicated siRNAs (48 h) were used. o As in Fig. 5m, except that RSL3 (20 μM, 24 h) was used.
Fig. 6
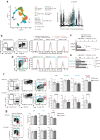
Fig. 6. C15ORF48 is expressed in cTECs and mature mTECs and is involved in development of TECs and mature CD4 single-positive T cells in the thymus.
a Uniform manifold approximation and production (UMAP) plot of scRNA-seq data from TECs (EpCAM+ CD45 TER119) from 4-week-old mice. Cell clusters (R0 to R17) are indicated by colors and numbers in the plot (left). Violin plots depicting expression levels of C15orf48 in each cluster (right). b, c Representative images of flow cytometry plots of cTECs, mTEClo and mTEChi in wild-type mice (b, left). Representative images of MFIs of anti-C15orf48 or isotype control antibodies in mTEClo, mTEChi, and cTEC from 4-week-old wild-type and C15orf48–/– mice (b, right). MFIs of anti-C15orf48 or isotype control antibodies in TECs from wild-type mice were subtracted with those in TECs from C15orf48–/– mice and are shown as means ± SDs. Statistical significance was calculated using two-way ANOVA followed by Tukey’s multiple comparison test (n = 5, biological replicates) (c). d, e As in Fig. 6b, c, except that data of Early-Aire, Late-Aire, and Post-Aire mTEC subfractions are shown, instead of those of cTECs, mTEClo and mTEChi. f Representative images of flow cytometry plots of cTECs, mTEClo, mTEChi and the three mTEC subfractions in 4-week-old wild-type and C15orf48–/– mice (left). Numbers of cTECs, Early-Aire, Late-Aire, and Post-Aire mTECs and their ratios to total thymic cells are shown as means ± SDs. Statistical significance was calculated using two-tailed unpaired Student’s t test (n = 5 (cTECs); n = 7 (mTECs), biological replicates) (right). g Representative images of flow cytometry plots of SM, M1, and M2 CD4SP cells in 4-week-old wild-type and C15orf48–/– mice (left). Numbers of SM, M1, and M2 CD4SP cells and their ratios to total thymocytes are shown as means ± SDs. Statistical significance was calculated using two-tailed unpaired Student’s t test (n = 5, biological replicates) (right).
Fig. 7
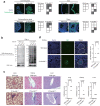
Fig. 7. C15ORF48 is critical for stress-independent autophagy in TECs.
Thymus sections from 4-week-old normal fed wild-type and C15orf48–/– mice were stained with anti-GFP and anti-Keratin 5 (a) or anti-Keratin 8 (b) antibodies and DAPI (left). GFP-LC3 puncta in Keratin 5- or 8-positive areas are indicated by arrows (left panel). Numbers of GFP-LC3 puncta in Keratin 5-positive areas are shown (right panel). Statistical significance was calculated using two-tailed unpaired Student’s t test (n = 100 sections derived from three independent mice). c GFP-LC3 mice (wild-type) and GFP-LC3/C15orf48–/– (C15orf48–/–) mice (4-week-old) were starved for 48 h. After fasting, thigh skeletal muscle sections were prepared and stained with an anti-GFP antibody and DAPI. Single muscle fibers are encircled by broken lines (left panel). The number of GFP-LC3 puncta in the muscle area is shown (right panel). Statistical significance was calculated using two-tailed unpaired Student’s t test (n = 100 sections derived from three independent mice). Wild-type, WT. Not significant, N.S.
Fig. 8
Fig. 8. C15ORF48 is required for prevention of autoimmunity in mice.
a Immunostaining of tissue sections from Rag1–/– mice (C57BL/6 background, 8–10-week-old) with sera from 21-week-old wild-type and C15orf48–/– mice (C57BL/6 background). Nuclei were counter-stained with DAPI. Each box represents serum from a single mouse (wild-type, n = 5 mice; C15orf48–/–, n = 7 mice). The gray box indicates the detection of reactivity in tissue sections from Rag1–/– mice. b Western blotting of tissue lysates from Rag1–/– mice with sera from 21-week-old wild-type and C15orf48–/– littermate mice. All sera were diluted equally at 1:1000 with 5% skim-milk containing tris buffer. Western blotting using these sera was performed simultaneously to enable exact comparison of their immunoreactivities. Anti-actin blots were used as loading controls. Data are representative of five independent experiments with sera from five different pairs of littermate mice. c Hematoxylin and eosin staining of lung, kidney, and liver sections from 21-week-old wild-type and C15orf48–/– mice. Inflammatory cell infiltrations are indicated by arrows (left). Infiltration scores were determined based on hematoxylin and eosin staining scored from 0 to 4, in a double-blind manner. Each point represents a value from an individual mouse. Statistical significance was calculated using two-tailed unpaired Student’s t test (wild-type, n = 6 mice; C15orf48–/–, n = 7 mice) (right). d Immunostaining of kidney sections from 21-week-old wild-type and C15orf48–/– mice with anti-mouse IgG. Nuclei were counter-stained with DAPI. Glomerulus-like cell clusters are encircled by white lines. (left). IgG deposition scores were determined based on IgG fluorescence intensities scored from 0 to 4, in a double-blind manner. Each point represents a value from an individual mouse. Statistical significance was calculated using two-tailed unpaired Student’s t test (wild-type and C15orf48–/–, n = 4 mice) (right).
Fig. 9
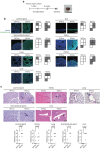
Fig. 9. C15ORF48 deficiency in thymic stroma causes autoimmunity.
a A schematic representation of thymic stroma transplantation experiments (left). A representative image of thymus re-generated into a renal capsule of a nude mouse eight weeks after the transplantation (right). b Immunostaining of tissue sections from Rag1–/– mice with sera from WT/nu and KO/nu mice eight weeks after the transplantation. Nuclei were counter-stained with DAPI. Each box represents serum from a single mouse (WT/nu and KO/nu, n = 5 mice). The gray box indicates the detection of reactivity in tissue sections from Rag1–/– mice. c Hematoxylin and eosin staining of tissue sections from WT/nu and KO/nu mice eight weeks after the transplantation. Inflammatory cell infiltrations are indicated by arrows (top). Infiltration scores were determined based on hematoxylin and eosin staining scored from 0 to 4, in a double-blind manner. Each point represents a value from an individual mouse. Statistical significance was calculated using two-tailed unpaired Student’s t test (WT/nu and KO/nu, n = 5 mice) (bottom).
Fig. 10
Fig. 10. A schematic model of C15ORF48-induced, stress-independent autophagy.
The mitochondrial protein, C15ORF48, a subunit of electron transport chain complex IV, is highly expressed in several cancer cells and thymic epithelial cells, and NF-κB signaling is important for its expression. C15ORF48 reduces mitochondrial activity and intracellular ATP levels, thereby inducing autophagy via pro-autophagic AMPK-ULK1 signaling independently of starvation or mitochondrial stress. C15ORF48-induced autophagy in cancer cells increases intracellular glutathione levels and prevents oxidative stress. C15ORF48-induced autophagy in thymic epithelial cells regulates self-tolerance and prevents autoimmunity.

References

    1. Mizushima N, Komatsu M. Autophagy: renovation of cells and tissues. Cell. 2011;147:728–741. - PubMed
    1. Rappe A, McWilliams TG. Mitophagy in the aging nervous system. Front Cell Dev. Biol. 2022;10:978142. - PMC - PubMed
    1. Vargas, J. N. S., Hamasaki, M., Kawabata, T., Youle, R. J. & Yoshimori, T. The mechanisms and roles of selective autophagy in mammals. Nat. Rev. Mol. Cell Biol. 10.1038/s41580-022-00542-2 (2022). - PubMed
    1. Wang, L., Klionsky, D. J. & Shen, H. M. The emerging mechanisms and functions of microautophagy. Nat. Rev. Mol. Cell Biol.10.1038/s41580-022-00529-z (2022). - PubMed
    1. Hosokawa N, et al. Nutrient-dependent mTORC1 association with the ULK1-Atg13-FIP200 complex required for autophagy. Mol. Biol. Cell. 2009;20:1981–1991. - PMC - PubMed

Substances

LinkOut - more resources