. 2024 Jan 31;15(1):878.
doi: 10.1038/s41467-024-45165-7.

Single nuclei transcriptomics in human and non-human primate striatum in opioid use disorder

Affiliations

Single nuclei transcriptomics in human and non-human primate striatum in opioid use disorder

BaDoi N Phan et al. Nat Commun. .

Abstract

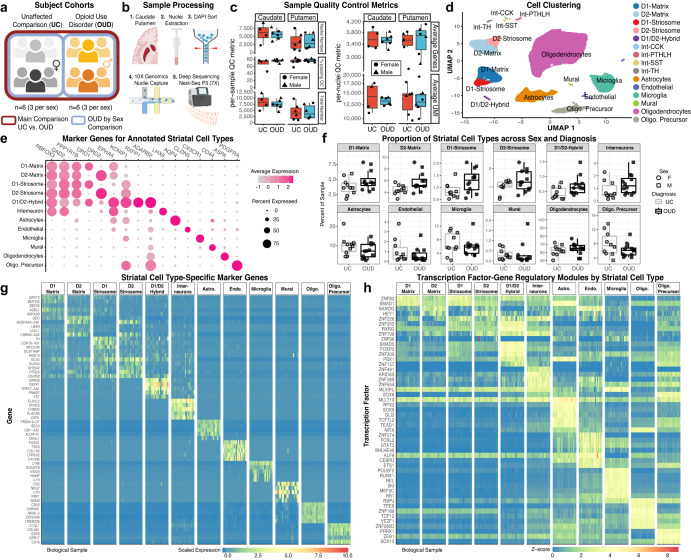
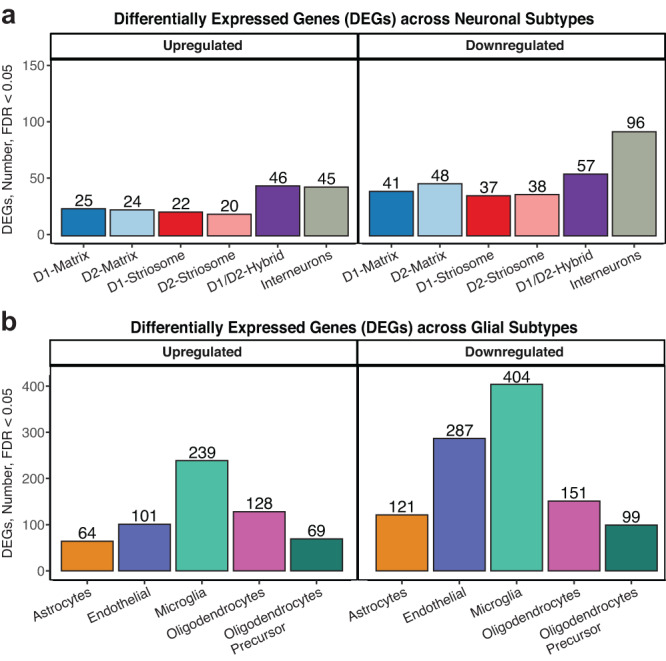
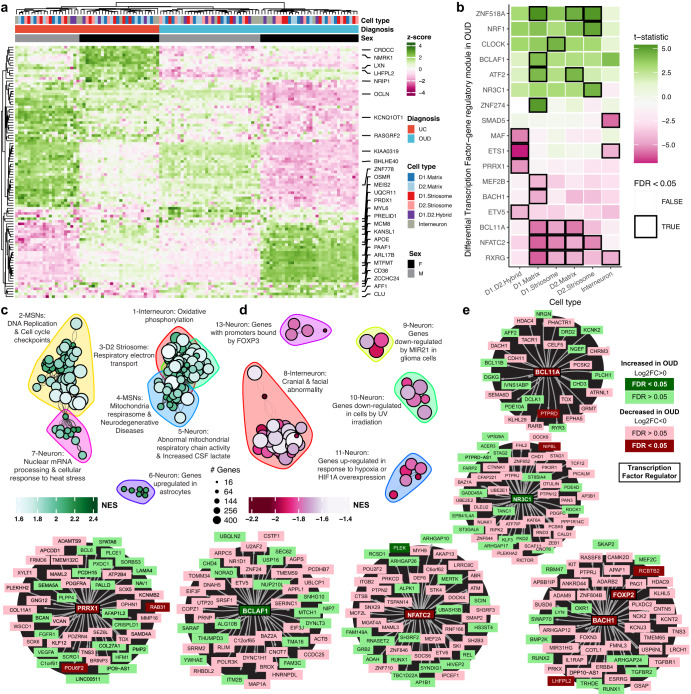
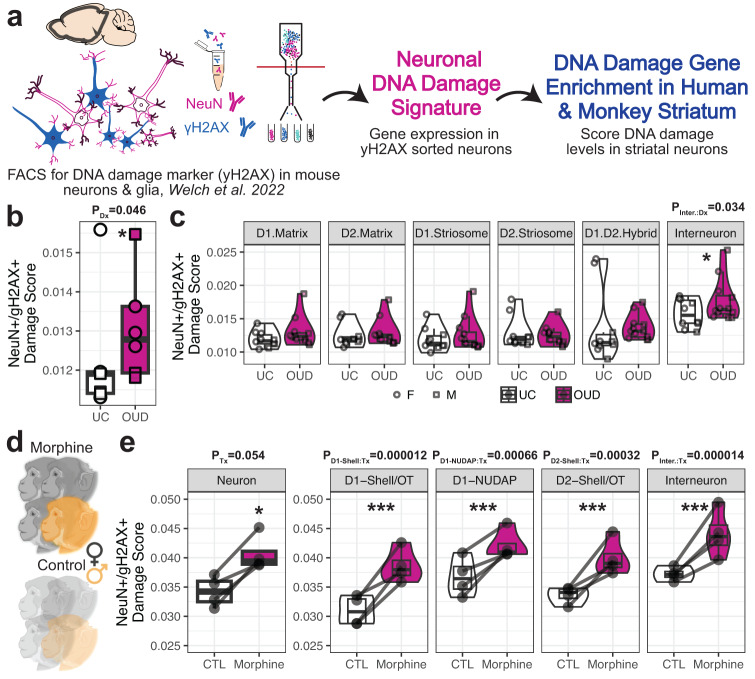
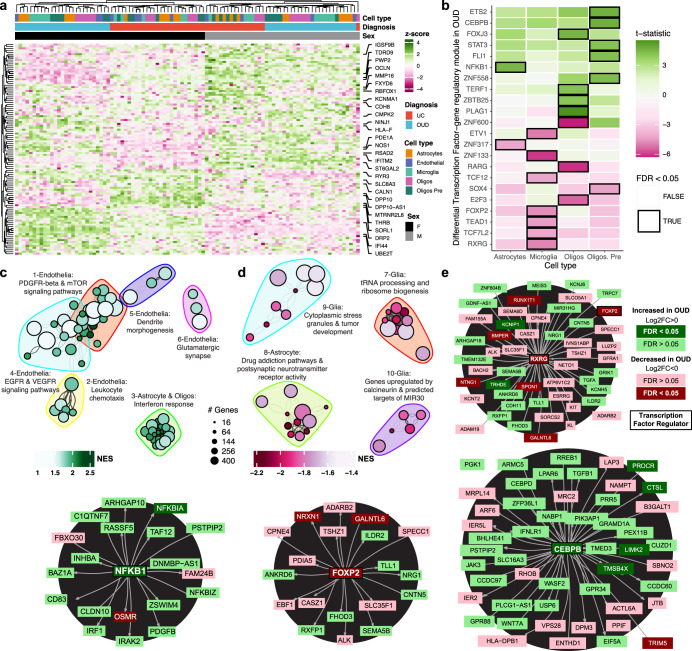
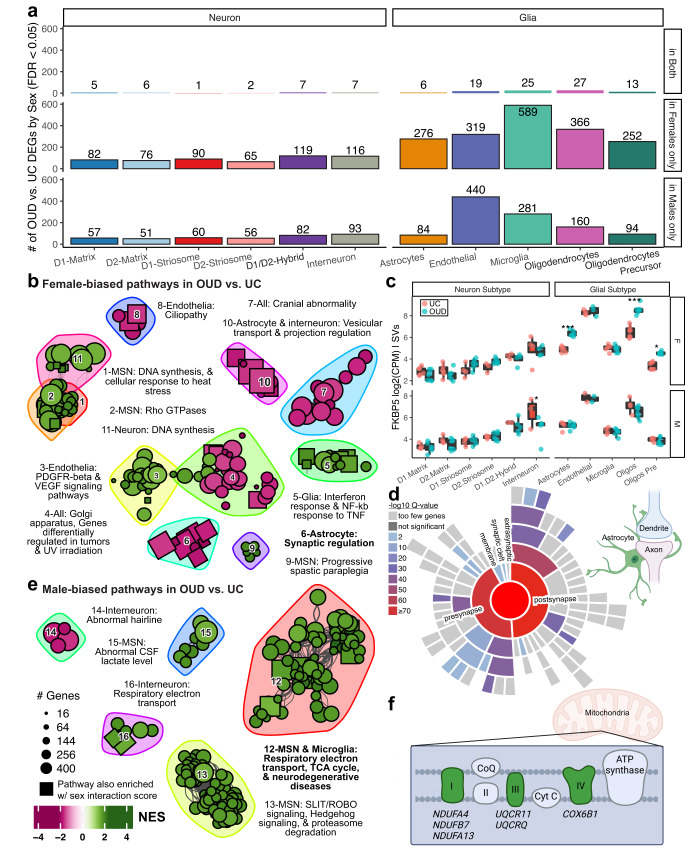
In brain, the striatum is a heterogenous region involved in reward and goal-directed behaviors. Striatal dysfunction is linked to psychiatric disorders, including opioid use disorder (OUD). Striatal subregions are divided based on neuroanatomy, each with unique roles in OUD. In OUD, the dorsal striatum is involved in altered reward processing, formation of habits, and development of negative affect during withdrawal. Using single nuclei RNA-sequencing, we identified both canonical (e.g., dopamine receptor subtype) and less abundant cell populations (e.g., interneurons) in human dorsal striatum. Pathways related to neurodegeneration, interferon response, and DNA damage were significantly enriched in striatal neurons of individuals with OUD. DNA damage markers were also elevated in striatal neurons of opioid-exposed rhesus macaques. Sex-specific molecular differences in glial cell subtypes associated with chronic stress were found in OUD, particularly female individuals. Together, we describe different cell types in human dorsal striatum and identify cell type-specific alterations in OUD.


Conflict of interest statement

The authors declare no competing interests.

Figures

Fig. 1
Fig. 1. Single nuclei RNA-sequencing of postmortem brain to identify specific cell types in human striatum.
a Post-mortem human brain cohort design and analysis to compare unaffected comparison (UC) individuals with individuals with opioid use disorder (OUD). b Schematic of the sample collection process to isolate single nuclei and generate single nuclei RNA-sequencing libraries in balanced batches from the caudate and putamen of human postmortem striatum. c Per-sample quality control (QC) metrics and average per-nuclei QC metrics across tissue sources and diagnoses. Each data point consists of N = 22 caudate and putamen samples from M = 12 individuals. d Single nuclei clustering and label annotation of dorsal striatal cell types using a high-quality non-human primate reference dataset. A low dimensionality projection of striatal cell types after QC filtering and annotation. e Dot plots of the marker genes used to annotate the various cell types of the dorsal striatum based on a non-human primate reference. The normalized expression patterns are averaged across all cells and individuals. f Boxplot showing the relative percent of each cell type detected in each biospecimen that passes QC. No significant differences were observed between UC individuals and individuals with OUD. Each data point consists of N = 22 caudate and putamen samples from M = 12 individuals. g Cell type-specific marker genes and (h) marker transcription factor-gene regulatory networks identified in cell types of human striatum. Schematics in (a) and (b) created using BioRender.com. Source data are provided as a Source Data file. Boxplots in 1 C and 1 F are plotted as median, the 25% and 75% percentiles, and non-outlier maxima and minima.
Fig. 2
Fig. 2. Differentially expressed genes in human striatal cell types associated with OUD.
a Barplot of differentially expressed genes (DEGs) either upregulated or downregulated in striatal neurons at a false discovery rate less than 0.05 (FDR < 0.05). b Barplot of DEGs either upregulated or downregulated in striatal glia at FDR < 0.05. Source data are provided as a Source Data file.
Fig. 3
Fig. 3. Transcriptional alterations in specific neuronal cell types in human striatum associated with OUD.
a Expression heatmap of z-normalized pseudobulk gene expression, where the rows are differentially expressed genes (DEGs) and the columns are the biological replicates labeled by cell type, diagnosis, and sex of each individual. Genes that are represented by the enriched pathways in (c, d) are labeled along the right margins. b A heatmap plotting the t-statistic of differentially activated transcription factor gene regulatory networks across neuronal subtypes in opioid use disorder (OUD). c, d Network plot of significant clusters and enriched pathways, where each point is a significantly enriched pathway in a neuronal cell type and lines represent the proportion of shared genes between two pathways. Each point is colored by the normalized enrichment score (NES), indicating whether a pathway is enriched in upregulated or downregulated genes. The color outlines represent the unique clusters of interconnected pathways by shared genes and the nearby text labels the unique cluster number and briefly summarizes which cell types and pathways are represented. e Cluster maps of select transcription factor gene regulatory networks. Each transcription factor or gene is colored to denote the direction and significance of differential expression in neuronal subtypes in OUD. Source data are provided as a Source Data file. Source data are provided as a Source Data file.
Fig. 4
Fig. 4. Elevated markers of DNA damage in striatal neurons associated with OUD and chronic morphine in rhesus macaque.
a Schematic of the application of DNA damage gene signatures from a mouse model of Alzheimer’s Disease to score DNA damage in human and rhesus macaque striatal neurons. b Boxplot of individual-level pseudobulk average DNA damage scores across striatal neurons between unaffected individuals and individuals with opioid use disorder (OUD) (PDx = 0.046, two-sided linear regression, 15 degrees of freedom). Each data point comes from N = 22 biologically independent samples of caudate and putamen from M = 12 individuals. c Violin-boxplot of cell type-level pseudobulk average DNA damage scores between unaffected individuals and individuals with OUD. The significant cell type interaction effect with diagnosis two-sided P-values from one linear regression are reported above each plot (two-sided linear regression, 114 degrees of freedom). Each data point comes from each neuronal cell type from N = 12 biologically independent individuals. d Schematic of chronic morphine exposure or unexposed rhesus macaques (N = 4 individuals per treatment). e Boxplots of individual level pseudobulk average DNA damage scores across striatal neurons or neuronal subtypes between control individuals or those exposed to chronic morphine. The effect of morphine in all striatal neurons is one linear regression (two-sided linear regression, 2 degrees of freedom). The morphine by cell type interaction effect for each striatal neuron subtype is another linear regression (two-sided linear regression, 20 degrees of freedom). The significant effect of chronic morphine treatment P-values from linear regressions are reported above each plot. (*P < 0.05; **P < 0.01; ***P < 0.001). Each data point comes from all neuronal cell types or each neuronal cell type from N = 8 biologically independent rhesus macaque striatal samples. Schematics in (a, d) created using BioRender.com. Source data are provided as a Source Data file. Boxplots in 4b-c and 4e are plotted as median, the 25% and 75% percentiles, and non-outlier maxima and minima.
Fig. 5
Fig. 5. Transcriptional alterations in specific glial cell types in human striatum associated with OUD.
a Expression heatmap of z-normalized pseudobulk gene expression, where the rows are differentially expressed genes (DEGs) and the columns are the biological replicates labeled by cell type, diagnosis, and sex of each individual. Genes that are represented by the enriched pathways in (c, d) are labeled along the right margins. b A heatmap plotting the t-statistic of differentially activated transcription factor gene regulatory networks across glial subtypes in opioid use disorder (OUD). c, d Network plot of significant clusters and enriched pathways, where each point is a significantly enriched pathway in a glial cell type and lines represent the proportion of shared genes between two pathways. Each point is colored by the normalized enrichment score (NES), indicating whether a pathway is enriched in up- or down-regulated genes. The color outlines represent the unique clusters of interconnected pathways by shared genes and the nearby text labels the unique cluster number and briefly summarizes which cell types and pathways are represented. e Cluster maps of select transcription factor gene regulatory networks. Each transcription factor or gene is colored to denote the direction and significance of differential expression in glial subtypes in OUD. Source data are provided as a Source Data file.
Fig. 6
Fig. 6. Sex-biased transcriptional alterations in striatal cell types associated with OUD.
a Barplot showing the number of differentially expressed genes (DEGs) detected by cell type in sex-specific differential analyses comparing unaffected individuals and individuals with OUD. The bar plots show significant DEGs in only female individuals, in only male individuals, or in both groups (FDR < 0.05). b Network plot of significant clusters and enriched pathways as in Figs. 2b, c and 4b, c. Here, enriched pathways include only DEGs calculated within female individuals if less significant than those calculated within male individuals. Pathways with a square point are also enriched using an alternate calculation of a sex-interaction score. c Boxplots showing sex- and cell type-specificity of differential expression of FKBP5. The boxplot labels the log2(counts per million) normalized gene expression values regressing out covariates and surrogate variables. Each point is a biological replicate colored by diagnosis (*PDx within Sex < 0.05; **PDx within Sex < 0.01; ***PDx within Sex < 0.001, two-sided limma regression, exact P-values reported in Supplementary Data 1–S12). Each data point consists of N = 22 caudate and putamen samples from M = 12 individuals. d A sunburst plot representing curated synaptic gene sets from SynGO from genes enriched in cluster 6, a female-biased set of pathways enriched in astrocytes. e A network plot as in (b); however, displaying the male-biased pathways. f Diagram showing the male biased DEGs that are components of the electron transport chain, including genes involved in mitochondrial functions (NDUFA4, NDUFB7, and NDUFA13 of complex I of mitochondrial respiratory chain; UQCR11 and UQCRQ of complex II; and COX6B1 of complex IV). Schematics in (f) created using BioRender.com. Source data are provided as a Source Data file. Boxplots in 6 C are plotted as median, the 25% and 75% percentiles, and non-outlier maxima and minima.

References

    1. Spencer M. R., Minino A. M. & Warner M. Drug Overdose Deaths in the United States, 2001-2021. NCHSData Brief, 1–8 (2022). - PubMed
    1. Puig, S. et al. Circadian rhythm disruptions associated with opioid use disorder in synaptic proteomes of human dorsolateral prefrontal cortex and nucleus accumbens. Mol Psychiatry, 10.1101/2023.04.07.536056 (2023). - PMC - PubMed
    1. Nagamatsu ST, Rompala G, Hurd YL, Núñez-Rios DL, Montalvo-Ortiz JL. CpH methylome analysis in human cortical neurons identifies novel gene pathways and drug targets for opioid use disorder. Front. Psychiatry. 2022;13:1078894. doi: 10.3389/fpsyt.2022.1078894. - DOI - PMC - PubMed
    1. Xue X, et al. Molecular rhythm alterations in prefrontal cortex and nucleus accumbens associated with opioid use disorder. Transl. Psychiatry. 2022;12:123. doi: 10.1038/s41398-022-01894-1. - DOI - PMC - PubMed
    1. Seney ML, et al. Transcriptional alterations in dorsolateral prefrontal cortex and nucleus accumbens implicate neuroinflammation and synaptic remodeling in opioid use disorder. Biol. Psychiatry. 2021;90:550–562. doi: 10.1016/j.biopsych.2021.06.007. - DOI - PMC - PubMed