. 2024 Feb;16(2):319-333.
doi: 10.1038/s44321-023-00010-0. Epub 2024 Jan 31.

Infected erythrocytes and plasma proteomics reveal a specific protein signature of severe malaria

Collaborators, Affiliations

Infected erythrocytes and plasma proteomics reveal a specific protein signature of severe malaria

Jeremy Fraering et al. EMBO Mol Med. 2024 Feb.

Abstract

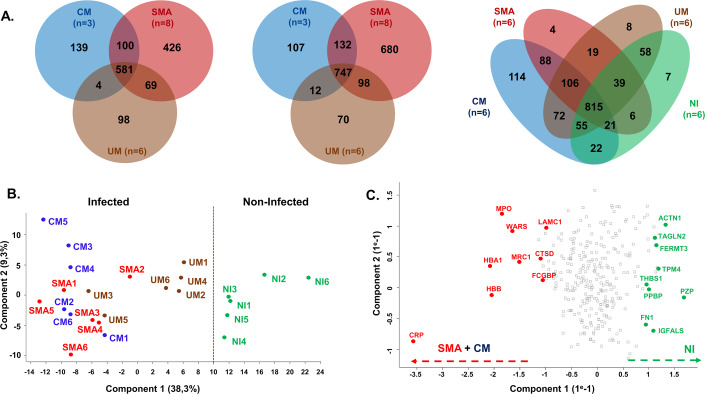
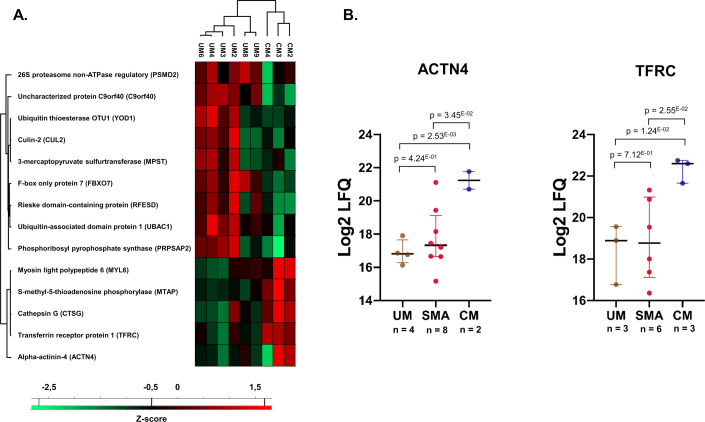
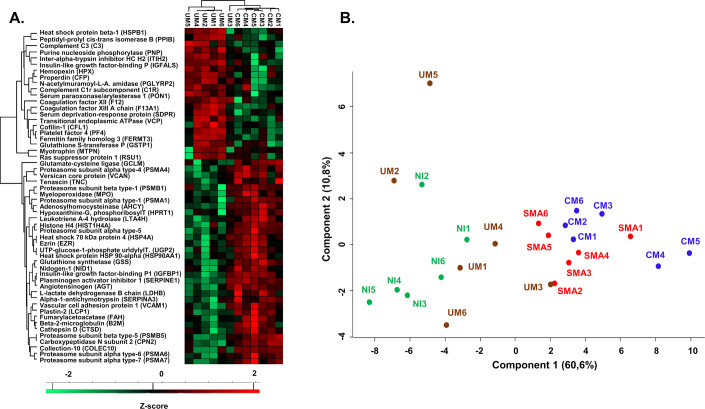
Cerebral malaria (CM), the most lethal complication of Plasmodium falciparum severe malaria (SM), remains fatal for 15-25% of affected children despite the availability of treatment. P. falciparum infects and multiplies in erythrocytes, contributing to anemia, parasite sequestration, and inflammation. An unbiased proteomic assessment of infected erythrocytes and plasma samples from 24 Beninese children was performed to study the complex mechanisms underlying CM. A significant down-regulation of proteins from the ubiquitin-proteasome pathway and an up-regulation of the erythroid precursor marker transferrin receptor protein 1 (TFRC) were associated with infected erythrocytes from CM patients. At the plasma level, the samples clustered according to clinical presentation. Significantly, increased levels of the 20S proteasome components were associated with SM. Targeted quantification assays confirmed these findings on a larger cohort (n = 340). These findings suggest that parasites causing CM preferentially infect reticulocytes or erythroblasts and alter their maturation. Importantly, the host plasma proteome serves as a specific signature of SM and presents a remarkable opportunity for developing innovative diagnostic and prognostic biomarkers.

Keywords: Biomarkers; Cerebral Malaria; LC-MS/MS; Plasmodium falciparum; Red Blood Cells.


Conflict of interest statement

The authors declare no competing interests.

Figures

Figure 1
Figure 1. Study workflow.
Schematic representation of the methodological approach used to quantify by LC-MS/MS protein abundances in infected erythrocytes and plasma samples from Beninese children suffering from different clinical manifestations of malaria. Only a single technical replicate was conducted, and it was performed using only biological replicates for both LC-MS/MS and colorimetric results (MACS magnetic activated cell sorting, SCX strong cation exchange, RP-HpH reverse-phase high pH chromatography, nLC-MS/MS nano-liquid chromatography tandem mass spectrometry).
Figure 2
Figure 2. Global LC-MS/MS descriptive analysis and principal component analyses of plasma samples.
(A) Venn diagrams of the human (Left) and parasitic (Middle) proteins found in iE and in plasma (Right) from pediatric patients suffering from cerebral malaria (CM), severe malaria anemia (SMA), uncomplicated malaria (UM) and non-infected patient (NI). Diagrams were generated using jvenn online (81) with a distinct color code for the different malaria clinical groups; CM in Blue, SMA in Red, UM in Brown, and NI in Green. (B) Principal Component Analysis (PCA) on proteins quantified in all 24 plasma samples (n = 284 proteins), generated with the log2 of LFQ values calculated by MaxQuant algorithm. Color code: CM in Blue, SMA in Red, UM in Brown, and NI in Green. The red dotted line discriminates NI samples from Infected samples. (C) Protein-based PCA (n = 284), in red proteins with an increased impact on sample clustering in the left side of the PCA in (B), and in green proteins with a high impact on sample clustering in the right side of the PCA in (B).
Figure 3
Figure 3. Differentially abundant host proteins in iE samples analyzed by LC-MS/MS.
(A) Heatmap representing Z-scored Log2LFQ values of the 14 differentially abundant proteins identified by LC-MS/MS analysis in between CM (n = 3) and UM (n = 6) biological replicates of iE samples (p < 0.05; Student’s t test). Heatmaps with Euclidean distances between clinical groups were generated using Perseus software (v1.6.15). Log2LFQ missing values were imputed following a normal distribution (width = 0.3 and 1.8 down shift) to generate the heatmap. (B) Dot plot (GraphPad Prism 8.0) representation with median (black bold line) and colored bars (Q1–Q3) of Log2 LFQ values for ACTN4 and TFRC between the three clinical groups showed a significant increase of TFRC and ACTN4 abundance exclusively in CM samples. Student’s t test p values are displayed in the figure. Biological replicate numbers for each group are depicted in the figure. Source data are available online for this figure.
Figure 4
Figure 4. Assessment of Severe Malaria protein signature in plasma through LC-MS/MS analysis.
(A) Heatmap representing Z-scored log2LFQ values of the 54 differentially abundant proteins in CM (n = 6) and UM (n = 6) biological replicates of plasma samples (ANOVA with Benjamini–Hochberg correction for multiple test: q-value < 0.05, and Tukey’s HSD test). LFQ missing values were imputed with normal distribution values (width = 0.3 and 1.8 down shift) to establish the heatmap (Euclidean distances). (B) PCA analysis of the 15 circulating 20S proteasome sub-units quantified in plasma samples. Biological replicates: CM (n = 6) in Blue, SMA (n = 6) in Red, UM (n = 6) in Brown, and NI (n = 6) in Green.
Figure 5
Figure 5. LC-MS/MS quantification validation by colorimetric dosage of nine proteins in plasma.
Quantification of Albumin, CRP, total and conjugated Bilirubin, Ferritin, Hemopexin, Hepcidin, Transferrin, and Haptoglobin in the plasma of Beninese children according to the clinical presentation of malaria (n = 340 biological replicates). Data were analyzed with GraphPad Prism 8.0. Bars correspond to 10–90 percentiles, with a box composed of [Q1; median; Q3]. Mann–Whitney U-test results are represented in the figure (*p value < 0,05); **p value (<0,01); ***p value (<0,001), and ****p value (<0,0001)). All Mann–Whitney exact p values will be presented below as follows: Biomarker (NI vs. UM; NI vs. SMA; NI vs.CM; UM vs. SMA; UM vs. CM and CM vs. SMA). Hemopexin (1.00E-1; 6.72E-09; 1.97E-24, 7.77E-08; 1.50E-27 and 9.97E-01), Haptoglobin (2.11E-07; 7.28E-06; 9.19E-21, 9.25E-03; 7.95E-10 and 9.77E-01), tBIL (1.88E-13; 5.28E-07; 2.48E-19, 5.90E-01; 2.71E-19 and 2.97E-04), cBIL (2.77E-02; 2.76E-03; 9.99E-11, 2.09E-01; 4.01E-16 and 3.52E-03), Albumin (2.40E-14; 1.86E-07; 1.85E-19, 3.37E-04; 1.82E-10 and 8.18E-01), CRP (7.42E-14; 1.11E-09; 1.77E-16, 1.76E-02; 1.42E-11 and 4.64E-01), Ferritin (5.16E-13; 1.74E-08; 1.00E-17, 1.60E-05; 1.42E-24 and 2.10E-01), Hepcidin (2.95E-10; 9.95E-2; 2.63E-13, 1.39E-01; 3.05E-01 and 6.49E-02), and Transferrin (2.24E-13; 2.52E-04; 4.44E-16, 6.80E-01; 5.10E-07 and 3.35E-02). Source data are available online for this figure.
Figure EV1
Figure EV1. Targeted quantification of transferrin receptor protein 1 (TFRC) by ELISA assay.
Dot plot representing TFRC concentration of 20 iE samples from the NeuroCM cohort (10 UM vs 10 CM) measured by ELISA assay. Data were analyzed with GraphPad Prism 8.0. Bold horizontal bars correspond to the median and colored bars correspond to the 95% CI. Mann–Whitney U-test was used as statistical test and p value is displayed in the figure. Source data are available online for this figure.

References

    1. Aguilar R, Moraleda C, Achtman AH, Mayor A, Quintó L, Cisteró P, Nhabomba A, Macete E, Schofield L, Alonso PL, et al. Severity of anaemia is associated with bone marrow haemozoin in children exposed to Plasmodium falciparum. Br J Haematol. 2014;164:877–887. doi: 10.1111/bjh.12716. - DOI - PubMed
    1. Alvarez-Jarreta J, Amos B, Aurrecoechea C, Bah S, Barba M, Barreto A, Basenko EY, Belnap R, Blevins A, Böhme U, et al. VEuPathDB: the eukaryotic pathogen, vector and host bioinformatics resource center in 2023. Nucleic Acids Res. 2023;11:gkad1003. - PMC - PubMed
    1. Andrade CM, Fleckenstein H, Thomson-Luque R, Doumbo S, Lima NF, Anderson C, Hibbert J, Hopp CS, Tran TM, Li S, et al. Increased circulation time of Plasmodium falciparum underlies persistent asymptomatic infection in the dry season. Nat Med. 2020;26:1929–1940. doi: 10.1038/s41591-020-1084-0. - DOI - PubMed
    1. Aschemeyer S, Qiao B, Stefanova D, Valore EV, Sek AC, Ruwe TA, Vieth KR, Jung G, Casu C, Rivella S, et al. Structure-function analysis of ferroportin defines the binding site and an alternative mechanism of action of hepcidin. Blood. 2018;131:899–910. doi: 10.1182/blood-2017-05-786590. - DOI - PMC - PubMed
    1. Bahl A, Brunk B, Crabtree J, Fraunholz MJ, Gajria B, Grant GR, Ginsburg H, Gupta D, Kissinger JC, Labo P, et al. PlasmoDB: the Plasmodium genome resource. A database integrating experimental and computational data. Nucleic Acids Res. 2003;31:212–215. doi: 10.1093/nar/gkg081. - DOI - PMC - PubMed