. 2024 Feb;626(7998):341-346.
doi: 10.1038/s41586-023-06923-7. Epub 2024 Jan 31.

Homo sapiens reached the higher latitudes of Europe by 45,000 years ago

Affiliations

Homo sapiens reached the higher latitudes of Europe by 45,000 years ago

Dorothea Mylopotamitaki et al. Nature. 2024 Feb.

Abstract

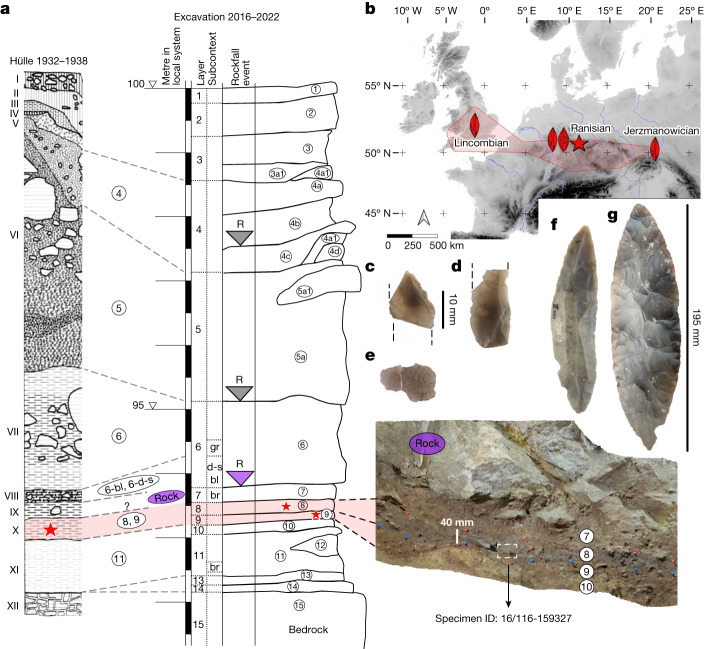
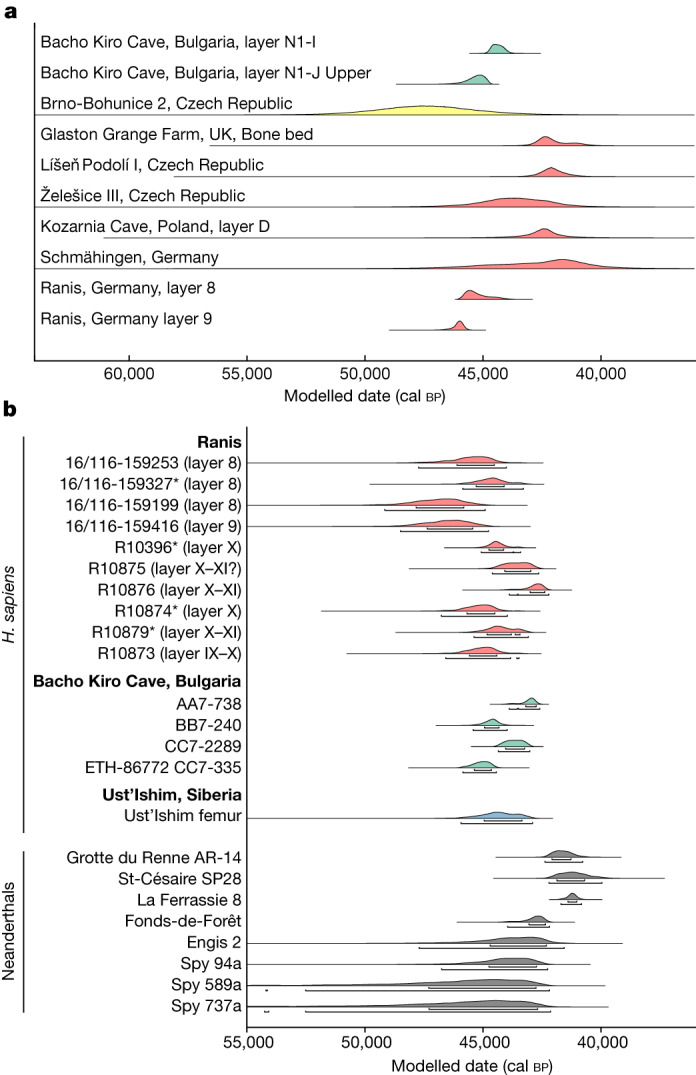
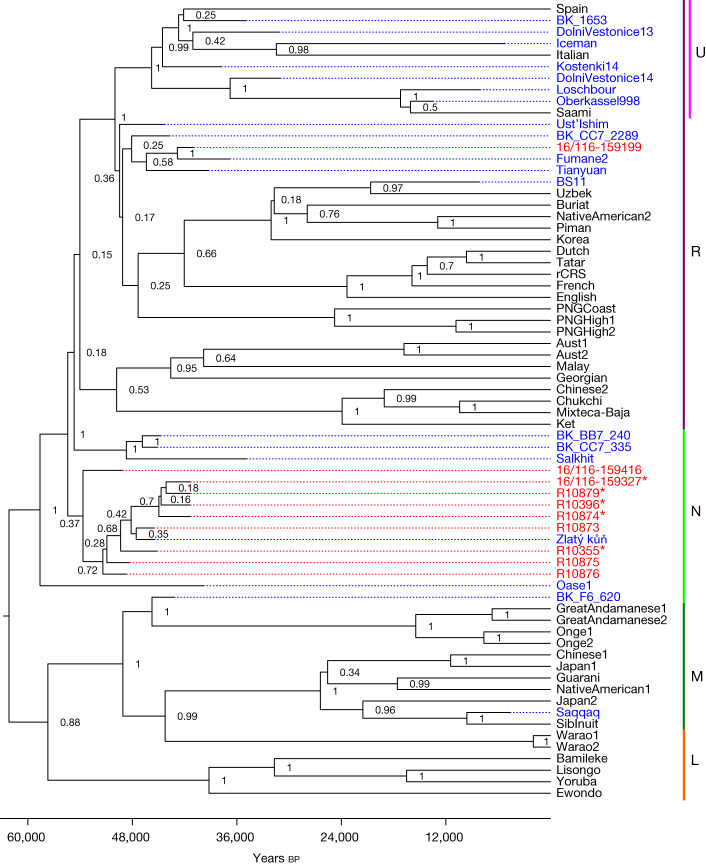
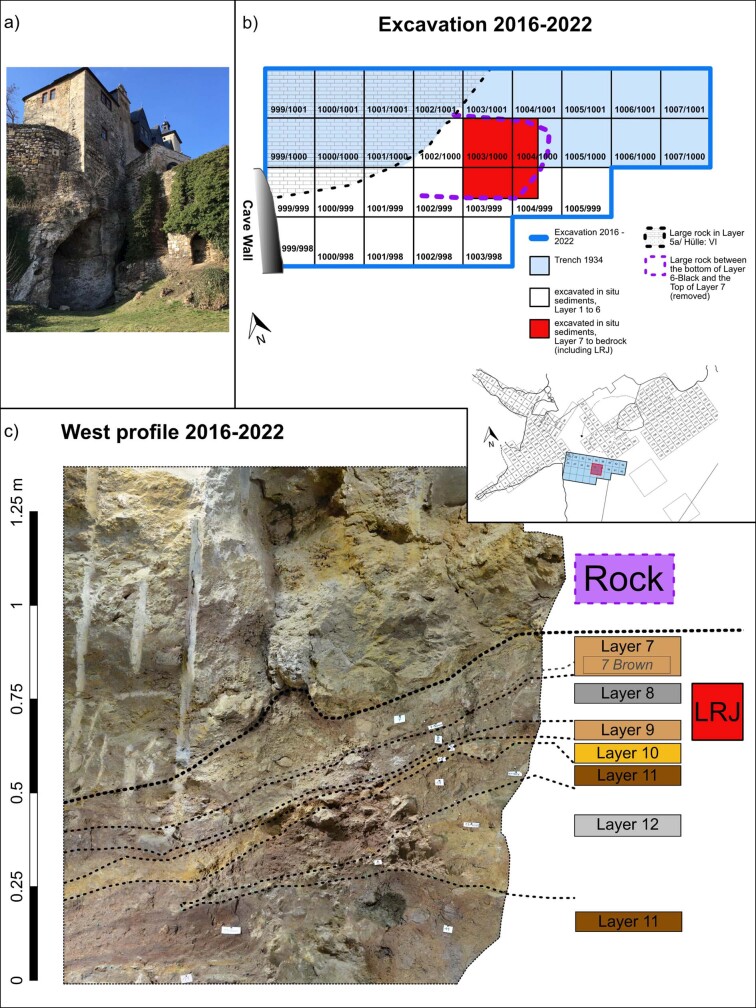
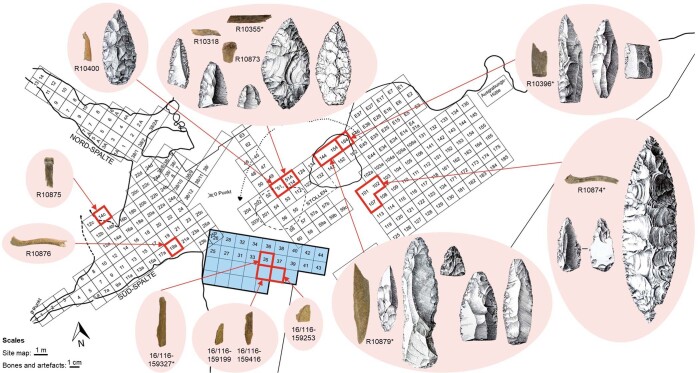
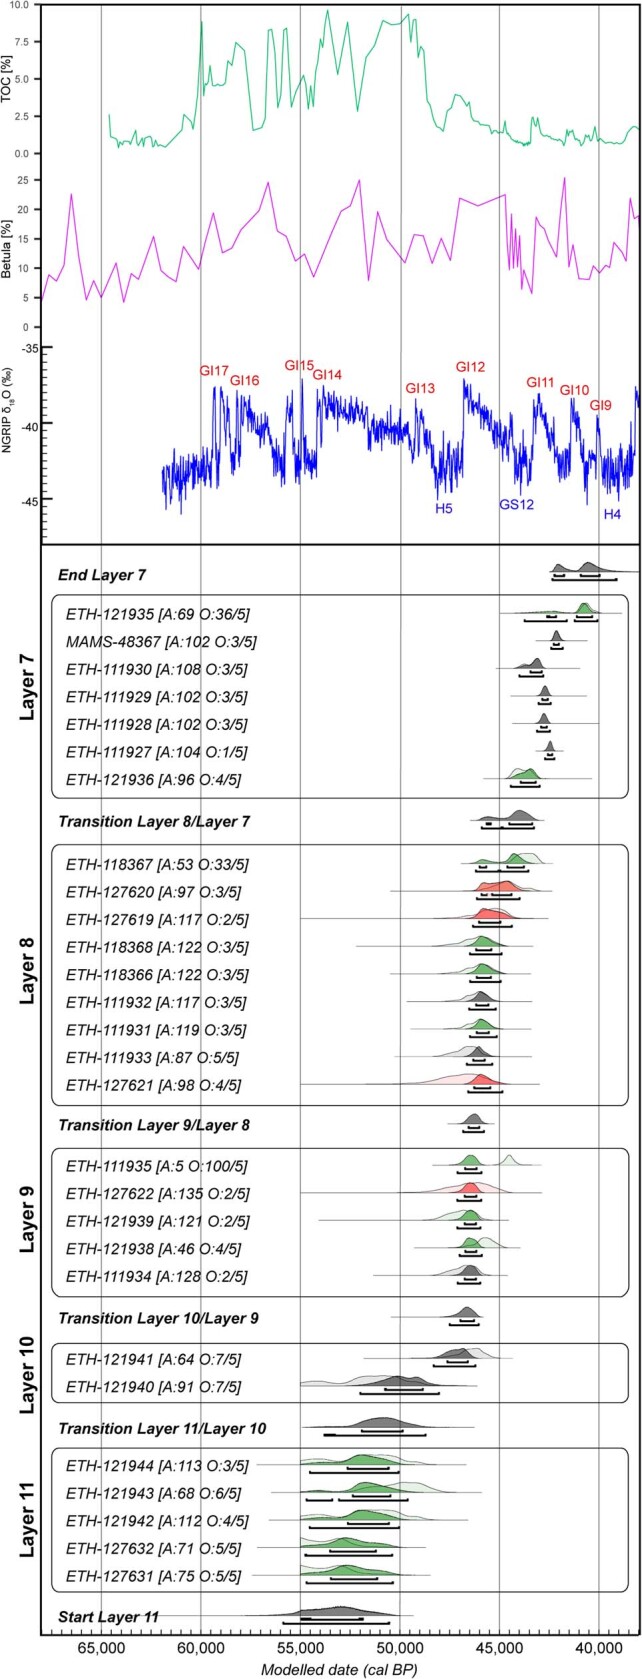
The Middle to Upper Palaeolithic transition in Europe is associated with the regional disappearance of Neanderthals and the spread of Homo sapiens. Late Neanderthals persisted in western Europe several millennia after the occurrence of H. sapiens in eastern Europe1. Local hybridization between the two groups occurred2, but not on all occasions3. Archaeological evidence also indicates the presence of several technocomplexes during this transition, complicating our understanding and the association of behavioural adaptations with specific hominin groups4. One such technocomplex for which the makers are unknown is the Lincombian-Ranisian-Jerzmanowician (LRJ), which has been described in northwestern and central Europe5-8. Here we present the morphological and proteomic taxonomic identification, mitochondrial DNA analysis and direct radiocarbon dating of human remains directly associated with an LRJ assemblage at the site Ilsenhöhle in Ranis (Germany). These human remains are among the earliest directly dated Upper Palaeolithic H. sapiens remains in Eurasia. We show that early H. sapiens associated with the LRJ were present in central and northwestern Europe long before the extinction of late Neanderthals in southwestern Europe. Our results strengthen the notion of a patchwork of distinct human populations and technocomplexes present in Europe during this transitional period.


Conflict of interest statement

The authors declare no competing interests.

Figures

Fig. 1
Fig. 1. Stratigraphy with location of H.sapiens bones, map of LRJ sites and lithics from Ranis.
a, General stratigraphy and correlations of the 1930s and 2016–2022 excavations with the in situ location of the hominin specimen ID 16/116-159327 within the layer 8, north profile (photograph). Stars mark the layers with hominin bones. Shaded in red are the LRJ layers. ‘R’ marks rockfall events. The purple rock represents the 1.7-m-thick rock that sealed the basal sequence. gr, grey; d-s, dark-spotted; bl, black; br, brown. b, Location of Ranis (star) and the LRJ (red shaded area). Schematic artefacts mark the dominant leaf point type in the LRJ subdivisions (Lincombian (blade points), Ranisian (blade points and large bifacial points) and Jerzmanowician (blade points)). The map was created in QGIS on the basis of Shuttle Radar Topography Mission data V4 (http://srtm.csi.cgiar.org). c,d, Blade fragments (16/116-159048 and 16/116-151453), layer 8. e, Quartzite flake (16/116-159051) from surface retouch, layer 8. f, Jerzmanowice blade point, layer X (Museum Burg Ranis, IV 1328). g, Bifacial leaf point (Museum Burg Ranis IV 1319), layer X. a, Adapted from ref. . f,g, Photos: J. Schubert.
Fig. 2
Fig. 2. Chronological comparison of Ranis with selected contemporary sites and directly dated human remains.
a, Distributions showing kernel density estimates of radiocarbon dates from LRJ contexts across Europe (red), IUP contexts at Bacho Kiro Cave (green) and TL dates from Brno-Bohunice (yellow). The location of the sites is shown in Supplementary Fig. 1. b, Calibrated ranges of directly radiocarbon dated H.sapiens from Ranis (LRJ, red), Bacho Kiro Cave (IUP, green) and Ust’-Ishim (no associated archaeology, blue), and Neanderthals (grey) from southwestern France and Belgium. The asterisk marks the Ranis bones for which mtDNA indicates that they originate either from the same or maternally related individuals. The four dates are statistically identical. R10355 and R10318 were not directly dated owing to contamination from conservative treatments (Supplementary Information section 4.1). Layer numbers of the bones from the 1932–1938 excavation (IX, X and XI) refer to labels of boxes in which the finds are stored, which contain material from one or more layers. Data included are shown in Supplementary Tables 17 and 26.
Fig. 3
Fig. 3. Bayesian phylogenetic tree of the newly reconstructed mtDNA genomes with previously published ancient and recent modern human mtDNA genomes constructed with BEAST2.
The posterior probability is shown for each branch point and the x axis shows the years before present. Individual genomes are coloured to denote whether they are ancient (blue) or modern (black) genomes; newly sequenced mtDNA genomes from this study are coloured in red. The Neanderthal mtDNA genomes used to root the tree and modern human mtDNA genomes falling outside the clades shown are not depicted. Asterisks mark mtDNA genomes with no pairwise differences. MtDNA haplogroups (L, M, N, R and U) are labelled in the right column.
Extended Data Fig. 1
Extended Data Fig. 1. Ranis site plan and main West profile of the 2016–2022 excavation.
a) Ilsenhöhle Ranis. b) Plan of the 2016–2022 excavation. The basal sequence including the LRJ layers were excavated in the red area of squares 1003/999, 1003/1000, 1004/999, and 1004/1000. The purple dashed line marks the removed rock. The inset shows the location of our excavation area relative to the plan of the 1932–1938 excavation, while the red box marks the area of the excavated basal sequence. c) West profile of Layers 12 to 7. The lower part of the large rock that was removed is on top of Layer 7. b (inset), adapted from ref. .
Extended Data Fig. 2
Extended Data Fig. 2. Map of Ranis with the location of the newly identified hominin specimens and selected lithic artefacts.
The numbered squares were excavated by W.M. Hülle in the 1930s and we excavated the blue area between 2016 and 2022. The human specimen IDs are provided on the figure (Tab. S5, SI); the five specimens with an asterisk next to their ID showed no pairwise differences in their mtDNA. The artefact IDs are as follows (from left to right when more than one is present in the same square): sq. 51 – 2, 46 B; sq. 101/107 – 2, 31 pb, 2, 56 B; sq. 51 A/114 – 2, 32 J, 2, 36 J, 2, 37 J, 2, 52 B, 2, 54 B; sq. 144/154 – 2, 24 J, 2, 29 pb, 2, 42 B, 2, 43 J, 2, 59 J; sq. 164 – 2, 26 J, 2, 60 J, 2, 78 b. Artefacts marked with a B, J, pb and b are bifacial leaf points, Jerzmanowice points, pointed blades and a blade, respectively. The illustrated lithic artefacts were all found in the same layers and on the same day as or within a day of the excavation of the newly identified human remains from the same squares. Site map and artefact drawings are modified from Hülle.
Extended Data Fig. 3
Extended Data Fig. 3. Chronological site model of 2016-2022 material from Ranis.
Directly dated human remains are shown in red, and faunal bones with anthropogenic modifications are shown in green. Along the top of the figure, the North Greenland Ice Core Project (NGRIP) GICC05 δ18O curve (dark blue) is shown with warmer Greenland Interstadials (GI17-5) and cooler Greenland Stadial 12 (GS12) and Heinrich Events (HE5, HE4) indicated,. Climatic cooling effects correlating with GS12 can also be seen in German palaeoclimate records closer to Ranis: the purple curve shows the Betula pollen (%) measured in the Füramoos pollen record from southern Germany and the green curve shows the Total Organic Carbon Content (TOC) in the Eifel maar sediment core in southwestern Germany. Given the errors inherent in the 14C chronology and climate records themselves, any correlations noted here are tentative. The model outputs are shown in Tab. S15, SI and further information is in SI section 4.2.
Extended Data Fig. 4
Extended Data Fig. 4. Protein deamidation for all hominin specimens in Ranis.
a) Deamidation rate of COL1A1 508–519 for hominin specimens in the 2016–2022 and 1932–1938 excavations with ZooMS (layer X, n = 4 NISP; layer 8, n = 3; layer 9, n = 1), b) Glutamine (Q) deamidation plot for hominin specimens in the 2016–2022 and 1932–1938 excavations analysed with directDIA SPIN (layer X, n = 4; layer 8, n = 3), and c) Asparagine (N) deamidation plot for hominin specimens in the 2016–2022 and 1932–1938 excavations analysed with directDIA SPIN (layer X, n = 4; layer 8, n = 3). The hominin specimen recovered from layer 9 was not included in the SPIN analysis (plots b and c). For panel a, 1 indicates no deamidation of N or Q, while 0 indicates complete deamidation of N or Q. For panels b and c, 0 indicates no deamidation of N or Q, while 1 indicates complete deamidation of N or Q. The box plots within the violin plots define the range of the data (whiskers extend to 1.5× the interquartile range), outliers (black dots, beyond 1.5× the interquartile range), 25th and 75th percentiles (boxes), and medians (centre lines).
Extended Data Fig. 5
Extended Data Fig. 5. Proteomic coverage for the seven hominin bone specimens analysed with SPIN.
Peptide spectrum match (PSM) count per protein amino acid for each hominin specimen by libraryDIA of the 20 genes used in Rüther et al. . White indicates no coverage, red indicates medium coverage, and black indicates high coverage. The asterisk (*) marks the specimens where mtDNA indicates they originate from the same or maternally related individuals. The x-axis represents the amino acid position in the protein sequence alignment of the 20 proteins considered in SPIN analysis.

References

    1. Hublin J-J, et al. Initial Upper Palaeolithic Homo sapiens from Bacho Kiro Cave, Bulgaria. Nature. 2020;581:299–302. doi: 10.1038/s41586-020-2259-z. - DOI - PubMed
    1. Hajdinjak M, et al. Initial Upper Palaeolithic humans in Europe had recent Neanderthal ancestry. Nature. 2021;592:253–257. doi: 10.1038/s41586-021-03335-3. - DOI - PMC - PubMed
    1. Prüfer K, et al. A genome sequence from a modern human skull over 45,000 years old from Zlatý kůň in Czechia. Nat. Ecol. Evol. 2021;5:820–825. doi: 10.1038/s41559-021-01443-x. - DOI - PMC - PubMed
    1. Jöris O, Neruda P, Wiśniewski A, Weiss M. The Late and Final Middle Palaeolithic of central Europe and its contributions to the formation of the regional Upper Palaeolithic: a review and a synthesis. J. Paleolit. Archaeol. 2022;5:17. doi: 10.1007/s41982-022-00126-8. - DOI
    1. Flas D. The Middle to Upper Paleolithic transition in Northern Europe: the Lincombian-Ranisian-Jerzmanowician and the issue of acculturation of the last Neanderthals. World Archaeol. 2011;43:605–627. doi: 10.1080/00438243.2011.624725. - DOI