. 2024 Feb;626(7999):611-616.
doi: 10.1038/s41586-023-06971-z. Epub 2024 Jan 31.

SHR and SCR coordinate root patterning and growth early in the cell cycle

Affiliations

SHR and SCR coordinate root patterning and growth early in the cell cycle

Cara M Winter et al. Nature. 2024 Feb.

Abstract

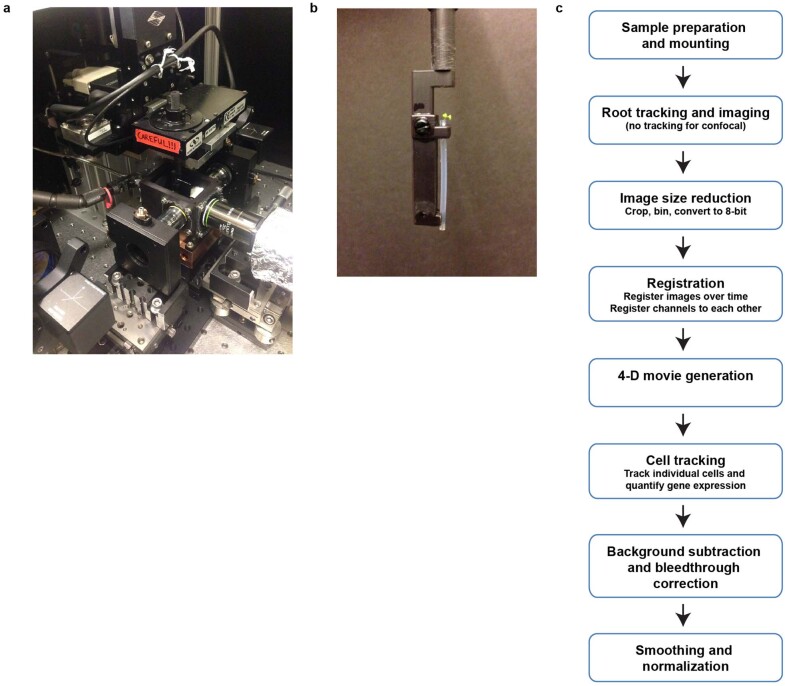
Precise control of cell division is essential for proper patterning and growth during the development of multicellular organisms. Coordination of formative divisions that generate new tissue patterns with proliferative divisions that promote growth is poorly understood. SHORTROOT (SHR) and SCARECROW (SCR) are transcription factors that are required for formative divisions in the stem cell niche of Arabidopsis roots1,2. Here we show that levels of SHR and SCR early in the cell cycle determine the orientation of the division plane, resulting in either formative or proliferative cell division. We used 4D quantitative, long-term and frequent (every 15 min for up to 48 h) light sheet and confocal microscopy to probe the dynamics of SHR and SCR in tandem within single cells of living roots. Directly controlling their dynamics with an SHR induction system enabled us to challenge an existing bistable model3 of the SHR-SCR gene-regulatory network and to identify key features that are essential for rescue of formative divisions in shr mutants. SHR and SCR kinetics do not align with the expected behaviour of a bistable system, and only low transient levels, present early in the cell cycle, are required for formative divisions. These results reveal an uncharacterized mechanism by which developmental regulators directly coordinate patterning and growth.


Conflict of interest statement

P.N.B. was the co-founder and Chair of the Scientific Advisory Board of Hi Fidelity Genetics, Inc, a company that works on crop root growth. The other authors declare no competing interests.

Figures

Fig. 1
Fig. 1. Long-term 4D confocal imaging of SHR reveals dynamics inconsistent with bistability.
a, Diagram of Arabidopsis wild-type and SHR:GAL4–GR UAS:SHR–GFP shr2 mutant roots showing proliferative and formative division planes (adapted from ref. ). SHR moves from the central tissues of the root into the adjacent cell layer. SHR expression and formative divisions occur in the inducible line upon treatment with dex. Yellow, QC (quiescent centre); orange, CEI (cortex–endodermal initial); red, CEID (cortex–endodermal initial daughter) and shr mutant layer; blue, cortex; purple, endodermis. b, Diagram of the SHR–SCR regulatory network controlling formative division based on Cruz–Ramirez et al.. c, Confocal median longitudinal sections showing GFP-labelled SHR and H2B–RFP at timepoints after induction with 10 μM dex. Images are representative of independent timecourse experiments with eight roots. Numbers at the top left show the first five cell positions in the mutant ground tissue. Gamma is set to 0.75 to show signal in the mutant layer for the GFP-only images. Top and bottom show different roots. White arrows, formative divisions. Scale bars, 50 μm. d, Raw (grey) and smoothed (green) SHR trajectory (SHR–GFP/H2B–RFP fluorescence intensity) over time in the first five cells of a single cell file after full induction (10 μM dex). Plots are representative of 211 cells from independent time courses with 8 roots. Possible low and high steady states are indicated for cell 1. Black dashed line, proliferative division; orange dashed line, formative division. a.u., arbitrary units. e, SHR trajectory predicted by the Cruz–Ramirez model showing low and high steady states. f, SHR trajectories for cells that show a low peak of SHR accumulation hours prior to dividing formatively. Roots were treated with low dex (0.02 μM or 0.03 μM). Dark green, SHR trajectory corresponding to images in g. g, Median longitudinal sections through a root tip treated with low dex (0.02 μM) highlighting a cell with a low transient peak of SHR prior to dividing formatively. Plots and images in f and g are representative of 15 cells from 10 roots showing similar behaviour. Scale bars, 10 μm.
Fig. 2
Fig. 2. Long-term 4D light sheet imaging of SHR and SCR dynamics reveals that bistability is not required to model their regulatory relationship.
a, 3D reconstruction of a z-stack showing induced SHR–GFP (green), SCR–mKATE2 (magenta) and H2B–CFP (blue) fluorescence in a SHR:GAL4-GR UAS:SHR–GFP SCR:SCR–mKATE2 UBQ10:H2B–CFP shr2 root. Scale bar, 50 μm. b, Endodermal nuclei detected in Imaris are selected for quantification. Colours specify different cell files. Scale bar, 50 μm. c, Median longitudinal sections of the root in a and b showing timepoints after induction with 40 μM dex. Images in ac are representative of independent timecourse experiments with nine roots. White arrows, formative divisions. Scale bars, 50 μm. d, Quantification of SHR and SCR trajectories (SHR–GFP/H2B–CFP and SCR–mKATE2/H2B–CFP fluorescence intensity, respectively) for a single cell after full induction (40 μM dex). Measurement is representative of 274 cells from independent timecourse experiments with nine roots. SHR and SCR trajectory values are normalized to the 90th quantile (Supplementary Methods). Black dashed line, proliferative division; orange dashed line, formative division. eh, Mean of all fully induced SHR (green) and SCR (magenta) normalized trajectories (Supplementary Methods) and predictions for SCR (grey lines) from the Cruz–Ramirez (e), Michaelis–Menten (f), Hill (g) and positive feedback (h) models. R2, adjusted R squared; n = 274 cells from 9 roots (treated with 40 μM dex; Supplementary Methods).
Fig. 3
Fig. 3. Low threshold levels of SHR and SCR present during an early cell cycle window specify formative division.
a, Prediction accuracy of trajectory classification into formatively dividing and non-dividing cells for a range of SHR and SCR thresholds (Supplementary Methods). Light sheet (LS), n = 449 cells from 14 roots; confocal (conf), n = 743 cells from 29 roots. b, Maximum prediction accuracy of trajectory classification into proliferatively and formatively dividing cells for a given nuclear size window. ***P = 3.8 × 10−91, 8.9 × 10−61, 8.0 × 10−43 for conf - SHR, LS - SHR and LS - SCR, respectively; one-tailed binomial test. An approximate 50% accuracy is expected by chance. Light sheet, n = 500 cells from 14 roots; confocal, n = 633 cells from 29 roots. Top, example masks used to calculate the nuclear size trajectory for a single cell. NS, not significant. Data are mean ± s.e.m. c, Normalized nuclear size at the beginning of the time course for proliferatively (prolif.) and formatively (form.) dividing cells. Two-tailed Mann–Whitney test. Boxes encompass the IQR, centre lines show the median, and whiskers extend to the full range of the data. d, Quantified normalized CDT1a–CFP (G1 marker) fluorescence intensity and normalized nuclear size of a complete cell cycle from a light sheet PlaCCI time course. Top, CDT1a–CFP and H3.1–mCHERRY confocal images showing raw signal, and the Otsu threshold mask. Plot and images are representative of 45 cells from independent timecourse experiments with 2 roots. Scale bar, 5 μm. eg, Frequency of dividing cells in unsynchronized roots (e), and roots synchronized with hydroxyurea at G1/S (f) or oryzalin at G2/M (g). Blue, formative; yellow, proliferative. h, Percentage of first divisions after dex induction that were formative for roots shown in eg. Unpaired one-sided Student’s t-test P is shown. Data are mean ± s.e.m. Source Data
Fig. 4
Fig. 4. A model for SHR and SCR control of formative division.
a, Threshold levels of SHR and SCR specify formative division only when present during G1 or early S. b, The presence of SHR and SCR during G1 and early S activates CYCD6 to specify the orientation of the division plane, whereas other cyclins and developmental cues commit the cell to division. CYCD6 and other cyclins along with their associated kinases phosphorylate RBR, committing the cell to formative division. The two positive feedback loops (SCR autoregulatory loop and RBR release of SCR after phosphorylation by CYCD6) have a smaller role in the decision to divide formatively than previously predicted.
Extended Data Fig. 1
Extended Data Fig. 1. Inducible SHR system produced a variety of protein accumulation trajectories and division outcomes.
a, Left, raw confocal images of SHR-GFP (green) and H2B-RFP (magenta), and nuclear mask (white; see Supplementary Methods) of a single cell over time. Every third timepoint is shown. Scale bar, 5 μm. Right, quantification of SHR-GFP (top) and H2B-RFP (middle) signal intensities, and the derived SHR trajectory (bottom). SHR-GFP and H2B-RFP signal intensities were extracted from the region demarcated by the nuclear mask at each timepoint. Images and plots are representative of 935 cells from independent timecourse experiments with 29 roots. b, Confocal median longitudinal sections through a root tip treated with low dex (0.02 μM) highlighting another cell that divides proliferatively hours after a transient low peak of SHR-GFP is detected. Quantified SHR trajectory is on the right. Scale bar, 10 μm. c, Confocal median longitudinal sections acquired 18 hrs after induction with 10, 1, 0.05, 0.03, 0.02, and 0.01 μM dex. Images are representative of 8, 2, 1, 8, 7 and 3 roots for 10, 1, 0.05, 0.03, 0.02 and 0.01 μM dex, respectively. Scale bar, 50 μm. d, SHR trajectories for all cells broken out by dex concentration and cell position. SHR trajectories show a quantitative response to different dex concentrations. Grey lines, raw data. Black lines, smoothed averages. 10 μM, n = 211 cells from 8 roots; 1 μM, n = 63 cells from 2 roots; 0.05 μM, n = 25 cells from 1 root; 0.03 μM, n = 291 cells from 8 roots; 0.02 μM, n = 221 cells from 7 roots; 0.01 μM, 124 cells from 3 roots. e, Boxplots of maximum SHR intensity (90th quantile) from all SHR trajectories from all roots treated with different concentrations of dex. Boxes, IQR; centre lines, median, whiskers, full range of the data. f, Percentage of cells that divided proliferatively by dex concentration. Data are mean ± s.d. For e,f, 10 μM, n = 158 cells from 8 roots; 1 μM, n = 46 cells from 2 roots; 0.05 μM, n = 19 cells from 1 root; 0.03 μM, n = 236 cells from 8 roots; 0.02 μM n = 180 cells from 7 roots; 0.01 μM, n = 104 cells from 3 roots.
Extended Data Fig. 2
Extended Data Fig. 2. Inducible SHR system controls the SHR-SCR-CYCD6 pathway active in the stem cell niche.
a, Confocal images of a SHR:SHR-GR CYCD6:GFP shr2 root 6 and 7 h after induction with 10 μM dex. White arrows, cell that divides proliferatively at 7 h. Scale bar, 10 μm. b, Confocal images showing SCR:SCR-mCHERRY and CYCD6:GFP-GUS expression after induction of SHR with 10 μM dex. Maximum pixel intensity for the magenta and green channels is adjusted to enhance visibility of the nucleus in the white box. Inset, image shown with a higher maximum pixel intensity to reduce saturation for that cell. Pink arrow, formatively divided cell; white arrow, proliferatively divided cell. Scale bar, 50 μm. Images in a,b are representative of independent time courses of 2 roots. c, Confocal images of inducible SHR-GFP and H2B-RFP in a shr2 scr3 (top) or shr2 (bottom) background after 18-hour 10 μM dex induction. Images are representative of four roots for each mutant line. Scale bar, 50 μm. d, Number of formative divisions present in the first five cells of 2 cell files in 6-day old inducible SHR-GFP roots in a shr2 (n = 4 roots) or shr2 scr3 (n = 4 roots) background after 18 h of dex. Unpaired two-sided Student’s t-test P is shown. Data are mean ± s.e.m. e, Confocal images (green channel only) of a SHR:SHR-GFP UBQ10:H2B-RFP shr2 root (left) and a fully induced (10 μM dex) SHR:GAL4-GR UAS:SHR-GFP EN7:H2B-RFP shr2 (right) root 12 h after dex treatment. Images are representative of 5 and 9 roots of the two respective genotypes. Scale bar, 10 μm. f, SHR-GFP fluorescence intensity in the stele (n = 10 from 5 roots), CEI (n = 9 from 5 roots) and CEID (n = 9 from 5 roots) of SHR:SHR-GFP UBQ10:H2B-RFP shr2 plants, and in the stele (n = 15 from 8 roots) and mutant cells (n = 66 from 9 roots) of SHR:GAL4-GR UAS:SHR-GFP EN7:H2B-RFP shr2 roots 10–15 h after induction with 10 μM dex. Mean SHR-GFP fluorescence in the shr2 mutant cells prior to formative division in the inducible SHR line is similar to mean levels of SHR-GFP in the CEI and CEID of shr2 roots. Mann-Whitney two-sided P is shown. N.S., not significant. Boxes, IQR; centre lines, mean, whiskers, full range of the data. Source Data
Extended Data Fig. 3
Extended Data Fig. 3. Custom light sheet microscope and analysis pipeline.
a, Imaging chamber. b, Capillary tube containing growing root mounted onto custom holder. The holder is lowered into the imaging chamber for imaging. c, Image acquisition and analysis pipeline to produce SHR and SCR trajectories for confocal and light sheet imaging.
Extended Data Fig. 4
Extended Data Fig. 4. Fitting the SCR data to the Cruz-Ramirez model.
a, Mean normalized trajectories of SHR-GFP (green) and SCR-mKATE2 (magenta) (n = 274 cells from 9 roots treated with 40 μM dex; Supplementary Methods) and predictions of SCR (grey lines) using the Cruz-Ramirez model (Supplementary Methods) starting from the published Cruz-Ramirez parameters. Each parameter (columns) was scaled separately by different values (rows). The resulting SCR curve was then scaled to be comparable with the measured SCR curve. b, The corresponding adjusted R2 for the plots in a. c, Example steady state plots for SHR/H2B and SCR/H2B using the Cruz-Ramirez model (Supplementary Methods) for six of the parameter sets from a. The plot on the left (where the Cruz-Ramirez parameter value for dR was multiplied by 10) shows bistability, while other parameter sets to the right are monostable.
Extended Data Fig. 5
Extended Data Fig. 5. SHR and SCR levels at the time of division are not a critical factor in the decision to divide formatively.
a, Median light sheet longitudinal sections of a SHR:GAL4-GR UAS:SHR-GFP SCR:SCR-mKATE2 UBQ10:H2B-CFP shr2 root treated with 40 μM dex showing two cells from a common progenitor with different levels of SCR just prior to formative division. Images are representative of 16 cell pairs from independent time courses of 10 roots. Scale bar, 50 μm. b,c, Quantification of transcription factor fluorescent protein (TF-FP) trajectories for the cells in a. d, Histograms of the average normalized (Supplementary Methods) SHR and SCR levels found during the last five timepoints of all light sheet SHR and SCR full trajectories (including all dex concentrations). Yellow, formatively dividing cells; grey, proliferatively dividing cells. n = 500 cells from independent time courses with 14 roots. e, Histograms of the slopes for SHR (blue) and SCR (orange) fully induced (40 μM) trajectories. n = 274 cells from independent time courses with 9 roots. f, Examples of SCR trajectories (blue) and their fitted slopes (orange). For e and f, slopes were calculated for trajectories between 1 and 5 h prior to division.
Extended Data Fig. 6
Extended Data Fig. 6. SHR levels are interpreted within the context of the cell cycle.
a, Left, histogram of normalized nuclear size one hour after the end of G1 (Supplementary Methods; n = 50 cells from independent time courses with 2 roots). Right, light sheet image of PlaCCI root showing CDT1a-CFP and H3.1-mCHERRY. Scale bar, 10 μm. b, Maximum projection confocal images of unsynchronized (top) and hydroxyurea- (middle) or oryzalin- (bottom) synchronized roots induced with 10 μM dex. Timepoints shown include the 8 h during which most cells first divide. Nuclei of cells are pseudo-colored according to the type of first division after dex treatment. Subsequent divisions maintain the pseudo-colour of the first. Yellow, proliferative division; blue, formative division; green, SHR-GFP; magenta, H2B-RFP expressed from the EN7 promoter. Each row shows a time course of a single root out of 3 roots per condition. Scale bar, 10 μm.
Extended Data Fig. 7
Extended Data Fig. 7. Division trajectories of synchronized cells.
Graphical representation showing the timing of proliferative (blue dots) and formative (red dots) divisions for each cell for roots pretreated for 17 h by transfer to plates containing no treatment (a), hydroxyurea (b), or oryzalin (c), followed by transfer to dex for imaging. Each row corresponds to a single root. Data are shown for two roots for each treatment. Each box contains dot plots for cells 2 (bottom) up to 9 (top) from a single cell file. Cells that have not divided proliferatively by the end of the time course have a cyan dot at the last timepoint.
Extended Data Fig. 8
Extended Data Fig. 8. SHR and SCR dynamics in CEI and CEID cells.
a, Light sheet images of a CEI cell that divides into a CEI and CEID from a time course of a SHR:SHR-GFP SCR:SCR-mKATE2 UBQ10:H2B-CFP shr2 root showing SHR-GFP and SCR-mKATE2 fluorescence just before and after CEI division. Images show a single cell representative of six cells from independent timecourse experiments with three roots. Scale bar, 10 μm. b, Normalized SHR-GFP and SCR-GFP accumulation in the CEID shown in a and its parent CEI during the time course. cg, Additional examples of CEID and parent CEI SHR and SCR trajectories. Orange dashed line, formative division; black dashed line, proliferative division. Cells are from three roots.

References

    1. Benfey PN, et al. Root development in Arabidopsis: four mutants with dramatically altered root morphogenesis. Development. 1993;119:57–70. doi: 10.1242/dev.119.1.57. - DOI - PubMed
    1. Scheres B, et al. Mutations affecting the radial organisation of the Arabidopsis root display specific defects throughout the embryonic axis. Development. 1995;121:53–62. doi: 10.1242/dev.121.1.53. - DOI
    1. Cruz-Ramírez A, et al. A bistable circuit involving SCARECROW–RETINOBLASTOMA integrates cues to inform asymmetric stem cell division. Cell. 2012;150:1002–1015. doi: 10.1016/j.cell.2012.07.017. - DOI - PMC - PubMed
    1. Baena-López LA, Baonza A, García-Bellido A. The orientation of cell divisions determines the shape of Drosophila organs. Curr. Biol. 2005;15:1640–1644. doi: 10.1016/j.cub.2005.07.062. - DOI - PubMed
    1. Facette MR, Rasmussen CG, Van Norman JM. A plane choice: coordinating timing and orientation of cell division during plant development. Curr. Opin. Plant Biol. 2019;47:47–55. doi: 10.1016/j.pbi.2018.09.001. - DOI - PubMed

MeSH terms

Substances