. 2024 Feb;626(7999):603-610.
doi: 10.1038/s41586-023-06982-w. Epub 2024 Jan 31.

Single-neuronal elements of speech production in humans

Affiliations

Single-neuronal elements of speech production in humans

Arjun R Khanna et al. Nature. 2024 Feb.

Abstract

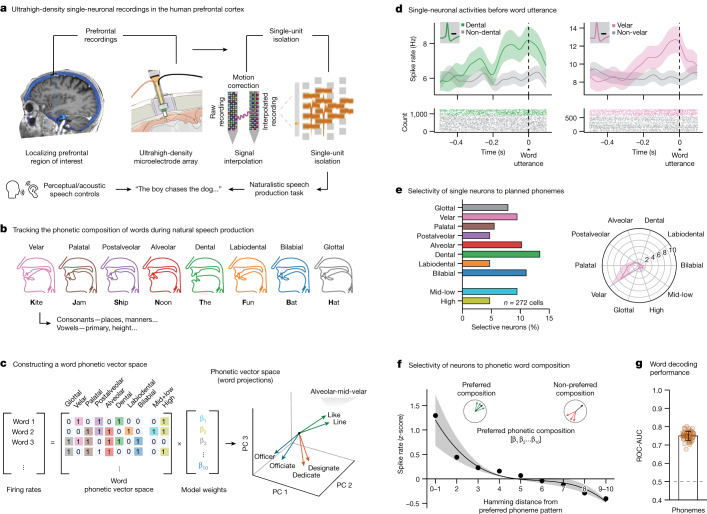
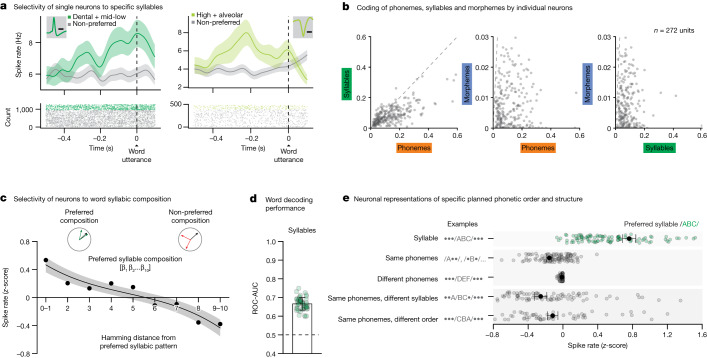
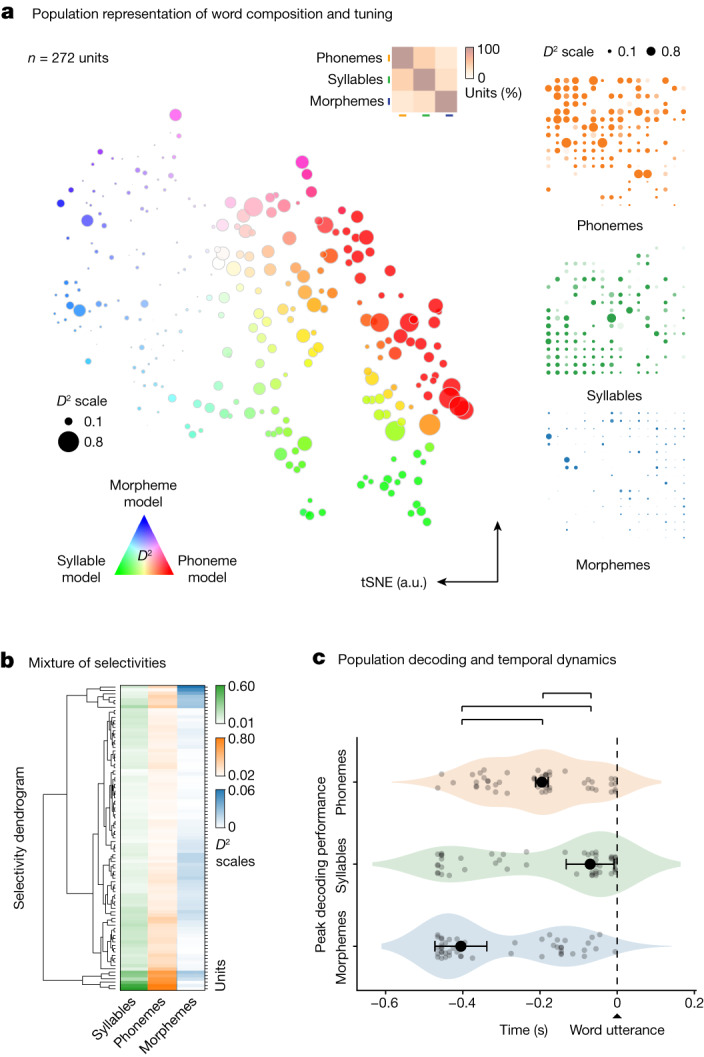
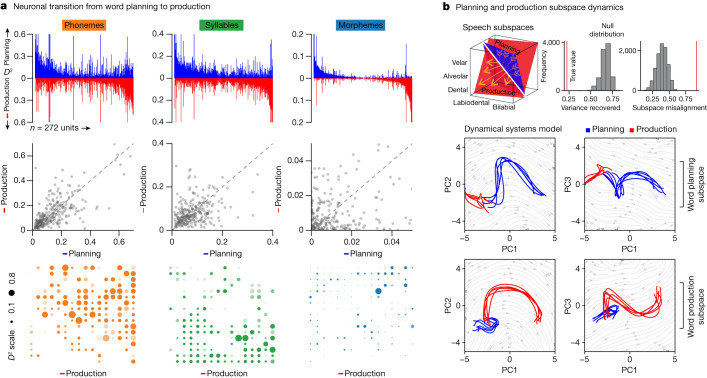
Humans are capable of generating extraordinarily diverse articulatory movement combinations to produce meaningful speech. This ability to orchestrate specific phonetic sequences, and their syllabification and inflection over subsecond timescales allows us to produce thousands of word sounds and is a core component of language1,2. The fundamental cellular units and constructs by which we plan and produce words during speech, however, remain largely unknown. Here, using acute ultrahigh-density Neuropixels recordings capable of sampling across the cortical column in humans, we discover neurons in the language-dominant prefrontal cortex that encoded detailed information about the phonetic arrangement and composition of planned words during the production of natural speech. These neurons represented the specific order and structure of articulatory events before utterance and reflected the segmentation of phonetic sequences into distinct syllables. They also accurately predicted the phonetic, syllabic and morphological components of upcoming words and showed a temporally ordered dynamic. Collectively, we show how these mixtures of cells are broadly organized along the cortical column and how their activity patterns transition from articulation planning to production. We also demonstrate how these cells reliably track the detailed composition of consonant and vowel sounds during perception and how they distinguish processes specifically related to speaking from those related to listening. Together, these findings reveal a remarkably structured organization and encoding cascade of phonetic representations by prefrontal neurons in humans and demonstrate a cellular process that can support the production of speech.


Conflict of interest statement

The authors declare no competing interests.

Figures

Fig. 1
Fig. 1. Tracking phonetic representations by prefrontal neurons during the production of natural speech.
a, Left, single-neuronal recordings were confirmed to localize to the posterior middle frontal gyrus of language-dominant prefrontal cortex in a region known to be involved in word planning and production (Extended Data Fig. 1a,b); right, acute single-neuronal recordings were made using Neuropixels arrays (Extended Data Fig. 1c,d); bottom, speech production task and controls (Extended Data Fig. 2a). b, Example of phonetic groupings based on the planned places of articulation (Extended Data Table 1). c, A ten-dimensional feature space was constructed to provide a compositional representation of all phonemes per word. d, Peri-event time histograms were constructed by aligning the APs of each neuron to word onset at millisecond resolution. Data are presented as mean (line) values ± s.e.m. (shade). Inset, spike waveform morphology and scale bar (0.5 ms). e, Left, proportions of modulated neurons that selectively changed their activities to specific planned phonemes; right, tuning curve for a cell that was preferentially tuned to velar consonants. f, Average z-scored firing rates as a function of the Hamming distance between the preferred phonetic composition of the neuron (that producing largest change in activity) and all other phonetic combinations. Here, a Hamming distance of 0 indicates that the words had the same phonetic compositions, whereas a Hamming distance of 1 indicates that they differed by a single phoneme. Data are presented as mean (line) values ± s.e.m. (shade). g, Decoding performance for planned phonemes. The orange points provide the sampled distribution for the classifier’s ROC-AUC; n = 50 random test/train splits; P = 7.1 × 10−18, two-sided Mann–Whitney U-test. Data are presented as mean ± s.d. Source Data
Fig. 2
Fig. 2. Cells that encode the arrangement and segmentation of phonemes into distinct syllables.
a, Peri-event time histograms were constructed by aligning the APs of each neuron to word onset. Data are presented as mean (line) values ± s.e.m. (shade). Examples of two representative neurons which selectively changed their activity to specific planned syllables. Inset, spike waveform morphology and scale bar (0.5 ms). b, Scatter plots of D2 values (the degree to which specific features explained neuronal response, n = 272 units) in relation to planned phonemes, syllables and morphemes. c, Average z-scored firing rates as a function of the Hamming distance between the preferred syllabic composition and all other compositions of the neuron. Data are presented as mean (line) values ± s.e.m. (shade). d, Decoding performance for planned syllables. The orange points provide the sampled distribution for the classifier’s ROC-AUC values (n = 50 random test/train splits; P = 7.1 × 10−18 two-sided Mann–Whitney U-test). Data are presented as mean ± s.d. e, To evaluate the selectivity of neurons to specific syllables, their activities were further compared for words that contained the preferred syllable of each neuron (that is, the syllable to which they responded most strongly; green) to (i) words that contained one or more of same individual phonemes but not necessarily their preferred syllable, (ii) words that contained different phonemes and syllables, (iii) words that contained the same phonemes but divided across different syllables and (iv) words that contained the same phonemes in a syllable but in different order (grey). Neuronal activities across all comparisons (to green points) were significant (n = 113; P = 6.2 × 10−20, 8.8 × 10−20, 4.2 × 10−20 and 1.4 × 10−20, for the comparisons above, respectively; two-sided Wilcoxon signed-rank test). Data are presented as mean (dot) values ± s.e.m. Source Data
Fig. 3
Fig. 3. Temporal structure and organization of phonetic, syllabic and morphological representations.
a, Left, response selectivity of neurons to specific word features (phonemes, syllables and morphemes) is visualized across the population using a tSNE procedure (that is, neurons with similar response characteristics were plotted in closer proximity). The hue of each point reflects the degree of selectivity to a particular sublexical feature whereas the size of each point reflects the degree to which those features explained neuronal response. Inset, the relative proportions of neurons showing selectivity and their overlap. Right, the D2 metric (the degree to which specific features explained neuronal response) for each cell shown individually per feature. b, The relative degree to which the activities of the neurons were explained by the phonetic, syllabic and morphological features of the words (D2 metric) and their hierarchical structure (agglomerative hierarchical clustering). c, Distribution of peak decoding performances for phonemes, syllables and morphemes aligned to word utterance onset. Significant differences in peak decoding timings across sample distribution are labelled in brackets above (n = 50 random test/train splits; P = 0.024, 0.002 and 0.002; pairwise, two-sided permutation tests of differences in medians for phonemes versus syllables, syllables versus morphemes and phonemes versus morphemes, respectively; Methods). Data are presented as median (dot) values ± bootstrapped standard error of the median. Source Data
Fig. 4
Fig. 4. Neuronal population transition from articulation planning to production.
a, Top, the D2 value of neuronal activity (the degree to which specific features explained neuronal response, n = 272 units) during word planning (green) and production (orange) sorted across all population neurons. Middle, relationship between explanatory power (D2) of neuronal activity (n = 272 units) for phonemes (Spearman’s ρ = 0.69), syllables (Spearman’s ρ = 0.40) and morphemes (Spearman’s ρ = 0.08) during planning and production (P = 1.3 × 10−39, P = 6.6 × 10−12, P = 0.18, respectively, two-sided test of Spearman rank-order correlation). Bottom, the D2 metric for each cell during production per feature (n = 272 units). b, Top left, schematic illustration of speech planning (blue plane) and production (red plane) subspaces as traversed by a neuron for different phonemes (yellow arrows; Extended Data Fig. 9). Top right, subspace misalignment quantified by an alignment index (red) or Grassmannian chordal distance (red) compared to that expected from chance (grey), demonstrating that the subspaces occupied by the neural population (n = 272 units) during planning and production were distinct. Bottom, projection of neural population activity (n = 272 units) during word planning (blue) and production (red) onto the first three PCs for the planning (upper row) and production (lower row) subspaces. Source Data
Extended Data Fig. 1
Extended Data Fig. 1. Single-unit isolations from the human prefrontal cortex using Neuropixels recordings.
a. Individual recording sites on a standardized 3D brain model (FreeSurfer), on side (top), zoomed-in oblique (inset) and top (bottom) views. Recordings lay across the posterior middle frontal gyrus of the language-dominant prefrontal cortex and roughly ranged in distribution from alongside anterior area 55b to 8a. b. Recording coordinates for the five participants are given in MNI space. c. Left, representative example of raw, motion-corrected action potential traces recorded across neighbouring channels over time. Right, an example of overlayed spike waveform morphologies and their distribution across neighbouring channels recorded from a Neuropixels array. d. Isolation metrics for the recorded population (n = 272 units) together with an example of spikes from four concomitantly recorded units (labelled red, blue, cyan and yellow) in principal component space.
Extended Data Fig. 2
Extended Data Fig. 2. Naturalistic speech production task performance and phonetic selectivity across neurons and participants.
a. A priming-based speech production task that provided participants with pictorial representations of naturalistic events and that had to be verbally described in specific order. The task trial example is given here for illustrative purposes (created with BioRender.com). b. Mean word production times across participants and their standard deviation of the mean. The blue bars and dots represent performances for the five participants in which recordings were acquired (n = 964, 1252, 406, 836, 805 words, respectively). The grey bar and dots represent healthy control (n = 1534 words). c. Percentage of modulated neurons that responded selectively to specific planned phonemes across participants. All participants possessed neurons that responded to various phonetic features (one-sided χ2 = 10.7, 6.9, 7.4, 0.5 and 1.3, p = 0.22, 0.44, 0.49, 0.97, 0.86, for participants 1–5, respectively).
Extended Data Fig. 3
Extended Data Fig. 3. Examples of single-neuronal activities and their temporal dynamics.
a. Peri-event time histograms were constructed by aligning the action potentials of each neuron to word onset. Data are presented as mean (line) values ± standard error of the mean (shade). Examples of three representative neurons that selectively changed their activity to specific planned phonemes. Inset, spike waveform morphology and scale bar (0.5 ms). b. Peri-event time histogram and action potential raster for the same neurons above but now aligned to the onset of the articulated phonemes themselves. Data are presented as mean (line) values ± standard error of the mean (shade). c. Sankey diagram displaying the proportions of neurons (n = 56) that displayed a change in activity polarity (increases in orange and decreases in purple) from planning to production.
Extended Data Fig. 4
Extended Data Fig. 4. Generalizability of explanatory power across phonetic groupings for consonants and vowels.
a. Scatter plots of the model explanatory power (D2) for different phonetic groupings across the cell population (n = 272 units). Phonetic groupings were based on the planned (i) places of articulation of consonants and/or vowels (ii) manners of articulation of consonants and (iii) primary cardinal vowels (Extended Data Table 1). Model D2 explanatory power across all phonetic groupings were significantly correlated (from top left to bottom right, p = 1.6×10−146, p = 2.8×10−70, p = 6.1×10−54, p = 1.4×10−57, p = 2.3×10−43 and p = 5.9×10−43, two-sided tests of Spearman rank-order correlations). Spearman’s ρ are 0.96, 0.83, 0.77, respectively for left to right top panels and 0.78, 0.71, 0.71, respectively for left to right bottom panels (dashed regression lines). Among phoneme-selective neurons, the planned places of articulation provided the highest explanatory power (two-sided Wilcoxon signed-rank test of model D2 values, W = 716, p = 7.9×10⁻¹⁶) and the best model fits (two-sided Wilcoxon signed-rank test of AIC, W = 2255, p = 1.3×10⁻⁵) compared to manners of articulation. They also provided the highest explanatory power (two-sided Wilcoxon signed-rank test of model D2 values, W = 846, p = 9.7×10⁻¹⁵) and fits (two-sided Wilcoxon signed-rank test of AIC, W = 2088, p = 2.0×10⁻⁶) compared to vowels. b. Multidimensional scaling (MDS) representation of all neurons across phonetic groupings. Neurons with similar response characteristics are plotted closer together. The hue of each point reflects the degree of selectivity to specific phonetic features. Here, the colour scale for places of articulation is provided in red, manners of articulation in green and vowels in blue. The size of each point reflects the magnitude of the maximum explanatory power in relation to each cell’s phonetic selectivity (maximum D2 for places of articulation of consonants and/or vowels, manners of articulation of consonants and primary cardinal vowels).
Extended Data Fig. 5
Extended Data Fig. 5. Explanatory power for the acoustic–phonetic properties of phonemes and neuronal tuning to morphemes.
a. Left, scatter plot of the D2 explanatory power of neurons for planned phonemes and their observed spectral frequencies during articulation (n = 272 units; Spearman’s ρ = 0.75, p = 9.3×10−50, two-sided test of Spearman rank-order correlation). Right, decoding performances for the spectral frequency of phonemes (n = 50 random test/train splits; p = 7.1×10⁻¹⁸, two-sided Mann–Whitney U-test). Data are presented as mean values ± standard error of the mean. b. Venn diagrams of neurons that were modulated by phonemes during planning and those that were modulated by the spectral frequency (left) and amplitude (right) of the phonemes during articulation. c. Left, peri-event time histogram and raster for a representative neuron exhibiting selectivity to words that contained bound morphemes (for example, –ing, –ed) compared to words that did not. Data are presented as mean (line) values ± standard error of the mean (shade). Inset, spike waveform morphology and scale bar (0.5 ms). Right, decoding performance distribution for morphemes (n = 50 random test/train splits; p = 1.0×10⁻¹⁷, two-sided Mann–Whitney U-test). Data are presented as mean values ± standard deviation.
Extended Data Fig. 6
Extended Data Fig. 6. Phonetic representations of words during speech perception and the comparison of speaking to listening.
a. Left, Venn diagrams of neurons that selectively changed their activity to specific phonemes during word planning (−500:0 ms from word utterance onset) and perception (0:500 ms from word utterance onset). Right, average z-scored firing rate for selective neurons during word planning (black) and perception (grey) as a function of the Hamming distance. Here, the Hamming distance was based on the neurons’ preferred phonetic compositions during production and compared for the same neurons during perception. Data are presented as mean (line) values ± standard error of the mean (shade). b. Left, classifier decoding performances for selective neurons during word planning. The points provide the sampled distribution for the classifier’s ROC-AUC values (black) compared to random chance (grey; n = 50 random test/train splits; p = 7.1×10⁻¹⁸, two-sided Mann–Whitney U-test). Middle, decoding performance for selective neurons during perception (n = 50 random test/train splits; 7.1×10⁻¹⁸, two-sided Mann–Whitney U-test). Right, word planning-perception model-switch decoding performances for selective neurons. Here, models were trained on neural data for specific phonemes during planning and then used to decode those same phonemes during perception (n = 50 random test/train splits; p > 0.05, two-sided Mann–Whitney U-test; Methods). The boundaries and midline of the boxplots represent the 25th and 75th percentiles and the median, respectively. c. Peak decoding performance for phonemes, syllables and morphemes as a function of time from perceived word onset. Peak decoding for morphemes was observed significantly later than for phonemes and syllables during perception (n = 50 random test/train splits; two-sided Kruskal–Wallis, H = 14.8, p = 0.00062). Data are presented here as median (dot) values ± bootstrapped standard error of the median.
Extended Data Fig. 7
Extended Data Fig. 7. Spatial distribution of representations based on cortical location and depth.
a. Relationship between recording location along the rostral–caudal axis of the prefrontal cortex and the proportion of neurons that displayed selectivity to specific phonemes, syllables and morphemes. Neurons that displayed selectivity were more likely to be found posteriorly (one-sided χ2 test, p = 2.6×10⁻⁹, 3.0×10⁻¹¹, 2.5×10⁻⁶, 3.9×10⁻¹⁰, for places of articulation, manners of articulation, syllables and morpheme, respectively). b. Relationship between recording depth along the cortical column and the proportion of neurons that display selectivity to specific phonemes, syllables and morphemes. Neurons that displayed selectivity were broadly distributed along the cortical column (one-sided χ2 test, p > 0.05). Here, S indicates superficial, M middle and D deep.
Extended Data Fig. 8
Extended Data Fig. 8. Receiver operating characteristic curves across planned phonetic representations and decoding model-switching performances for word planning and production.
a. ROC-AUC curves for neurons across different phonemes, grouped by placed of articulation, during planning (there were insufficient palatal consonants to allow for classification and are therefore not displayed here). b. Average (solid line) and shuffled (dotted line) data across all phonemes. Data are presented as mean (line) values ± standard error of the mean (shade). c. Planning-production model-switch decoding performance sample distribution (n = 50 random test/train splits) for all selective neurons. Here, models were trained on neuronal data recorded during planning and then used to decode those same phoneme (left), syllable (middle), or morpheme (right) on neuronal data recorded during production. Slightly lower decoding performances were noted for syllables and morphemes when comparing word planning to production (p = 0.020 for syllable comparison and p = 0.032 for morpheme comparison, two-sided Mann–Whitney U-test). Data are presented as mean values ± standard deviation.
Extended Data Fig. 9
Extended Data Fig. 9. Example of phonetic representations in planning and production subspaces.
Modelled depiction of the neuronal population trajectory (bootstrap resampled) across averaged trials with (green) and without (grey) mid-low phonemes, projected into a plane within the “planning” subspace (y-axis) and a plane within the “production” subspace (z-axis). Projection planes within planning and production subspaces were chosen to enable visualization of trajectory divergence. Zero indicates word onset on the x-axis. Separation between the population trajectory during trials with and without mid-low phonemes is apparent in the planning subspace (y-axis) independently of the projection subspace (z-axis) because these subspaces are orthogonal. The orange plane indicates a hypothetical decision boundary learned by a classifier to separate neuronal activities between mid-low and non-mid-low trials. Because the classifier decision boundary is not constrained to lie within a particular subspace, classifier performance may therefore generalize across planning and production epochs, despite the near-orthogonality of these respective subspaces.

References

    1. Levelt, W. J. M., Roelofs, A. & Meyer, A. S. A Theory of Lexical Access in Speech Production Vol. 22 (Cambridge Univ. Press, 1999). - PubMed
    1. Kazanina N, Bowers JS, Idsardi W. Phonemes: lexical access and beyond. Psychon. Bull. Rev. 2018;25:560–585. doi: 10.3758/s13423-017-1362-0. - DOI - PMC - PubMed
    1. Bohland JW, Guenther FH. An fMRI investigation of syllable sequence production. NeuroImage. 2006;32:821–841. doi: 10.1016/j.neuroimage.2006.04.173. - DOI - PubMed
    1. Basilakos A, Smith KG, Fillmore P, Fridriksson J, Fedorenko E. Functional characterization of the human speech articulation network. Cereb. Cortex. 2017;28:1816–1830. doi: 10.1093/cercor/bhx100. - DOI - PMC - PubMed
    1. Tourville JA, Nieto-Castañón A, Heyne M, Guenther FH. Functional parcellation of the speech production cortex. J. Speech Lang. Hear. Res. 2019;62:3055–3070. doi: 10.1044/2019_JSLHR-S-CSMC7-18-0442. - DOI - PMC - PubMed