. 2024 Feb;626(8000):881-890.
doi: 10.1038/s41586-023-06984-8. Epub 2024 Jan 31.

An epigenetic barrier sets the timing of human neuronal maturation

Affiliations

An epigenetic barrier sets the timing of human neuronal maturation

Gabriele Ciceri et al. Nature. 2024 Feb.

Abstract

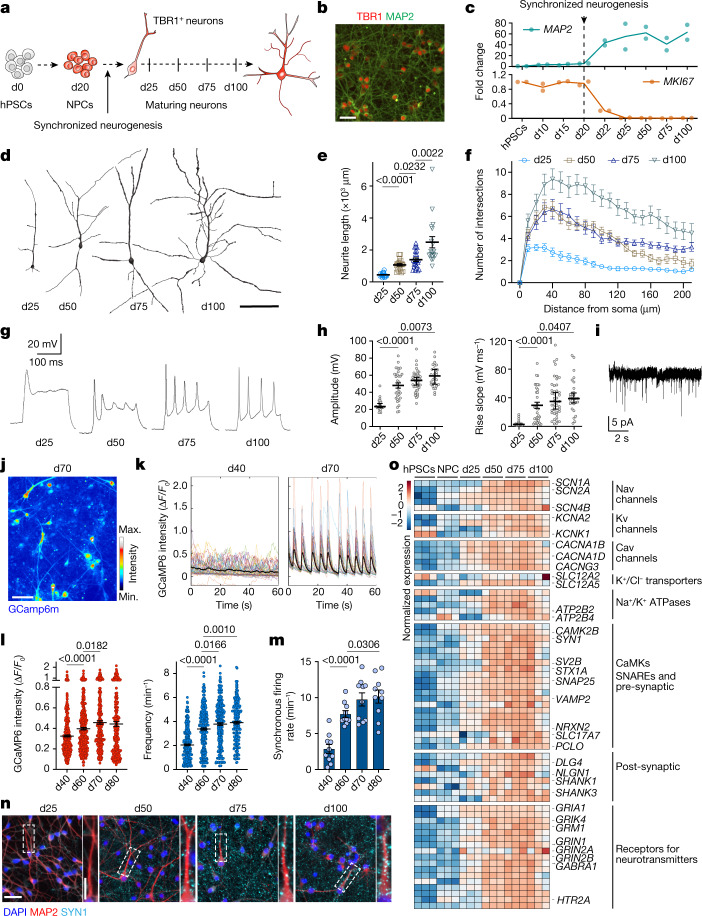
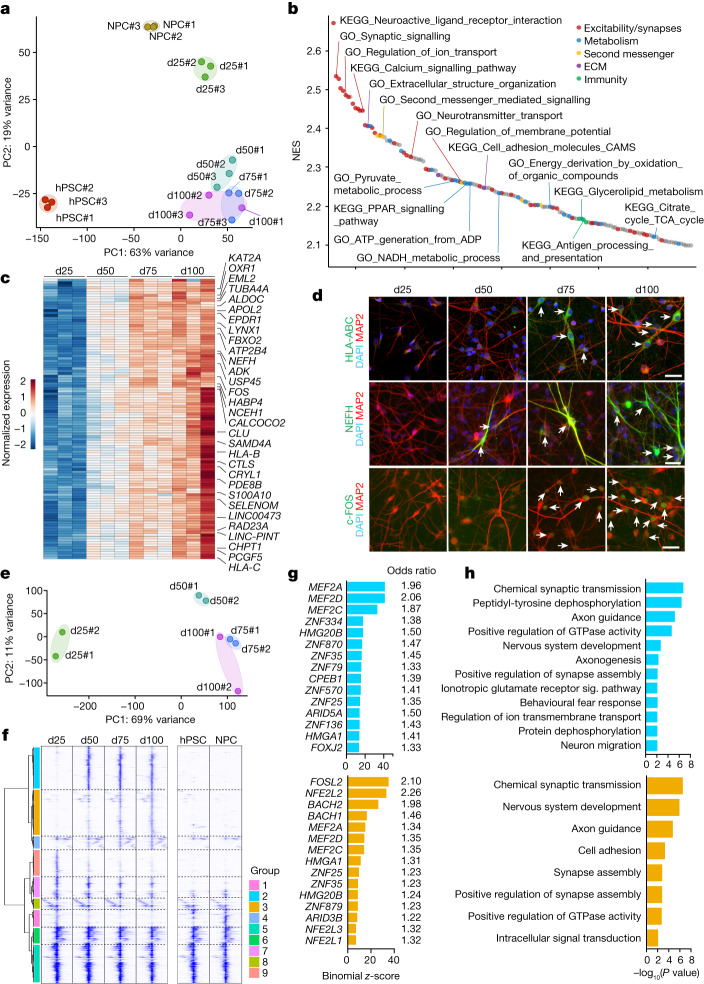
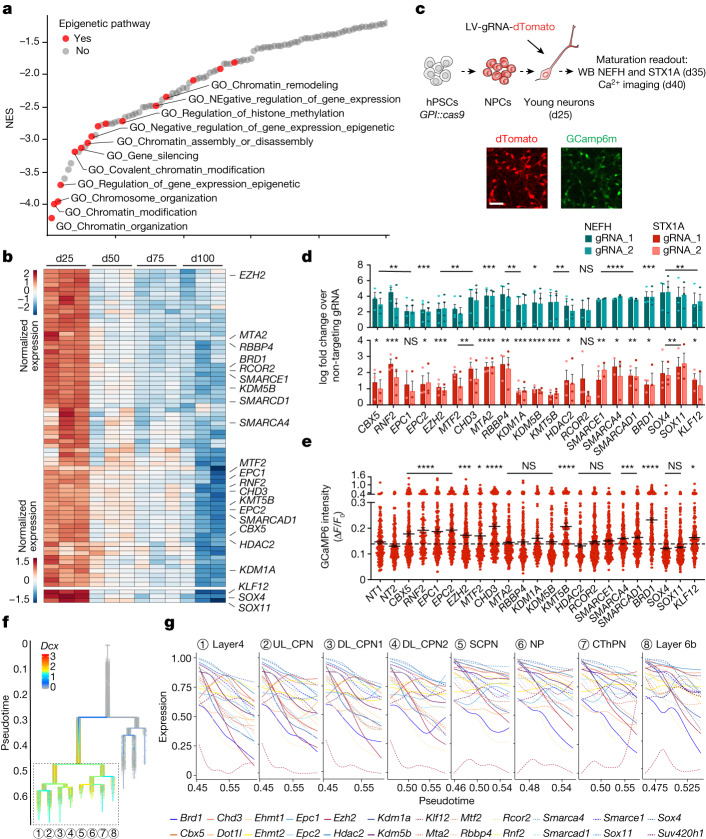
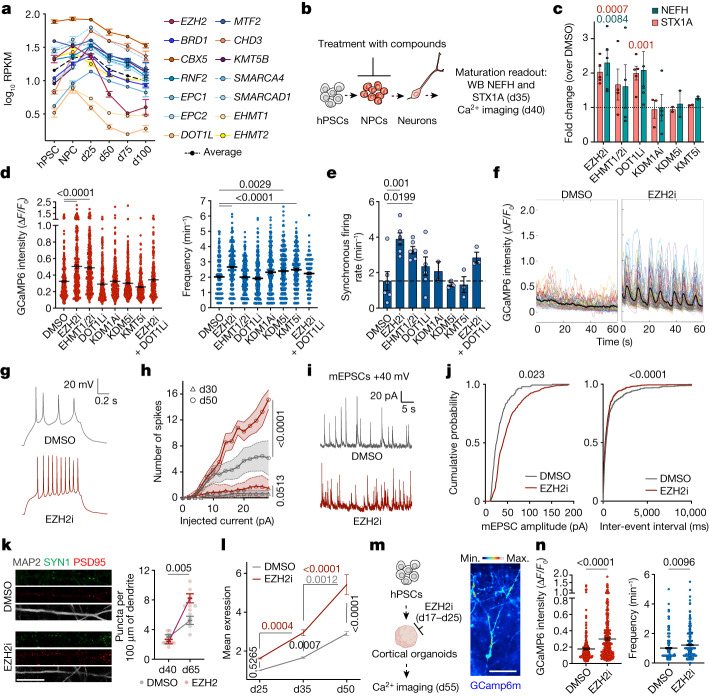
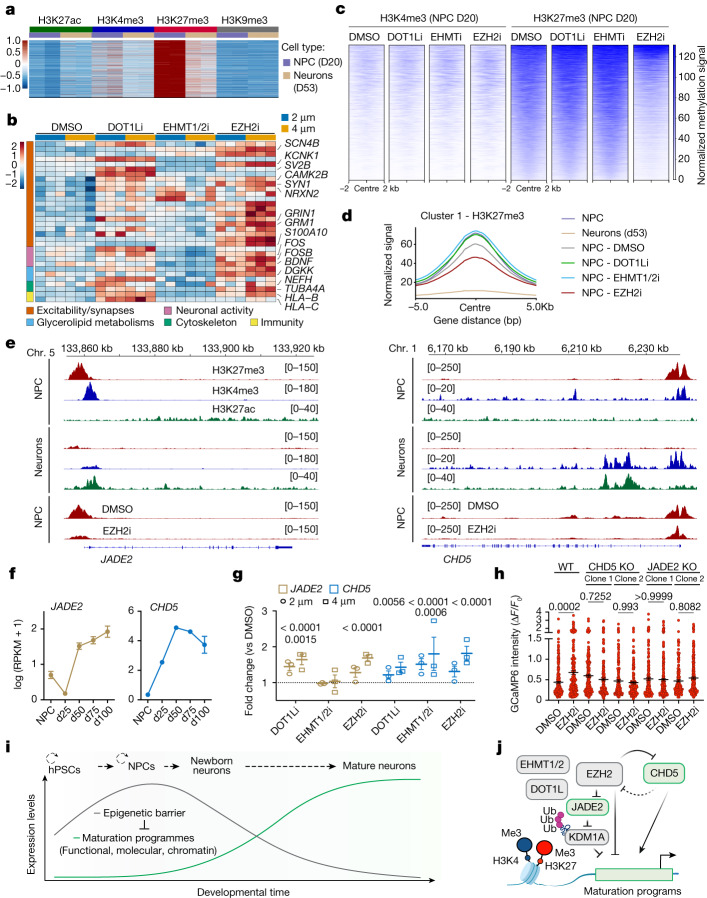
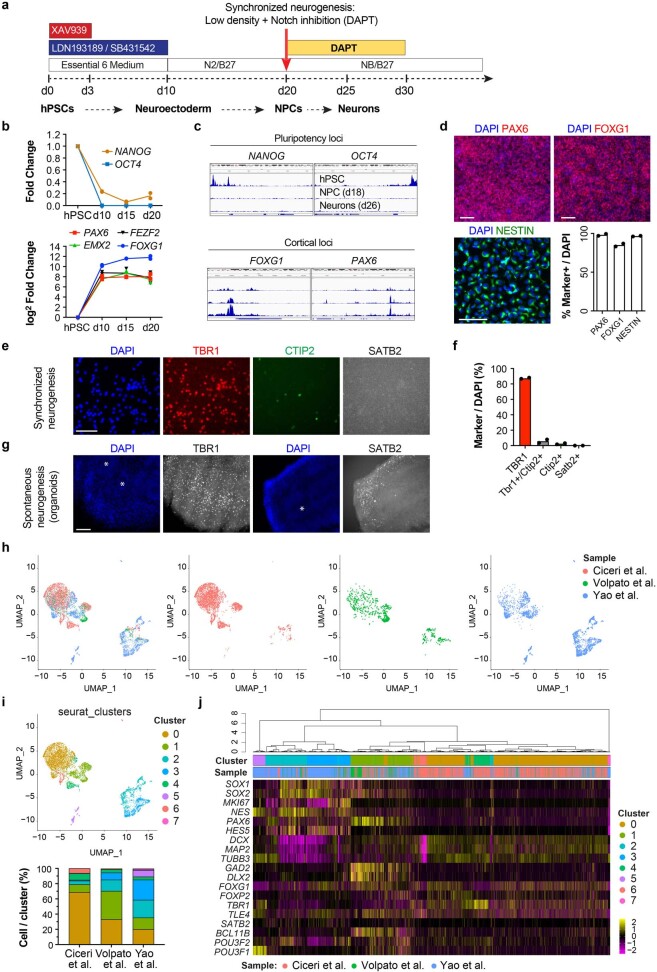
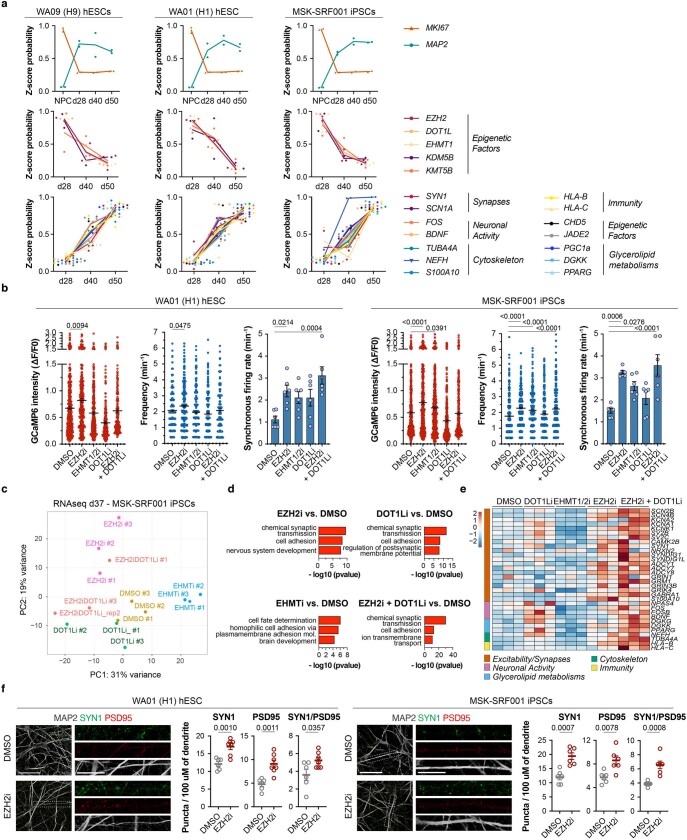
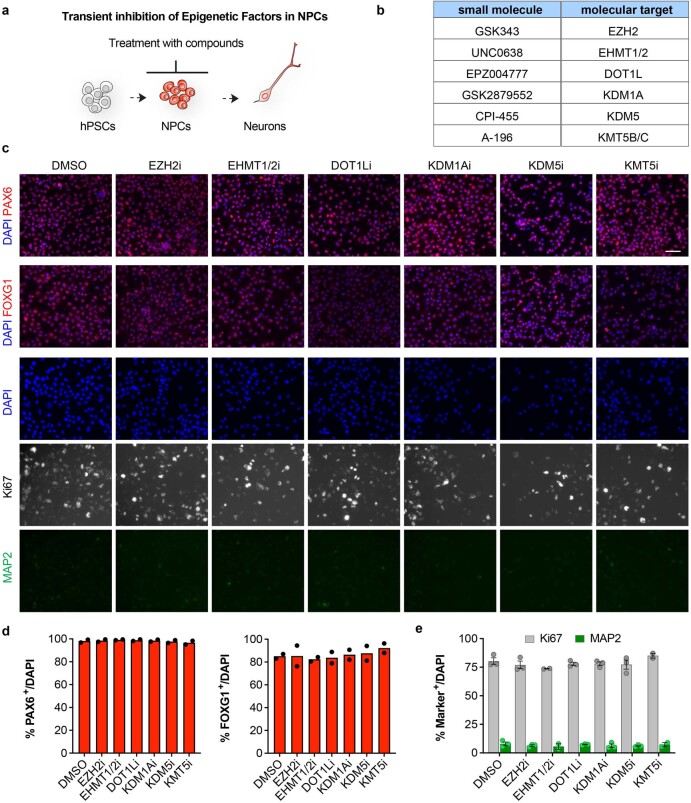
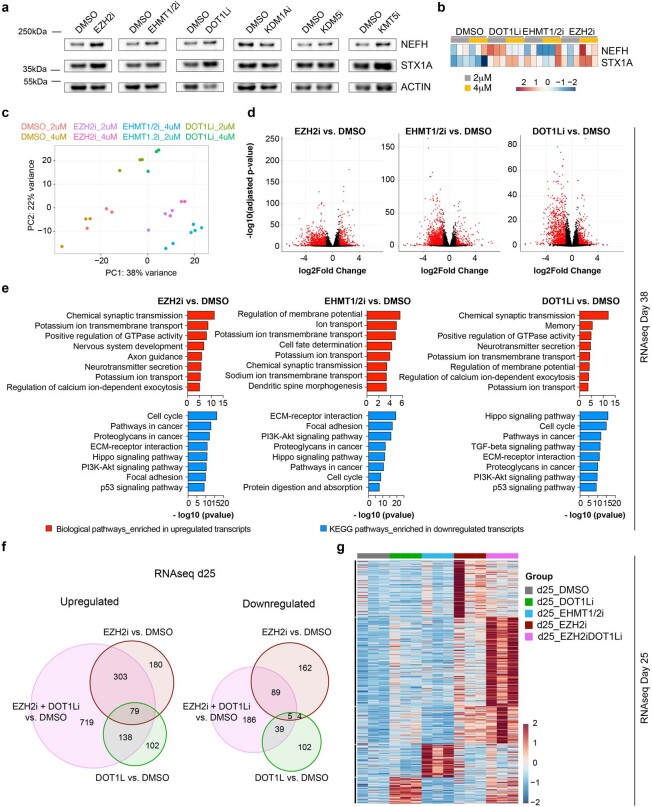
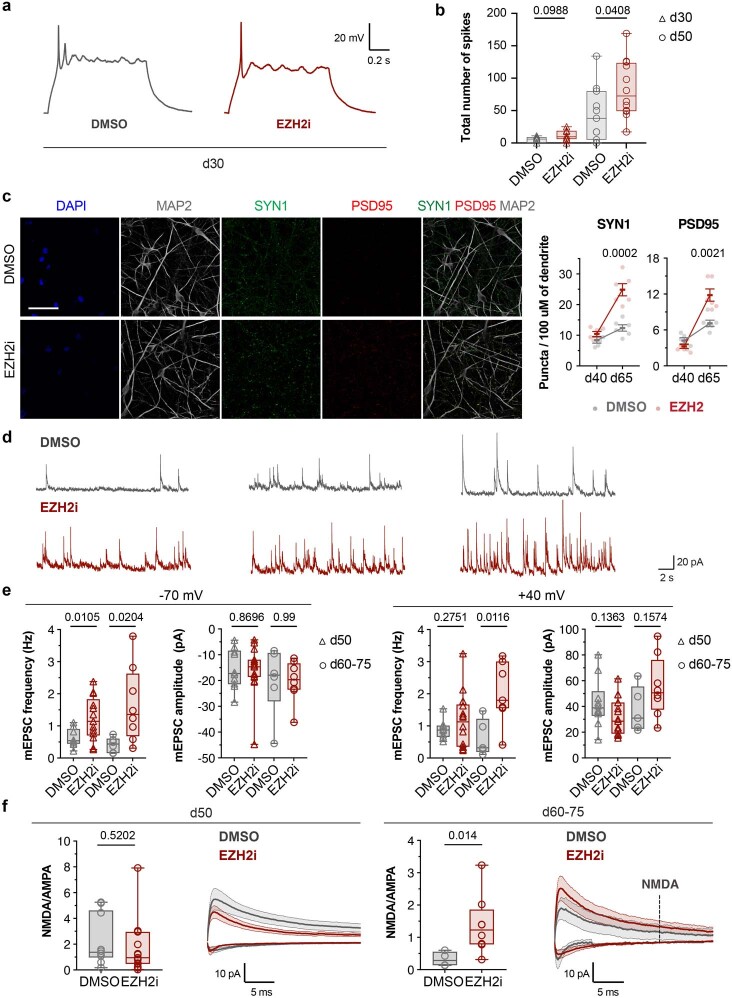
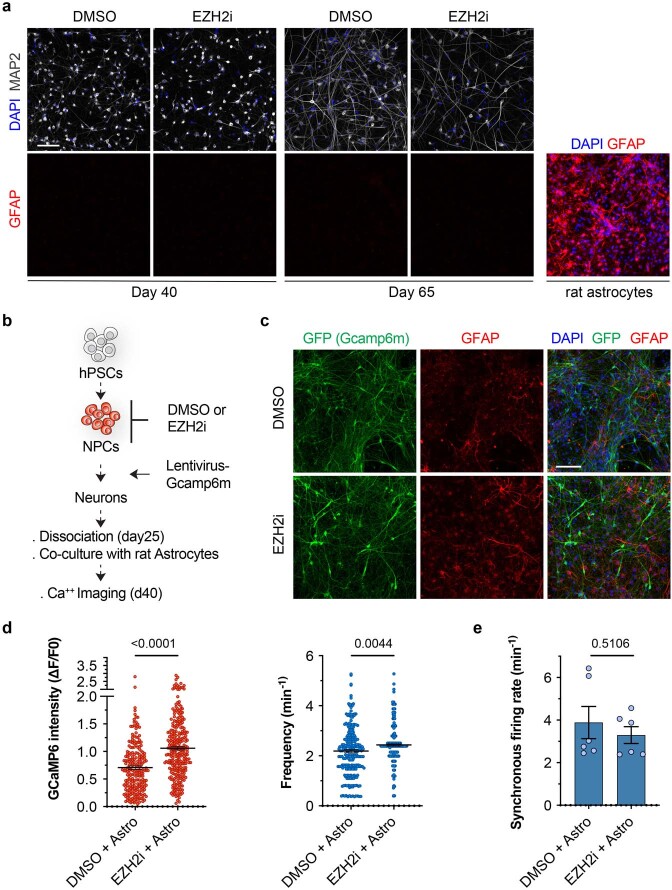
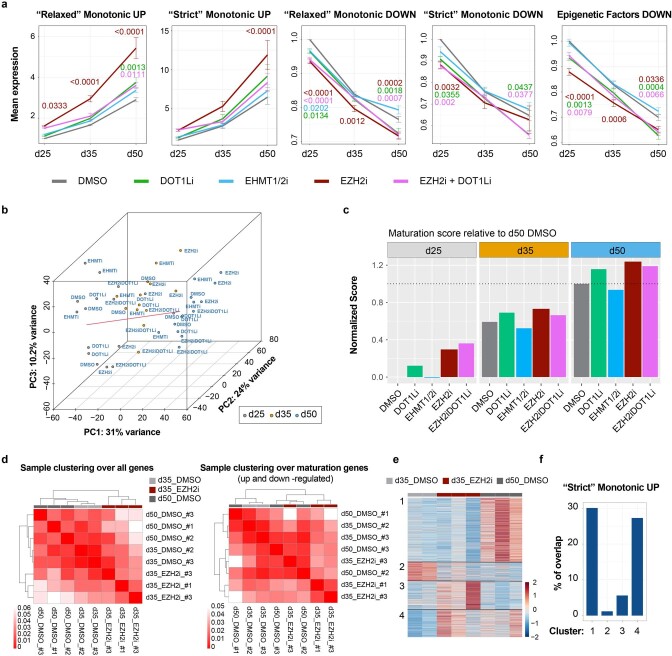
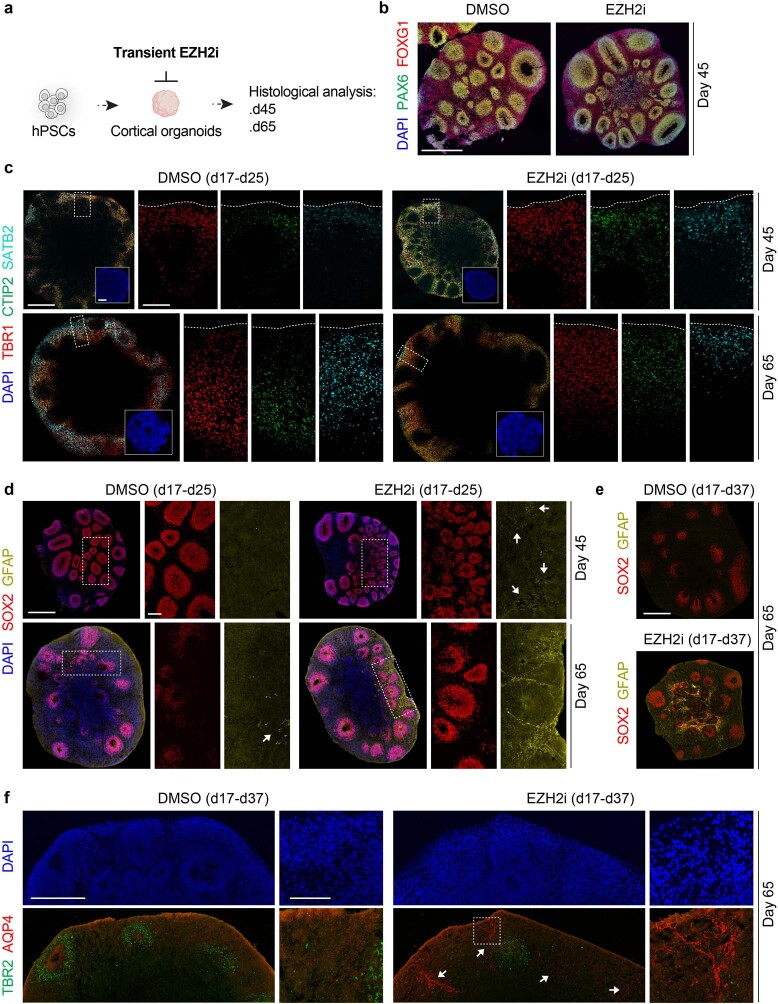
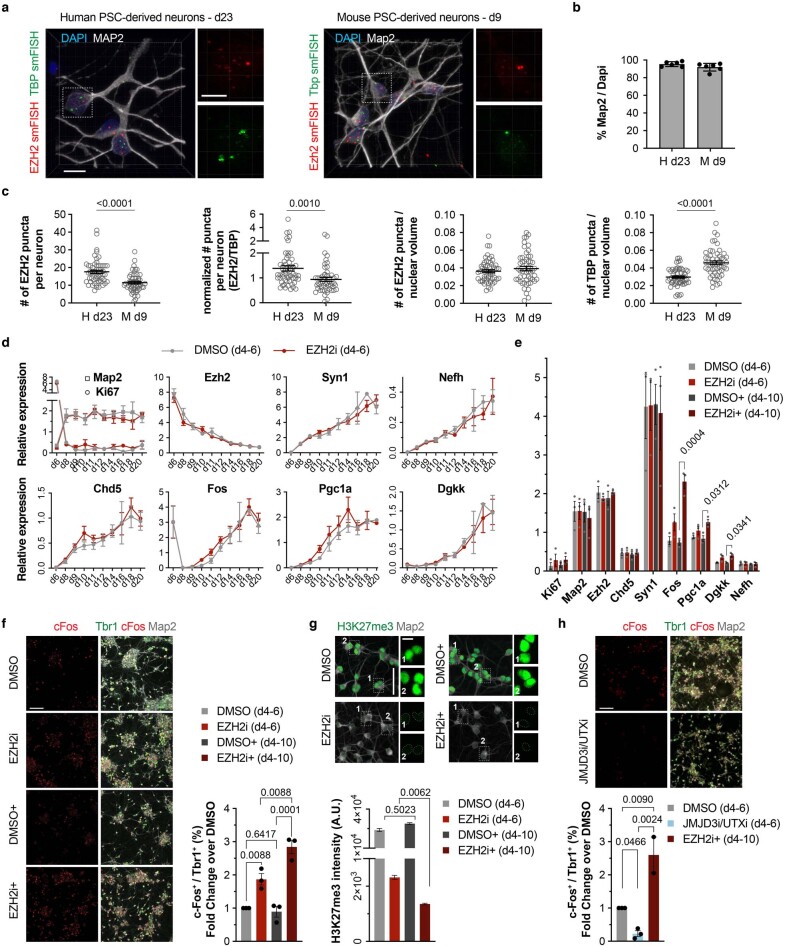
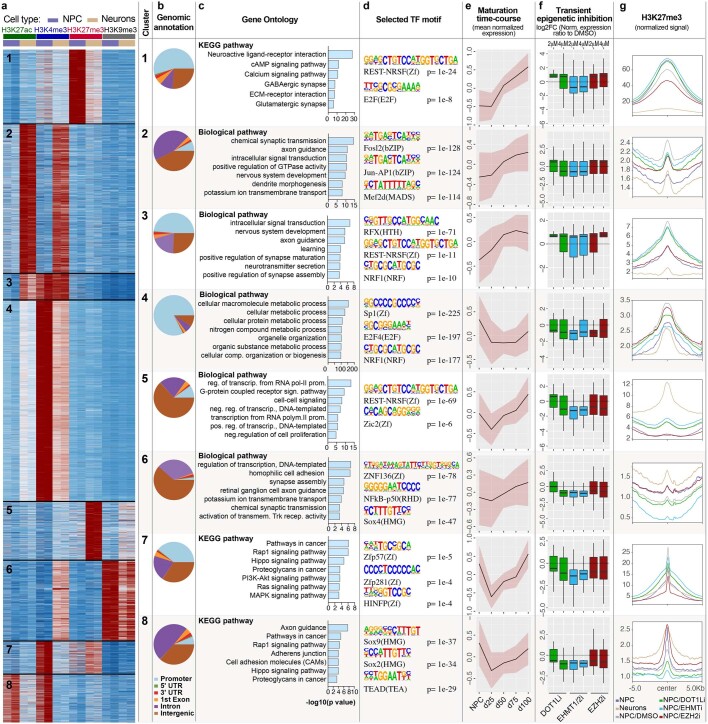
The pace of human brain development is highly protracted compared with most other species1-7. The maturation of cortical neurons is particularly slow, taking months to years to develop adult functions3-5. Remarkably, such protracted timing is retained in cortical neurons derived from human pluripotent stem cells (hPSCs) during in vitro differentiation or upon transplantation into the mouse brain4,8,9. Those findings suggest the presence of a cell-intrinsic clock setting the pace of neuronal maturation, although the molecular nature of this clock remains unknown. Here we identify an epigenetic developmental programme that sets the timing of human neuronal maturation. First, we developed a hPSC-based approach to synchronize the birth of cortical neurons in vitro which enabled us to define an atlas of morphological, functional and molecular maturation. We observed a slow unfolding of maturation programmes, limited by the retention of specific epigenetic factors. Loss of function of several of those factors in cortical neurons enables precocious maturation. Transient inhibition of EZH2, EHMT1 and EHMT2 or DOT1L, at progenitor stage primes newly born neurons to rapidly acquire mature properties upon differentiation. Thus our findings reveal that the rate at which human neurons mature is set well before neurogenesis through the establishment of an epigenetic barrier in progenitor cells. Mechanistically, this barrier holds transcriptional maturation programmes in a poised state that is gradually released to ensure the prolonged timeline of human cortical neuron maturation.


Conflict of interest statement

L.S. is a scientific founder and paid consultant of BlueRock Therapeutics and a scientific co-founder of Dacapo BrainScience. L.S. and G.C. are listed as inventors on provisional patent applications owned by MSKCC related to the differentiation of cortical neurons from pluripotent stem cells and methods for promoting in vitro maturation of cells. The remaining authors declare no competing interests.

Figures

Fig. 1
Fig. 1. Morphological and functional maturation of synchronized cortical neurons derived from hPSCs.
a, Experimental paradigm. hPSC-derived cortical NPCs were induced for synchronized neurogenesis at d20, and neurons were analysed at d25, d50, d75 and d100. b, Representative images of neuronal cultures stained for TBR1. c, Expression of MKI67 and MAP2 throughout the differentiation by quantitative PCR with reverse transcription (RT–qPCR). n = 2 independent experiments. df, Representative reconstructions of neuronal morphologies (d) and quantification of neurite length (e) and complexity (Sholl analysis) (f). d25: n = 16; d50: n = 20; d75: n = 23; d100: n = 18 (neurons from 2 independent experiments). g, Representative traces of electrophysiological recordings of evoked action potentials. h, Quantification of electrophysiological measurement of action potential amplitude and rise slope in neurons over time. d25: n = 25; d50: n = 33; d75: n = 43; d100: n = 29 (neurons from 10 independent experiments). i, Representative trace of mEPSCs at d75. j, Representative maximal intensity projection of Ca2+ imaging at d70. k, Representative traces of normalized GCaMP6m intensity in d40 and d70 neurons l, Quantification of amplitude and frequency of spontaneous Ca2+ spikes. d40: n = 395; d60: n = 418; d70: n = 299; d80: n = 239 (neurons from 2 independent experiment). m, Synchronous firing rate per min of imaging. n = 10 fields of view (FOV) per timepoint from 2 independent experiments. n, Representative images of SYNI and MAP2 staining in maturing neurons. Regions highlighted in the main image are enlarged on the right. o, Heat map for the normalized expression of selected transcripts important for neuronal functionality by RNA-seq. n = 3 independent experiments. CaMK, Ca2+/calmodulin-dependent protein kinase. Data are mean ± s.e.m. Scale bars: 50 μm (b); 100 μm (d,j); 50 μm (n) and 20 μm (n, enlarged view). Two-tailed unpaired t-test (e,h,m). Welch’s one-way ANOVA with Games–Howell’s correction (l). Source Data
Fig. 2
Fig. 2. Molecular staging of neuronal maturation.
a, PCA plot of RNA-seq datasets show distribution of samples according to their time of differentiation based on top 1000 differentially expressed transcripts with variance stabilized normalization. b, Waterfall plot of top 150 pathways that are enriched in more mature neurons by GSEA in d50 versus d25 comparison. NES, normalized enrichment score. c, Heat map for the normalized temporal expression of strict monotonically upregulated transcripts (maximum log fold change (FC) >1 at any comparison, expression > 5 reads per kilobase per million mapped reads (RPKM) at any timepoint, s.e.m. at d100 < 1). d, Representative images of neurons at indicated timepoints, stained with antibodies for indicated maturation markers. e, PCA plot of ATAC-seq dataset shows distribution of samples according to their maturation stage. f, Agglomerative hierarchical clustering by Ward linkage of differentially accessible ATAC-seq peaks in neurons identifies nine groups of peaks with stage-specific accessibility. g, Top 15 enriched transcription factor binding motifs at late-opening ATAC-seq peaks by the hypergeometric test (top, group 2; bottom, group 3). Odds ratio indicates the normalized enrichment of transcription factor motifs in the cluster compared to the background. h, GO term analysis for genes linked at late-opening ATAC-seq group 2 (top) and 3 (bottom) peaks show enrichment for synaptic-related pathways. Fisher’s Exact test with Benjamini correction. Sig., signalling. RNA-seq and downstream analyses: n = 3 independent experiments; ATAC-seq and downstream analyses: n = 2 independent experiments. Source Data
Fig. 3
Fig. 3. An epigenetic switch drives neuronal maturation.
a, Waterfall plot of the top 100 pathways that are negatively correlated with neuronal maturation by GSEA in d50 versus d25 comparison of RNA-seq samples. n = 3 independent experiments. Red dots indicate epigenetic pathways. b, Heat map for normalized expression of monotonically downregulated chromatin regulators during maturation (with maximum logFC > 1 at any comparison). Top, epigenetic factors; bottom, transcription factors. n = 3 independent experiments. Labelled genes were selected for gene knockout studies. c, Experimental paradigm for gene knockout in cortical neurons derived from hPSCs: Cas9 expressing neurons at d25 were infected with lentiviruses encoding gene-specific gRNAs. Induction of precocious maturation was assessed by western blot (WB) at d35 and Ca2+ imaging at d40. Scale bar, 50 μm. d, Normalized expression by western blot of the maturation markers NEFH and STX1A upon gene knockout in neurons (two gRNAs per gene). Histograms depict average log2FC ± s.e.m. over non-targeting gRNA samples. Dots represent independent experiments. e, Amplitude of spontaneous Ca2+ spikes of individual neurons upon gene knockout. The dotted line represents the average amplitude for the two non-targeting gRNA. Dots represent individual neurons from two independent experiments. f, Branching lineage tree from scRNA-seq data of mouse development (Di Bella et al.) showing Dcx expression. g, Temporal expression of mouse chromatin regulator genes homologous to the human genes that are perturbed in hPSC-derived neurons (d) across multiple neuron subtypes in the mouse neocortex. UP, upper layer; DL, lower layer; CPN, callosal projection neurons; SCPN, subcerebral projection neurons; NP, near projecting; CThPN, cortico-thalamic projection neurons. ****P < 0.0001, ***P < 0.001, **P < 0.01, *P < 0.05. NS, not significant. n and P values in d and e are reported in Supplementary Tables 2 and 3. Two-tailed one sample t-test (d); Welch’s one-way ANOVA with Games–Howell’s multiple comparisons test (e). Source Data
Fig. 4
Fig. 4. Transient inhibition of epigenetic factors in NPCs drives faster maturation in neurons.
a, Temporal expression of epigenetic hits from gene knockout studies by RNA-seq (n = 3 independent experiments). b, Experimental paradigm. NPCs were treated transiently (d12 to d20) with epigenetic inhibitors. Neuronal maturation was assessed by western blot and Ca2+ imaging. c, Normalized expression of NEFH and STX1A by western blot. EZH2i, DOT1Li: n = 5; EHMT1/2i: n = 4; KMT5i: n = 2; KDM1Ai (STX1A), n = 3; KDM1Ai (NEFH) n = 4 (independent experiments). d, Amplitude and frequency of spontaneous Ca2+ spikes. DMSO: n = 292; EZH2i: n = 317; EHMT1/2i: n = 331; DOT1Li: n = 309; KDM1Ai: n = 282; KDM5i: n = 326; KMT5i: n = 326; EZH2i + DOT1Li: n = 221 (neurons from 2 independent experiment) e, Synchronous firing rate. DMSO, EZH2i, EHMT1/2, DOT1Li: n = 6; KDM1A: n = 2; KDM5i, KMT5i: n = 3 (FOV from 2 independent experiments). f, Representative traces of normalized GCaMP6m signal. g,h, Representative traces at d50 (g) and number of evoked action potentials (h) per injected current. DMSO: d30, n = 7; d50, n = 11. EZH2i: d30, n = 8; d50, n = 12 (neurons). Error bands indicate s.e.m. i,j, Representative traces (i) and amplitude and frequency (j) of mEPSCs (+40 mV, d60–d75). DMSO: n = 5; EZH2i: n = 8 (neurons). k, Representative images and quantification of juxtaposed SYN1–PSD95 puncta. n = 6 FOV from 2 independent experiments. Scale bar, 25 μm. l, Normalized expression (to d25 DMSO) of ‘relaxed’ monotonic upregulated transcripts by RNA-seq in neurons from EZH2i and DMSO-treated NPCs. n = 3 independent experiments. m, Experimental paradigm for transient EZH2i in forebrain organoids and representative image of Ca2+ imaging at d55. Scale bar, 50 μm. n, Amplitude and frequency of spontaneous Ca2+ spikes in organoids. DMSO: n = 222; EZH2i: n = 297 (4–8 organoids per condition from 2 batches). Data are mean ± s.e.m. Two-tailed ratio-paired t-test (c); Welch’s one-way ANOVA with Games–Howell’s correction (d); one-way ANOVA with Dunnett’s correction (e); mixed-effect model with Tukey’s correction (h); Kolmogorov–Smirnov test (j); two-tailed unpaired t-test (k); two-way ANOVA with Šidák correction (l); two-tailed Welch’s test (n). Source Data
Fig. 5
Fig. 5. An epigenetic barrier in NPCs controls the onset of neuron maturation programmes.
a, Heat map for cleavage under targets and release using nuclease (CUT&RUN) peaks with bivalent status in NPCs that get resolved towards active chromatin via H3K27me3 reduction in neurons (n = 2 independent experiments). Data are normalized signal from cluster 1 from CUT&RUN in Extended Data Fig. 10. b, Heat map for the normalized expression of representative bivalent genes by RNA-seq of d38 neurons derived from treated NPCs (2 and 4 μM) (n = 3 independent experiments). c, Tornado plots for the normalized H3K4me3 and H3K27me3 signals at bivalent peaks in NPCs upon epigenetic inhibition (n = 2 replicates per condition). d, Normalized H3K27me3 signal at bivalent peaks in NPCs upon epigenetic inhibition, untreated NPC and neurons. e, Representative tracks of H3K27me3, H3K4me3 and H3K27ac (untreated NPCs and neurons) and H3K27me3 (NPCs upon EZH2i and DMSO treatments) at CHD5 and JADE2 genomic loci. f,g, CHD5 and JADE2 expression by RNA-seq during maturation (f) and in d38 neurons derived from NPC upon epigenetic inhibition versus DMSO (2 and 4 μM) (g). n = 3 independent experiments. h, Amplitude of spontaneous Ca2+ spikes in neurons from EZH2i versus DMSO conditions derived from wild-type (WT), CHD5-knockout (KO) and JADE2-KO hPSC lines. DMSO: WT, n = 241; CHD5-KO clone 1, n = 184; CHD5-KO clone 2, n = 165; JADE2-KO clone 1, n = 183; JADE2-KO clone 2, n = 171 JADE2-KO clone 1,. EZH2i: WT, n = 190; CHD5-KO clone 1, n = 197; CHD5-KO clone 2, n = 147; JADE2-KO clone 1, n = 222; JADE2-KO clone 2, n = 213 (neurons from 2 independent experiments). i,j, Main conclusions of the study. i, The gradual unfolding of maturation signatures in hPSC-derived neurons is marked by the retention of an epigenetic barrier established at NPC stage. j, Key members of the epigenetic barrier maintain maturation programmes in a poised state through the deposition of repressive histone marks. Ub, ubiquitin. Data are mean ± s.e.m. Wald’s test with Benjamini–Hochberg correction (g); Welch’s one-way ANOVA with Games–Howell’s correction (h). Source Data
Extended Data Fig. 1
Extended Data Fig. 1. A novel platform for the synchronized generation of cortical neurons from hPSCs.
a, Schematics of differentiation protocol based on dual-SMAD and WNT inhibition. Top panel indicate differentiation days, basal media, and small molecules treatments. Bottom panel indicate cell stages/types found at transition points. The red arrow indicates cell-passaging at low density in presence of notch pathway inhibitor DAPT. b, Expression of pluripotency (top) and cortical (bottom) specific markers by RT-qPCR throughout the differentiation (n = 2 independent experiments). c, Representative Genome browser traces of ATACseq peaks at hPSC, NPC and neuron stages in Pluripotency (NANOG, OCT4) and cortical (PAX6, FOXG1) loci (n = 2 independent experiments). d, Representative images and quantification of the fraction of cells expressing PAX6, FOXG1 and NESTIN cortical NPC markers at d20 of differentiation (n = 2 independent experiments). ef, Representative images (e) and quantification (f) of the fraction of neurons generated through synchronized neurogenesis and expressing TBR1, CTIP2 and SATB2 cortical neuron markers (n = 2 independent experiments). g, Representative images of neurons generated through spontaneous neurogenesis (cortical organoids) and stained with antibodies against cortical neurons markers (n = 2 independent experiments). * Marks rosette structures of neural precursor cells. h, Single-cell RNAsequencing (scRNA-seq) experiments showing UMAP plots for the integrated dataset from the present study, Volpato et al., and Yao et at. i, Seurat clusters (top) and bar plot (bottom) for percentage of cells in each cluster across datasets. h, Hierarchical clustering of integrated scRNA-seq showing the expression of indicated markers across samples of origin and Seurat clusters. Colors for samples and clusters match those of (h) and (i). Histograms depict mean ± s.e.m. Scale bars are 50 μm (e); 100 μm (d) and 200 μm (g). Source Data
Extended Data Fig. 2
Extended Data Fig. 2. Validation of maturation signatures and paradigms of epigenetic inhibition in neurons derived from additional hPSC and iPSC lines.
a, RT-qPCR expression analysis of NPC and neuron markers (top), selected epigenetic factors (middle) and maturation markers capturing several maturation phenotypes (bottom), upon synchronized differentiation of WA09 and WA01 hPSC and MSK-SRF001 iPSC. Data are represented as z-score normalized expression (n = 2 independent experiments per cell line). b, Quantification of amplitude and frequency of spontaneous Ca2+ spikes and synchronous firing rate in neurons derived from treated versus DMSO control NPCs of WA01 hESC and MSK-SRF001 iPSC. Amplitude and frequency, WA01: DMSO n = 352, EZH2i n = 313, EHMT1/2i n = 324, DOT1Li n = 310, EZH2i + DOT1Li n = 184; MSK-SRF001: DMSO n = 423, EZH2i n = 372, EHMT1/2i n = 485, DOT1Li n = 362, EZH2i + DOT1Li n = 315 (neurons from 2 independent experiments). Synchronous firing rate (n = 6 FOV from 2 independent experiments). ce, RNA-seq studies in d37 neurons derived from MSK-SRF001 iPSC upon NPC treatments versus DMSO control conditions. PCA plot for RNA-seq datasets show samples distribution according to treatments (c). GO for upregulated transcripts (d). Heatmap for the normalized expression of representative transcripts within selected bivalent genes in treated and control conditions (e). n = 3 independent experiments. f, Representative images and quantification of the number of SYN1 and PSD95 synaptic puncta in d65 neurons derived from EZH2i versus DMSO conditions from WA01 and MSK-SRF001 lines (n = 6 FOV from 2 independent experiments per each line). Data is mean ± s.e.m. Welch’s one-way ANOVA with Games-Howell’s multiple comparisons test (amplitude and frequency in b); ordinary one-way ANOVA with Dunnett correction (synchronicity in b); Fisher’s Exact test (d); two-tailed unpaired t-test (f). Scale bars in (f) are 50 μm and 25 μm (insets). FOV, field of view. Source Data
Extended Data Fig. 3
Extended Data Fig. 3. Transient inhibition of epigenetic factors in NPC does not alter cortical patterning and neurogenesis.
a, Schematic of experimental paradigm for transient inhibition of chromatin regulators at progenitor cell stage. NPC were treated with small molecule from d12 to d20. b, Small molecule compounds used in the study and corresponding intracellular targets. c, Representative images of d20 NPCs treated with small molecule before the induction of synchronized neurogenesis and stained with antibodies against cortical markers PAX6 and FOXG1, the proliferation marker Ki67 and the neuron marker MAP2. d, Quantification of the fraction of cells expressing PAX6 and FOXG1 at d20 in treated versus control conditions (n = 2 independent experiments). e, Quantification of the fraction of progenitor cells (KI67 +) and neurons (MAP2 +) at d20 in treated versus control conditions. DMSO n = 3, EZH2i n = 3, EHMT1/2i n = 2, DOT1Li n = 3, KDM1Ai n = 3, KDM5i n = 3, KMT5i n = 2 (independent experiments). Histograms depict mean ± s.e.m. Scale bars are 50 μm. Source Data
Extended Data Fig. 4
Extended Data Fig. 4. A small molecule mini screen identify EZH2, EHMT1/2 and DOT1L inhibition in NPC as a maturation driver in neurons.
a, Representative western blots for the expression of NEFH and STX1A maturation markers in the transient inhibition of epigenetic factors in NPC experiments. NPC were treated with small molecule from d12 to d20 and neurons derived from each condition were analysed at d38. Quantification is shown in Fig. 4c. Gels/blots from the same experiments were processed in parallel. n = 2–5 independent experiments b, Heatmap for the expression of NEFH and STX1A by RNA-seq across treatments. c, PCA plot for RNA-seq dataset at d38 show samples distribution according to the pharmacological treatments (n = 3 independent experiments). d, Volcano plot for the indicated pairwise comparisons from RNA-seq studies (treatment with 4 μM of inhibitors). Red dots represent differentially expressed significant transcript (FDR 0.05) that show Fold Change >=2. e, GO for upregulated (top) and downregulated (bottom) transcripts from RNA-seq studies in pairwise comparisons (n = 3 independent experiments). f, Venn diagram for upregulated and downregulated transcripts by RNA-seq at d25 in neurons derived from transient treatment with EZH2i, DOT1Li and combined EZH2i + DOT1Li (n = 3 independent experiments). g, Heatmap showing k-means clustering for the normalized expression of “relaxed” monotonically upregulated transcripts that are differentially expressed in d25 neurons upon indicated treatments and combination (logFC > 1, FDR < 0.05). Wald’s test with Benjamini-Hochberg false discovery rate (d); Fisher’s Exact test (e). Source Data
Extended Data Fig. 5
Extended Data Fig. 5. Transient EZH2i in NPCs triggers enhanced synaptic maturation in neurons.
a, Representative traces of evoked action potentials at d30 in EZH2i versus DMSO conditions. b, Quantification of the total number of spikes in neurons at d30 and d50 from EZH2i versus DMSO conditions. DMSO: d30 n = 7, d50 n = 11; EZH2i: d30 n = 8, d50 n = 12. c, Representative images (d65) and quantification (d40 and d65) for the number of SYN1 and PSD95 puncta in neurons from DMSO and EZH2i groups (n = 6 FOV from 2 independent experiments). whiskers are mean ± s.e.m. Insets are shown in Fig. 4k. d, Additional traces for mEPSC recorded at +40 mV in d60-75 neurons from EZH2i and DMSO groups. e, Quantification of amplitude and frequency of mEPSCs recorded at −70mV and +40 mV in d50 and d60-75 neurons from EZH2i versus DMSO conditions. −70mV frequency: DMSO d50 n = 9, EZH2i d50 n = 13, DMSO d60-75 n = 6, EZH2i d60-75 n = 8. −70mV amplitude: DMSO d50 n = 10, EZH2i d50 n = 15, DMSO d60-75 n = 6, EZH2i d60-75 n = 8. +40 mV frequency: DMSO d50 n = 10, EZH2i d50 n = 14, DMSO d60-75 n = 5, EZH2i d60-75 n = 7. +40 mV amplitude: DMSO d50 n = 10, EZH2i d50 n = 15, DMSO d60-75 n = 5, EZH2i d60-75 n = 8 neurons. f, Quantification of the NMDA/AMPA ratio in neurons at d50 and d60-75 from EZH2i and DMSO conditions. Averaged traces of the mEPSC are shown on the right. Error bands depict s.e.m. DMSO d50 n = 10; EZH2i d50 n = 15; DMSO d60-75 n = 4; EZH2i d60-75 n = 8. In (b) (e) (f) boxes extend from the 25th to 75th percentiles and the middle line represents the median; whiskers extend from min to max data points. Two-tailed t-test (c); two-tailed Welch’s test (b, e, f). Scale bars are 50 μm. FOV, field of view. Source Data
Extended Data Fig. 6
Extended Data Fig. 6. Transient inhibition of EZH2 triggers enhanced neuronal maturation even in the presence of astrocytes.
a, Transient inhibition of EZH2 at NPC stage does not trigger the generation of astrocytes under synchronized neurogenesis conditions. Representative images of MAP2 and GFAP staining at d40 and d65 in cultures derived following the synchronized neurogenesis paradigm upon EZH2i versus DMSO. Primary rat astrocytes are positive control for the GFAP staining. b, Schematic of experimental paradigm for the Ca2+ imaging of hPSC-derived neurons in EZH2i and DMSO conditions in co-culture with primary rat astrocytes. hPSC-derived neurons were infected with GCamp6m lentiviruses four days before dissociation and prior to seeding onto rat primary astrocytes. c, Representative images of hPSC-derived neurons expressing GCamp6m in co-culture with rat primary astrocytes. d, Amplitude and frequency of spontaneous Ca2+ spikes of individual neurons. DMSO + Astro n = 225, EZH2i + Astro n = 264 (neurons from 2 independent experiments). e, Synchronicity rate of spontaneous network activity in EZH2i versus DMSO conditions in co-culture with rat astrocytes (n = 6 FOV from 2 independent experiments). Two-tailed Welch’s test (d, e) Scale bars are 100 μm. FOV, Field of View. Source Data
Extended Data Fig. 7
Extended Data Fig. 7. Temporal analysis of maturation signatures upon transient epigenetic inhibition and maturation scoring.
a, RNA-seq analysis for the temporal expression of “relaxed” and “strict” monotonic up and down -regulated transcripts during maturation in neurons derived from NPC treated with inhibitors of epigenetic pathways. Data are normalized to d25 DMSO control condition and represented as mean ± s.e.m (n = 3 independent experiments). b, PCA plot for the sample distribution in the space defined by PCA1, 2 and 3. Red line indicate the vector for the maturation of control DMSO samples used as a reference to score epigenetic perturbations. c, Score for the maturation level achieved by neurons upon transient epigenetic inhibition at NPC stage compared to DMSO controls based on the dot product similarity metrics for RNA-seq samples in the coordinate system defined by 3 Principal Components (see Methods). d, Cross-correlation analysis based on the whole transcriptome (left) and based on the merged up and down -regulated maturation transcripts from lists in (a) (left) of RNA-seq samples of neurons from d35 EZH2i group with d35 and d50 neurons from DMSO condition. e, k-means clustering analysis of differentially expressed genes (with fold change > = 2 and FDR-adjusted p-value < 0.05, Wald’s test with Benjamini-Hochberg false discovery rate) between d25, d35 and d50 DMSO and between d35 EZH2i versus d35 DMSO contrasts. f, Percent overlap of the genes in cluster 1–4 from (e) with the “strict” monotonic upregulated transcript during maturation. Ordinary two-way ANOVA with Šídák’s multiple comparison test of treatment versus DMSO at each time point (a). Wald’s test with Benjamini-Hochberg false discovery rate (e). Source Data
Extended Data Fig. 8
Extended Data Fig. 8. EZH2i accelerates cell-fate specification under spontaneous neurogenesis in human cortical 3D organoids.
a, Schematic of experimental paradigm for transient inhibition of EZH2 in forebrain organoids. WA09 hPSC-derived organoids were transiently treated with GSK343 or DMSO after the specification of cortical identity (d17-d25 or d17-37 depending on the experiment as specified in the figure panels) and analysed for the generation of cortical cell identities using representative markers at d45 and d65. b, Representative images of FOXG1 and PAX6 staining in organoids at d45 showing the acquisition of cortical identity in EZH2i and DMSO control conditions. c, Representative images of organoids at d45 and d65 stained for the cortical layer markers TBR1, CTIP2 and SATB2 showing the reduction of SATB2-expressing neurons at d65 in EZH2i versus DMSO control conditions. Insets show the general morphology of organoids with the nuclei staining DAPI. de, Representative images of organoids at d45 and d65 stained for the NPC marker SOX2 and the astrocyte marker GFAP showing the precocious emergence of astrocytes surrounding SOX2+ neural rosettes in EZH2i versus DMSO control conditions (d-e). The appearance of GFAP+ cells is enhanced in longer treatment condition with EZH2 inhibitor GSK343 (e). f, Representative images of organoids at d65 stained with the intermediate progenitor cell marker TBR2 and the astrocyte marker AQP4 confirming the precocious emergence of astrocytes in EZH2i versus DMSO control conditions. Dotted boxes depict organoid regions showed at higher magnification in each panel. Arrows in (e) and (f) mark GFAP+ fibers and AQP4+ cells respectively. n = 5–6 organoids from 2 independent experiments per condition. Scale bars are 500 μm in whole organoid sections and 100 μm for the regions identified by dotted box and showed at higher magnification in all figure panels.
Extended Data Fig. 9
Extended Data Fig. 9. Impact of EZH2i on the maturation of mouse PSC-derived neurons.
ac, Representative images (a) and quantification (c) of smRNA FISH for EZH2 and TBP coupled with MAP2 immunocytochemistry in the newly born neurons derived from hPSC and mEpiSC at d23 and d9 respectively. (b) depicts the fraction of neurons at comparable differentiation stages in human versus mouse neurons (n = 6 FOV from 2 independent experiments). (c) depicts neurons. Human d23 n = 57, mouse d9 n = 52 (neurons from 8 FOV from 2 independent differentiations). d, RT-qPCR expression of neuronal maturation markers upon treatment of mEpiSC-derived NPC with GSK343 and DMSO. d6 n = 5; d8 n = 5; d9 n = 4; d10 n = 5; d11 n = 4; d12 n = 5; d14 n = 5 (DMSO), n = 4 (Ezh2i); d16 n = 2 (DMSO), n = 3 (Ezh2i); d18 n = 2; d20 n = 3(independent experiments). e, RT-qPCR expression of maturation markers in mEpiSC-derived neurons at d12 upon different treatment durations with GSK343 and DMSO (n = 3 independent experiments). f, Representative images (left) and quantification (right) of the fraction of c-Fos+/Tbr1+ mEpiSC-derived neurons at d12 upon different durations of treatment with GSK343 and DMSO (n = 3 independent experiments). g, Representative images (top) and quantification (bottom) of the mean intensity of H3K27me3 staining in MAP2+ mEpiSC-derived neurons at d12. n = 30 neurons from 2 independent experiments. h, Representative images (top) and quantification (bottom) of the fraction of c-Fos+/Tbr1+ mEpiSC-derived neurons at d12 upon treatment with Ezh2i, DMSO and JMJD3i/Utxi. DMSO and JMJD3i/Utxi n = 3, EZH2i+ n = 2 (independent experiments). Ezh2i: 4uM GSK343 d4-6. Ezh2i +: 4uM GSK343 d4-6 plus 2uM GSK343 d6-10. JMJD3i/Utxi: 1uM GSK J4 d4−6. Histograms depict mean ± s.e.m. Two-tailed Welch’s test (c); ordinary one-way ANOVA with Holm-Šídák’s correction (e, f, h); Kruskal-Wallis test with Dunn’s correction (g). Scale bars are 100 μm (f, h); 50 μm (g); 10 μm (insets in g). FOV, field of view. Source Data
Extended Data Fig. 10
Extended Data Fig. 10. Patterns of histone post translational modifications drive the maturation of hPSC-derived neurons.
a, Unsupervised clustering of CUT&RUN peaks with differential density in H3K27ac, H3K4me4, H3K27me3 and H3K9me3 signal among NPC and neurons (n = 2 replicates/condition). b, Pie charts of CUT&RUN peaks mapped to gene promoters, introns, exons, and intergenic genomic regions for each of the cluster. c, GO for genes linked at each cluster. d, Top selected statistically significant enriched transcription factor motifs at peaks in each cluster. e, Mean normalized expression (z-transform) of differentially expressed genes during the maturation time course intersected with genes linked to each CUT&RUN cluster. Error bands are s.e.m. f, Expression of differentially expressed transcripts from (e) that were also differentially expressed in neurons derived from NPC treated with the indicated inhibitors compared to DMSO controls (data from RNAseq studies, n = 3 independent experiments). g, Normalized signal of H3K27me3 density in NPC treated with epigenetic inhibitors and untreated NPC and neurons. Pink area in (e) is s.e.m. Box plots in (f) depict the median as center bar, the boxes span 25th and 75th percentiles and whiskers are 1.5*interquartile range. Binomial test (d). Source Data

References

    1. Toma K, Wang TC, Hanashima C. Encoding and decoding time in neural development. Dev. Growth Differ. 2016;58:59–72. doi: 10.1111/dgd.12257. - DOI - PMC - PubMed
    1. Ebisuya M, Briscoe J. What does time mean in development? Development. 2018;145:dev164368. doi: 10.1242/dev.164368. - DOI - PMC - PubMed
    1. Zhu Y, et al. Spatiotemporal transcriptomic divergence across human and macaque brain development. Science. 2018;362:eaat8077. doi: 10.1126/science.aat8077. - DOI - PMC - PubMed
    1. Marchetto MC, et al. Species-specific maturation profiles of human, chimpanzee and bonobo neural cells. eLife. 2019;8:e37527. doi: 10.7554/eLife.37527. - DOI - PMC - PubMed
    1. Libe-Philippot B, Vanderhaeghen P. Cellular and molecular mechanisms linking human cortical development and evolution. Annu. Rev. Genet. 2021;55:555–581. doi: 10.1146/annurev-genet-071719-020705. - DOI - PubMed

MeSH terms