. 2024 Feb;626(7999):635-642.
doi: 10.1038/s41586-023-06991-9. Epub 2024 Jan 31.

Matrix viscoelasticity promotes liver cancer progression in the pre-cirrhotic liver

Affiliations

Matrix viscoelasticity promotes liver cancer progression in the pre-cirrhotic liver

Weiguo Fan et al. Nature. 2024 Feb.

Abstract

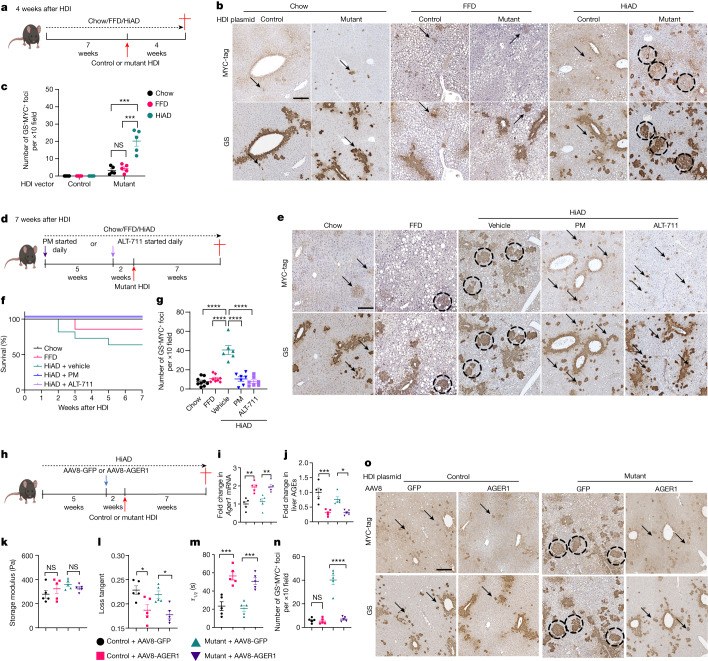
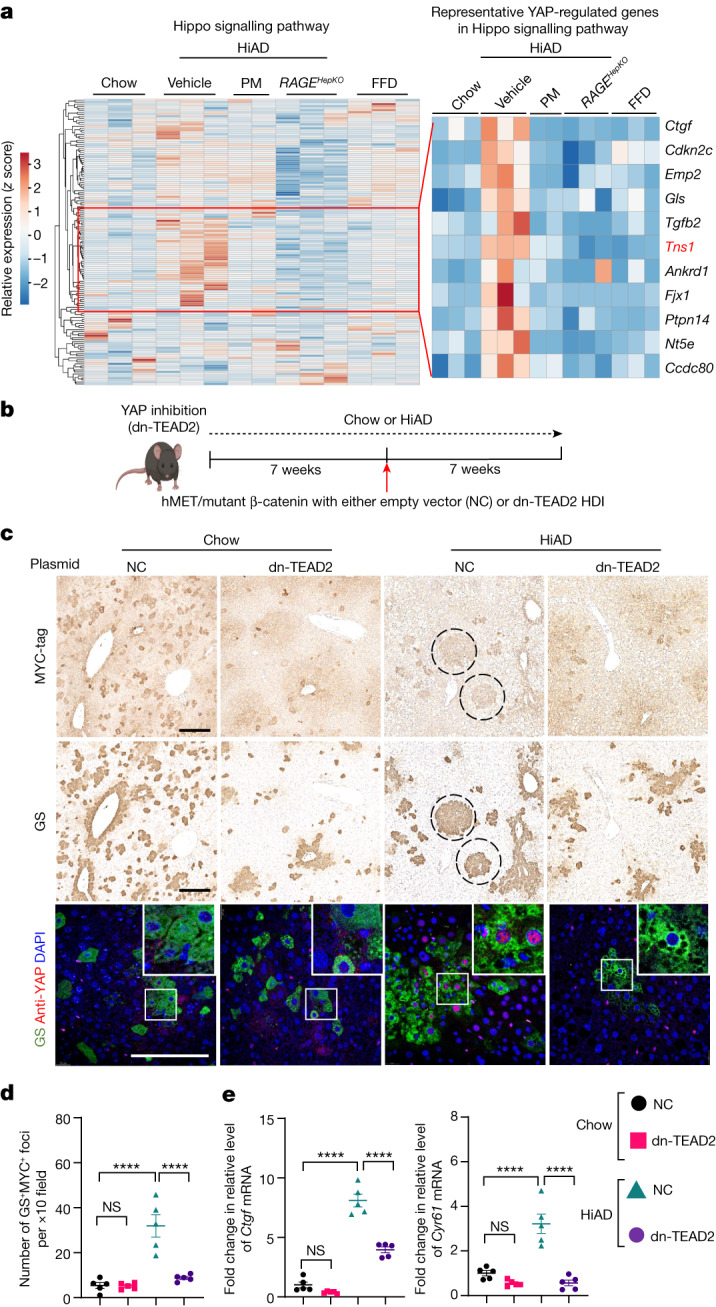
Type 2 diabetes mellitus is a major risk factor for hepatocellular carcinoma (HCC). Changes in extracellular matrix (ECM) mechanics contribute to cancer development1,2, and increased stiffness is known to promote HCC progression in cirrhotic conditions3,4. Type 2 diabetes mellitus is characterized by an accumulation of advanced glycation end-products (AGEs) in the ECM; however, how this affects HCC in non-cirrhotic conditions is unclear. Here we find that, in patients and animal models, AGEs promote changes in collagen architecture and enhance ECM viscoelasticity, with greater viscous dissipation and faster stress relaxation, but not changes in stiffness. High AGEs and viscoelasticity combined with oncogenic β-catenin signalling promote HCC induction, whereas inhibiting AGE production, reconstituting the AGE clearance receptor AGER1 or breaking AGE-mediated collagen cross-links reduces viscoelasticity and HCC growth. Matrix analysis and computational modelling demonstrate that lower interconnectivity of AGE-bundled collagen matrix, marked by shorter fibre length and greater heterogeneity, enhances viscoelasticity. Mechanistically, animal studies and 3D cell cultures show that enhanced viscoelasticity promotes HCC cell proliferation and invasion through an integrin-β1-tensin-1-YAP mechanotransductive pathway. These results reveal that AGE-mediated structural changes enhance ECM viscoelasticity, and that viscoelasticity can promote cancer progression in vivo, independent of stiffness.


Conflict of interest statement

W.F., N.J.T. and O.C. are listed as inventors on a patent (WO/2023/102546) related to this this research. The other authors declare no competing interests.

Figures

Fig. 1
Fig. 1. Viscoelasticity is increased in the livers of individuals with NASH and T2DM and in mice on a HiAD.
a, Schematic of AGE increase in NASH/T2DM. bf. b, Quantification of AGEs in the liver. c, Schematic of the AFM analysis. Indent-retract was used to generate force–distance curves. df, The stiffness (d; Young’s modulus), representative force–distance curves (e) and quantification of hysteresis area (f, viscoelasticity) were assessed using AFM. The average stiffness of the human cirrhotic liver is indicated by a dashed line. n = 4 (healthy controls), n = 6 (patients with NASH), n = 4 (T2DM) and n = 5 (NASH + T2DM) individuals. gk, Rheometry analysis of fresh liver tissues. g, Schematic of rheometry analysis of fresh liver tissues. h, Rheometry analysis of the storage modulus in precirrhotic livers. i, The loss tangent (viscoelasticity) in the livers of healthy participants, and individuals with NASH, T2DM or NASH/T2DM. j, Stress relaxation curves in liver samples from the different patient groups. Norm., normalized. k, Stress was normalized to the initial stress and depicted as τ1/2 (the timescale at which the stress is relaxed to half its original value). n = 4 (healthy controls), n = 4 (patients with NASH), n = 4 (T2DM) and n = 6 (NASH + T2DM) individuals. lp, Mice were placed onto a chow or FFD diet, or a HiAD diet with daily vehicle, AGE inhibitor (PM) or AGE-cross-linking inhibitor (alagebrium, ALT-711) treatment. l, Schematic of the experiment. i.p., intraperitoneal. m, Quantification of liver AGEs (from left to right, n = 8, 7, 9, 5 and 5). np, Liver stiffness (n; from left to right, n = 5, 5, 8, 9 and 6 mice) and viscoelasticity (stress relaxation curves (o) and hysteresis area (p); n = 5 mice in each group) were assessed using AFM. qt, Stiffness (q) and viscoelasticity (rt) were assessed using rheometry. From left to right, n = 5, 5, 8, 9 and 6 (q and r) and n = 7, 7, 8, 9 and 6 (t) mice. The diagrams in a and l were created using BioRender. Data are mean ± s.e.m. n values refer to individual mice. Statistical analysis was performed using one-way analysis of variance (ANOVA) followed by Tukey’s multiple-comparison test (bq and t) and two-sided Student’s unpaired t-tests (b, f and r). NS, not significant; *P < 0.05, **P < 0.01, ***P < 0.001, ****P < 0.0001. Source Data
Fig. 2
Fig. 2. Mice on a HiAD develop more transformed foci, and exhibit AGE-dependent higher viscoelasticity.
a, Schematic of the NASH-related HCC model (early timepoint). Mice were fed for 7 weeks with chow, FFD or HiAD. HDI was performed using vectors expressing human MET (pT3-EF5a-hMET) and sleeping beauty (SB) transposase combined with a vector expressing either wild-type (pT3-EF5a-β-catenin-MYC, control) or mutant (pT3-EF5a-S45Y-β-catenin-MYC) human β-catenin. Then, 4 weeks after HDI, the mice were euthanized. b, Immunohistochemistry on sequential slides for the co-localization of GS- and MYC-tag-positive foci (circles, more than 20 cells are considered to form a focus). Scattered positive cells denote transduced cells (arrows). GS at the baseline marks pericentral cells. c, Quantification of GS- and MYC-tag-positive foci 4 weeks after HDI. n = 5 each. d, Schematic of the NASH-related HCC model combined with AGE-lowering approaches; mice were euthanized 7 weeks after HDI. e, Immunohistochemistry on sequential slides showing the co-localization of GS- and MYC-tag-positive foci (circles). Scattered positive cells denote transduced cells (arrows). f, The survival rates of mice after HDI. n = 7 (chow), n = 7 (FFD), n = 11 (HiAD + vehicle), n = 7 (HiAD + PM) and n = 7 (HiAD + ALT) mice. g, Quantification of transformed foci 7 weeks after HDI. Left to right, n = 8, 8, 6, 7 and 7, 20 areas per mouse. h, Schematic of the NASH-related HCC model combined with AAV8-mediated AGER1 induction before HDI. i,j, Liver AGER1 (also known as Ddost) mRNA expression (i) and AGE levels (j) were assessed. n = 5 each. km, Rheometry data of studies on stiffness (k) and viscoelasticity (l, m) in AGER1-reconstituted mice. n = 5 each. n,o, Quantification of transformed foci (n = 5 each, 20 areas per mouse) (n) and GS and MYC immunohistochemistry analysis on sequential slides (o). Data are mean ± s.e.m. n values refer to individual mice. Statistical analysis was performed using one-way ANOVA followed by Tukey’s multiple-comparison test. For b, e and o, scale bars, 300 μm. ALT, alagebrium. The diagrams in a, d and h were created using BioRender. Source Data
Fig. 3
Fig. 3. AGEs modulate collagen architecture and network connectivity, leading to enhanced viscoelasticity in livers and 3D hydrogels.
a, Quantification of insoluble collagen (from left to right, n = 6, 6, 10, 5 and 5). b,c, SHG microscopy images of decellularized liver ECMs (b) (bundles, red arrows) and collagen hydrogels (c). Fibre lengths (CT-Fire) and fibre–fibre angles (ImageJ) were assessed (three mice or gels per group, five images per mouse or gel). d,e, Collagen hydrogels from c were assessed using rheometry for stiffness (d) and viscoelasticity (e), expressed as τ1/2 (the timescale at which stress is relaxed to half its original value). n = 5. f, Schematic of the collagen/IPN hydrogel. The diagram was adapted from ref. , under a Creative Commons licence CC BY 4.0. g, Confocal reflectance microscopy of collagen fibres after AGE ± ALT-711 exposure. hj, Insoluble collagen (h; n = 5), fibre lengths (i; CT-Fire) and angles (j; ImageJ) in the IPN gels. Data are from three images per gel, three gels per group. k, Representative stress relaxation curves from IPN gels. lo. Rheometry of IPN gels testing stiffness (l; storage modulus) and viscoelasticity (mo), showing the loss tangent (m) and stress relaxation (stress relaxation curves (n) and τ1/2 (o)) are shown. n = 6. p, Simulation modelling. A matrix structure consisting of individual fibrils (3 μm length) without (left) or with (right) bundlers connecting the ends of fibrils at θ = 10°. q, After a matrix is assembled, it is deformed by 20% shear strain. r, Stress relaxation is measured using the two matrices shown in p. s,t, Stress relaxation was studied using matrices with different bundle length (LB) with θ = 0° (s) or different bundling angle (θ) with LB = 3 μm (t). Data are mean ± s.e.m. (ao). n values refer to independent experiments. Statistical analysis was performed using Wilcoxon’s rank-sum tests (b and c), two-tailed unpaired t-tests (d, e and lo), Kruskal–Wallis tests with Dunn’s test (i and j) and one-way ANOVA followed by Tukey’s multiple-comparison test (h). For r–t, data are mean ± s.d. (n = 4 each). For b, c and g, scale bars, 100 µm. Source Data
Fig. 4
Fig. 4. YAP is involved in HCC growth promoted by high viscoelasticity.
a, Analyses of bulk RNA-seq data from mice fed a chow or FFD diet or a HiAD diet with vehicle treatment (n = 3 each), mice fed a HiAD with PM treatment (n = 2) and RAGEHepKO mice fed a HiAD (n = 3). The heat map shows enrichment in several YAP/TAZ target genes in the HiAD group compared with in the other groups. Tensin 1 (Tns1, red) target of interest. b, Schematic of the NASH-related HCC model combined with YAP inhibition. The diagram was created using BioRender. c, GS/MYC-tag immunohistochemistry on subsequent slides showing transformed foci (circles, top and middle). Active non-phosphorylated YAP (red) localized to the nuclei of GS positive cells (green) in control-vector-injected (for dn-TEAD2) mice fed a HiAD (bottom). Scale bars, 300 μm (top and middle) and 100 μm (bottom). NC, empty vector. d, Quantification of GS+MYC+ foci in c. n = 5. e, YAP targets Ctgf and Cyr61 were downregulated in dn-TEAD2-treated mice. n = 5. Data are mean ± s.e.m. n values refer to individual mice. Statistical analysis was performed using one-way ANOVA followed by Tukey’s multiple-comparison test. Source Data
Fig. 5
Fig. 5. The integrin-β1–TNS1–YAP axis mediates viscoelasticity-specific mechanocellular pathways for HCC cell invasion.
a, Schematics of the tuneable viscoelasticity IPNs of alginate (blue) and reconstituted basement membrane matrix (green) 3D hydrogels. Lowering the molecular mass of alginate cross-linked by calcium (red) decreases the network connectivity (arrows) to increase viscoelasticity. The diagram was adapted from ref. , under a Creative Commons licence CC BY 4.0. bg, Cell proliferation in low- or high-viscoelasticity hydrogels was analysed using EdU assays (imaging (b) and quantification (e)). c,f, YAP activation was analysed using antibodies against active YAP (imaging (c) and quantification (f); the arrowheads denote enlarged areas). d, The formation of invadopodia-like structures after transfection (Clontech-N1, containing human TKS5-mNeonGreen), and immunofluorescence analysis of MT1-MMP (red) using Airyscan microscopy. g, Cell circularity analyses (ImageJ; n = 5 gels). Scale bars, 50 μm (b), 20 μm (c) and 10 μm (d). hj. Huh7 cells in low- or high-viscoelasticity hydrogels were incubated with control IgG or integrin β1 (ITGB1) blocking antibodies. Cell proliferation (h; EdU), YAP target CTGF mRNA (i) and cell circularity (j, n = 4) were analysed. k, TNS1 mRNA expression in cells in low- or high-viscoelasticity hydrogels. n = 3. l,m, PLAs depict direct binding between TNS1 and integrin β1 (ITGB1) in high-viscoelasticity hydrogels (l; scale bar, 10 μm). m, The PLA signal was analysed (30 cells in 5 gels per group, n = 5, each). np, Huh7-Cas9 cells were transfected with plasmids containing CRISPR guide RNA for TNS1 (sgTNS1), integrin β1 (sgITGB1) or control sgRNA (NC) and embedded in low- or high-viscoelasticity hydrogels. The proliferation (n), YAP activation (o) and cell circularity (p) were analysed. n = 5 each. q, Schematic of TNS1, which functions as a key component of the ECM mechanosensor complex by binding to integrin β1 in high-viscoelasticity ECM. The diagram was created using BioRender. Data are mean ± s.e.m. n values refer to independent experiments. Statistical analysis was performed using two-tailed unpaired t-tests (eg and k) and one-way ANOVA followed by Tukey’s multiple-comparison test (hj and np). Source Data
Extended Data Fig. 1
Extended Data Fig. 1. Mice on HiAD develop earlier and more numerous transformed foci following hydrodynamic injection, and exhibit AGEs-dependent higher viscoelasticity (related to the main Fig. 2).
a-c. Additional data of the early time point (4w. post-HDI) NASH/HCC model. Mice were fed for 7 weeks either chow, FFD or HiAD. Hydrodynamic injection (HDI) was performed using vectors expressing human MET gene (pT3-EF5a-hMet) and the sleeping beauty (SB) transposase combined with a vector expressing either wild-type human β-catenin (pT3-EF5a-β-catenin-myc, control group) or mutant pT3-EF5a-S45Y-β-catenin-myc, mutant group). Four weeks after HDI, mice were sacrificed. a. Livers from chow, FFD and HiAD-fed mice after HDI. Arrowheads, small lesions. Scale bar, 1 cm. b. Quantification of visible liver lesions 4 weeks after HDI (n = 5). c. Hematoxylin and eosin (H&E) on sequential slides corresponding to the main Fig. 2b. Scale bar, 300 μm. d-f. Additional data on the model 7 weeks post-HD injection. Representative images (d) and quantification (e) of visible liver lesions (n = 8, 8, 7, 7, 7 respectively). Arrowheads, lesions. Scale bar, 1 cm. f. H&E images, corresponding to the GS/myc images in the main Fig. 2e. Scale bar, 300 μm. Error bars represent mean ± s.e.m. n numbers refer to individual mice. One-way ANOVA was used followed by Tukey’s multiple comparison test. Source Data
Extended Data Fig. 2
Extended Data Fig. 2. AGER1 induction or RAGE deletion in hepatocytes reverses fast stress relaxation, and the appearance of transformed foci.
a-b. Additional data of NASH-related HCC model combined with AAV8-mediated AGER1 induction. Representative stress relaxation curves (a) with or without AGER1 induction. H&E images (b), corresponding to the GS/myc-tag images in the main Fig. 2o. Scale bar, 300 μm. c-j. Additional data of the NASH-related HCC model in the hepatocyte-specific RAGE deleted (RAGEHepKO) mice. Schematics of the HDI using hMet/SB transposase with wild-type (control) or mutant β-catenin in RAGEHepKO or fl/fl mice (c). d. H&E and GS/myc immunohistochemistry were performed on sequential slides, circles represent foci, arrows indicate transduced cells. Scale bar, 300 μm. e. Quantification of foci (n = 5 each, 20 areas/per mouse). f. Liver AGEs were lower in RAGEHepKO in mice (n = 5 each). Rheometry studies, g-j. Liver stiffness (g) and viscoelasticity (h-j) were assessed (τ1/2 represents timescales at which the stress is relaxed to half its original value; increase in τ1/2 denotes lower viscoelasticity, j). There was no significant difference in stiffness, but improved viscoelasticity in RAGEHepKO mice (n = 5 each). Error bars represent mean ± s.e.m. n  refers to individual mice. One-way ANOVA was used followed by Tukey’s multiple comparison test. Source Data
Extended Data Fig. 3
Extended Data Fig. 3. Collagen networks in patients, mouse models and 3D hydrogels.
a. Collagen fibres in human liver samples (healthy, NASH, NASH+ T2DM) were analysed by second harmonic generation (SHG) microscopy. Areas with bundling is depicted in the NASH + T2DM group (white arrow). Red arrow points to lipid droplets. Maximum intensity projection Z-stack for section thickness of 30 μm (Representative images from three individual subjects. Scale bar, 200 µm). b. In mouse livers images depict a more bundled appearance of collagen network (white arrow) in the HiAD+vehicle group whereas more organized fibres following PM, ALT treatment or after AGER1 reconstitution. Maximum intensity projection Z-stack for section thickness of 30 μm (Representative images from three individual mice. Scale bar, 200 µm). c. Local patches with higher Young’s moduli could be observed in collagen hydrogels (red arrows). d. The ranges of elastic moduli is depicted in collagen or collagen+AGEs hydrogels. e. Mapping and distribution of hysteresis areas (viscoelasticity). f. Higher frequencies of increased viscoelasticity in collagen+AGEs gels. n = 5 gels/each group, 3 representative areas/each gel. For all maps, x’s indicate regions where AFM indentation curves could not be reliably analysed. Scale bar, 20 µm. g-j. To analyse the potential effect of ALT on the matrix, collagen gels +/− ALT-711 were studied by SHG (g, Scale bar, 100 µm). Gels from g were loaded for rheometry to assess stiffness (h, storage modulus) and viscoelasticity (i, loss tangent; j, τ1/2), (n = 4 each). Error bars represent mean ± s.e.m. n numbers refer to independent experiments. Two-tailed, unpaired t-tests for statistical analysis. ns, not significant. Source Data
Extended Data Fig. 4
Extended Data Fig. 4. Agent-based computational model for a fibrillar matrix.
a-c. Fibrils (grey, “f”), cross-linkers (yellow, “xl”), and bundlers (red, “bu”) are simplified by cylindrical segments in the model. Cross-linkers connect pairs of fibrils without preference of a cross-linking angle by binding-to-binding sites in any part of two fibrils. By contrast, bundlers connect pairs of fibrils with a specific angle and then maintain the angle. The first binding site of bundlers is always located at the end of fibrils, and the second binding site is located at specified part of fibrils. The specific part available for binding is defined by two boundaries, b1 and b2, between 0 and 1. Various bending (κb) and extensional (κs) stiffnesses maintain angles and lengths near their equilibrium values, respectively. Stiffnesses, equilibrium lengths, and equilibrium angles are listed in the Supplementary Table 5. d-g. Different types of matrices. Without bundlers, a matrix is comprised of individual fibrils cross-linked to each other, resulting in small mesh size (d). With bundlers which bind only to the ends of fibrils, a matrix consists of short bundles. Depending on the angle between fibrils connected by bundlers, the shape of short bundles varies (e, f). With bundlers that bind to the end of one fibril and the mid of another fibril, a matrix consists of longer bundles (g). Cross-linkers can connect fibrils within each bundle or fibrils that belong to different bundles. h-j: Snapshots of matrices employed for rheological measurements. The length of fibrils used for creating matrices is either 3 μm (top row) or 5 μm (bottom row). (Images displayed are representatives of 4 independent simulations). h. Matrix structures with a homogeneous, fine mesh, which is created without bundlers as shown in d. i. Matrix structures consisting of long, tight bundles with different lengths. Fibrils are connected in parallel by bundlers as shown in g. The length of bundles can be changed by varying b1 and b2. If the second binding site can bind only to part near one end of fibrils (e.g., b1 = 0.8, b2 = 1), the average length of bundles (LB) becomes large. By contrast, if the binding can take place only near the other end of fibrils (e.g., b1 = 0, b2 = 0.1), LB is slightly longer than the length of individual fibrils. j. Matrix structures consisting of short, loose bundles with different bundling angles, θ. In these cases, both binding sites of bundlers bind to the end of fibrils (i.e., b1 = b2 = 0) as shown in e and f. The shape of the bundle is varied by changing θ.
Extended Data Fig. 5
Extended Data Fig. 5. Stress relaxation in matrices with different bundle lengths, LB. and angles, θ.
a, b. Bundle length distribution with three different values of b1 and b2 for fibril length of 3 μm (a). Stress relaxation without normalization for cases shown in Fig. 3s and a case without bundles (b). c-e. Bundle length distribution with different b1 and b2 (c) and stress relaxation without (d) or with normalization (e) for fibril length of 5 μm. Faster stress relaxation is observed in matrices consisting of smaller bundles. f, g. Stress relaxation without normalization for the cases shown in main Fig. 3r (f) and Fig. 3t (g). In f and g, the length of fibrils is 3 μm. h, i. Stress relaxation in cases with different angles θ for fibrils length of 5 μm. The bundle length was changed by a variation in the two boundaries defining the second binding sites for bundlers, b1 and b2. When these fibrils are connected in parallel (θ = 0°) by bundlers, they create long densely packed bundles. The length of these bundles (LB) is determined by the specific point of attachment between the bundler and the fibrils. In cases where bundlers exclusively attach to the fibril ends, the resulting matrix consists of short bundles. These loosely packed bundles have a length equal to that of the fibrils (3 μm). The shape of these short, loosely arranged bundles varies depending on the angle (θ) between the connected fibrils. Error bands represent mean ± s.d. Data displayed are representatives of 4 independent simulations. Source Data
Extended Data Fig. 6
Extended Data Fig. 6. YAP pathways are induced by matrix viscoelasticity.
a. Analyses of bulk RNA-seq data from mice fed chow, FFD, and HiAD diets. HiAD-fed mice were treated by PM or vehicle, and a group of mice with RAGE hepatocyte depletion (RAGEHepKO) were studied. Genes between FFD and HiAD groups with Log2 fold change (Log2FC) and p-value less than 0.05 (Fisher’s exact test) were considered differentially expressed. KEGG analyses from differentially expressed genes show enrichment in Hippo signalling pathway. No HD injection was done in these experiments. b, c. Representative images (b) and quantification (c) of active nuclear YAP signal in mouse livers, using an antibody against the active, non-phosphorylated YAP. (n = 5 mice/group, 4 random ×20 fields/sample; data are presented as the percentage of active YAP/area/×20 field). d. YAP targets CTGF and Cyr61 were induced in mice on HiAD, but not after PM or in RAGEHepKO on HiAD. RT-qPCR, n = 6 each. e. Collagen was imaged using SHG (green), active YAP (red) and α-SMA positive stellate cells (blue, arrows) by immunofluorescence. There were no hepatocytes with active YAP observed in the close proximity of collagen bundles (using an antibody against the non-phosphorylated active YAP). Scale bar 50 µm. f. HE images corresponding to sequential slides with myc-tag/GS immunohistochemistry in the main Fig. 4c. g. Nuclear and cytoplasmic YAP was assessed using antibodies against active, non-phosphorylated and inactive phosphorylated YAP in western blots (cytoplasmic and nuclear fractions), in low and high viscoelasticity hydrogels (representative of 3 different experiments). Error bars represent mean ± s.e.m. n numbers refer to individual mice. One-way ANOVA was used followed by Tukey’s multiple comparison test. Source Data
Extended Data Fig. 7
Extended Data Fig. 7. Proliferation and YAP activation are not affected by increasing stiffness in low or high viscoelasticity hydrogels (Additional data to the main Fig. 5).
a-e. Huh7 cells were encapsulated in low or high viscoelasticity IPN hydrogels with varying stiffness. (0.8-5 kPa). Cell proliferation and YAP activity were evaluated by Edu nuclear signal (a, scale bar, 100 μm) and active YAP immunofluorescence (b, scale bar, 50 μm), and quantification (c and d). e. mRNA expression of YAP target genes CTGF and Cyr6. (n = 4, for c-e, Error bars represent mean ± s.e.m. n numbers refer to independent experiments. One-way ANOVA with Tukey tests was used for correction of multiple comparisons. f-h. Huh7 cells were transfected with Tks5-mNeonGreen, and immunofluorescence microscopy was performed using an antibody against MT1-MMP (f), active integrin β1 (g), and p-MLC2 (h). i. Controls with no primary antibody for f-h. Cells were imaged by high resolution Airyscan microscopy (LSM980, Zeiss). Representative images, scale bar, 10 µm. j. Controls for the PLA assay in the main Fig. 5l (1° antibody only, 2° antibody only). Scale bar, 10 µm. Error bars represent mean ± s.e.m. n numbers refer to independent experiments. One-way ANOVA was used followed by Tukey’s multiple comparison test. Source Data
Extended Data Fig. 8
Extended Data Fig. 8. TNS1 and integrin β1 knockdowns reduce proliferation, active nuclear YAP and formation of invadopodia-like structures (Additional data to the main Fig. 5).
a-d, Huh7-Cas9 cells were transfected with plasmids containing CRISPR guide RNA of TNS1 (sg-TNS1), or integrin β1 (sg-Itg β1) or control sgRNA (NC), and cells after 24 h were embedded in low or high viscoelasticity hydrogels. After 48 h, cell proliferation was evaluated by Edu analyses (a, Scale bar, 50 μm). YAP activity was analysed by using an antibody against active YAP (b, Scale bar, 20 μm). Cell circularity was analysed by F-actin, and ImageJ analyses (c, Scale bar, 20 μm.), and the formation of invadopodia-like structures was assessed by the TKS5 signal (d, Scale bar, 10 μm). e. mRNA expression of YAP-regulated target genes, CTGF and Cyr61 (n = 5). Error bars represent mean ± s.e.m. n numbers refer to independent experiments. One-way ANOVA test was used followed by Tukey’s multiple comparison. Source Data
Extended Data Fig. 9
Extended Data Fig. 9. TNS1 and Integrin β1 knockdowns reduce proliferation, activation of YAP and formation invadopodia-like structures in Hep3B cells.
Hep3B cells were transfected with CRISPR/Cas9 plasmids to knockdown TNS1 (sg-TNS1) or β1 integrin (sg-Itgβ1). A control, not targeted sgRNA was used as control (NC). After 48 h in 3D culture in low or high viscoelasticity hydrogels, cell proliferation was evaluated by Edu (a, Scale bar, 50 μm) and quantification of the signal (e). YAP activity was analysed by using active YAP antibody (b, Scale bar, 20 μm), quantification (f), and mRNA expression of YAP-regulated targets (h). Cell circularity was evaluated by the F-actin signal (c, Scale bar, 20 μm) and ImageJ analyses (g). Formation of invadopodia-like structures was analysed by the TKS5 signal (d, Scale bar, 10 μm). n = 5 each for e-h. Error bars represent mean ± s.e.m. n numbers refer to independent experiments. One-way ANOVA test was used followed by Tukey’s multiple comparison. Source Data
Extended Data Fig. 10
Extended Data Fig. 10. PTB domain deleted (dd) TNS-1 did not colocalize with integrin, and cells exhibited lower proliferation, YAP activity, and reduced formation of invadopodia-like structures in high viscoelasticity hydrogels.
a. Schematics of the PTB domain deleted (dd) TNS1 construct. Deleting this domain prevents binding to integrins however the actin-binding domain remains intact. b, c. Proximity ligation assays (b) to assess integrin β1 and TNS1 binding (green signal) in empty vector (NC), full length TNS1, and dd-TNS1 transfected cells (red, tdTomato). In full length TNS1 tomato, PLA signals colocalized whereas no colocalization was seen in dd-TNS1 transfected cells or in low viscoelasticity matrix. PLA positive dots were quantified from 30 cells in 5 gels, each group (c, n = 5 each). d-k. Cell proliferation was evaluated by Edu (d, Scale bar, 100 μm) and quantification (h). YAP activity was analysed by using active YAP immunofluorescence (e, Scale bar, 50 μm.), quantification (i), and YAP-regulated target gene mRNA expression (k). Cell circularity was evaluated by F-actin signal (f, Scale bar, 50 μm, and) and quantification (j, ImageJ). Formation of invadopodia-like structures was analysed by the TKS5 signal (g, Scale bar, 10 μm, n = 5 each. Error bars represent mean ± s.e.m. n numbers refer to independent experiments. One-way ANOVA test was used followed by Tukey’s multiple comparison. Source Data
Extended Data Fig. 11
Extended Data Fig. 11. Integrin β1 and Tensin 1 mediate viscoelasticity-specific mechano-cellular pathways involving YAP activation (Additional data to main Fig. 5).
a. Huh7-Cas9 cells were transfected with plasmids containing CRISPR guide RNA for TNS1 (sg-TNS1), or Integrin β1 (sg-Itg β1) or control sgRNA (NC), and cells after 24 h were embedded in low or high viscoelasticity hydrogels. RhoA GTPase activity in low/high viscoelasticity conditions and after TNS-1 or Integrin β1 KDs was tested by pull-down assays. Antibodies to active (non-phosphorylated), inactive YAP (phosphorylated), as well as to phosphorylated and total LATS1, were used, and analysed by immunoblotting. Representative images of 3 independent experiments. b. Quantification of GTP-RhoA/GAPDH protein levels from a (n = 3 each). c-e. Huh7 cells encapsulated in low or high viscoelasticity IPN hydrogels were incubated with ROCK (Y-27632, Abcam, 10 μM) or Myosin II inhibitors (Blebbistatin, Abcam, 50 μM). YAP activity was analysed by testing YAP-regulated target gene CTGF mRNA expression (c). Cell circularity was analysed by Image J (d), and cell proliferation was evaluated by Ki67 mRNA expression (e) (n = 3 each). Error bars represent mean ± s.e.m. n numbers refer to independent experiments. One-way ANOVA test was used followed by Tukey’s multiple comparison. Source Data
Extended Data Fig. 12
Extended Data Fig. 12. TNS-1 knockdown decreases the formation of transformed foci in mice on HiAD, after HDI.
a. Schematic presentation of the in vivo targeting of TNS1 by CRISPR/Cas9 in conjunction with hydrodynamic injection (HDI). Mice were fed chow or HiAD for 7w, then hydrodynamically injected with pT3-EF5a-hMet and the pT3-354 EF5a-S45Y-β-catenin-myc (mutant β-catenin), with the sleeping beauty (SB) transposase, as well as the CRISPR-Cas9-based vector either with sgRNAs targeting mouse TNS1 (pX333-sgTNS1) or empty vector (sgNC). Mice were sacrificed 7 weeks following injection. b. TNS1 expression in the liver was analysed by RT-qPCR (n = 6 each). c, d. H&E images, GS/myc immunohistochemistry on consecutive slides depict colocalization (c). Quantification (d) of GS/myc positive foci. Scale bar, 300 μm (n = 6 each). e. The expression of YAP targets CTGF and Cyr 61 was analysed by RT-qPCR (n = 6 each). Error bars represent mean ± s.e.m. n numbers refer to individual mice. One-way ANOVA test was used followed by Tukey’s multiple comparison. Source Data

References

    1. Cox TR. The matrix in cancer. Nat. Rev. Cancer. 2021;21:217–238. doi: 10.1038/s41568-020-00329-7. - DOI - PubMed
    1. Piersma B, Hayward MK, Weaver VM. Fibrosis and cancer: a strained relationship. Biochim. Biophys. Acta Rev. Cancer. 2020;1873:188356. doi: 10.1016/j.bbcan.2020.188356. - DOI - PMC - PubMed
    1. Schrader J, et al. Matrix stiffness modulates proliferation, chemotherapeutic response, and dormancy in hepatocellular carcinoma cells. Hepatology. 2011;53:1192–1205. doi: 10.1002/hep.24108. - DOI - PMC - PubMed
    1. McGlynn KA, Petrick JL, El-Serag HB. Epidemiology of hepatocellular carcinoma. Hepatology. 2021;73:4–13. doi: 10.1002/hep.31288. - DOI - PMC - PubMed
    1. Negro F. Natural history of NASH and HCC. Liver Int. 2020;40:72–76. doi: 10.1111/liv.14362. - DOI - PubMed

MeSH terms