. 2024 Feb;626(7998):411-418.
doi: 10.1038/s41586-023-06983-9. Epub 2024 Jan 31.

7-Dehydrocholesterol dictates ferroptosis sensitivity

Affiliations

7-Dehydrocholesterol dictates ferroptosis sensitivity

Yaxu Li et al. Nature. 2024 Feb.

Abstract

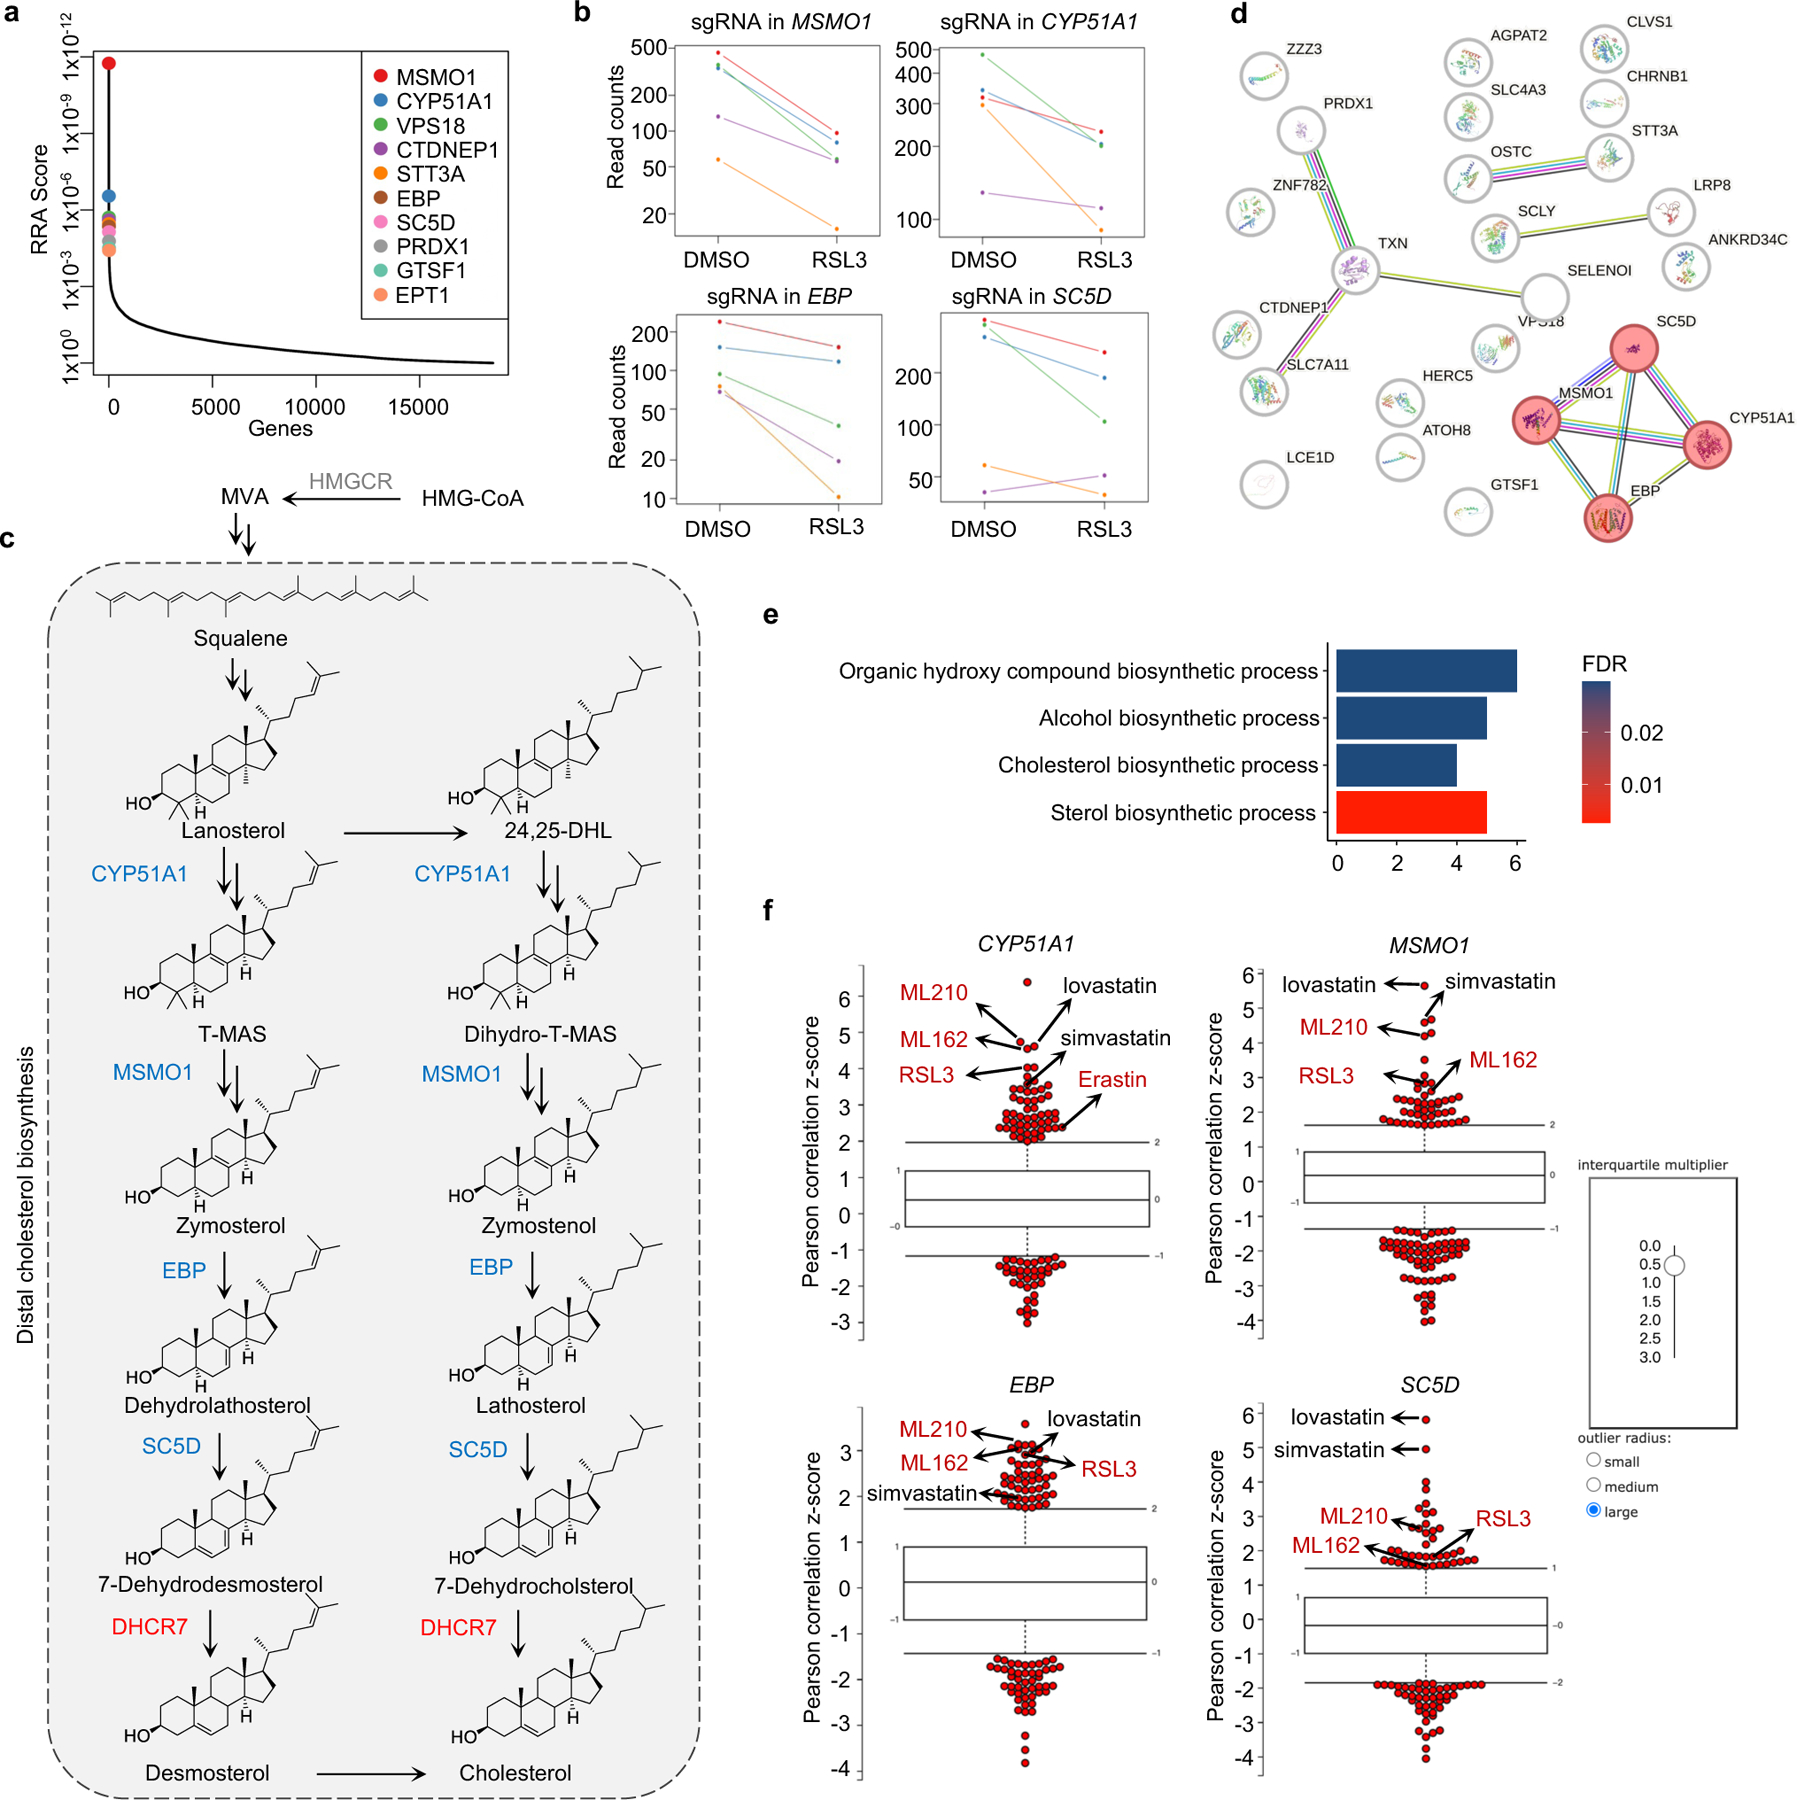
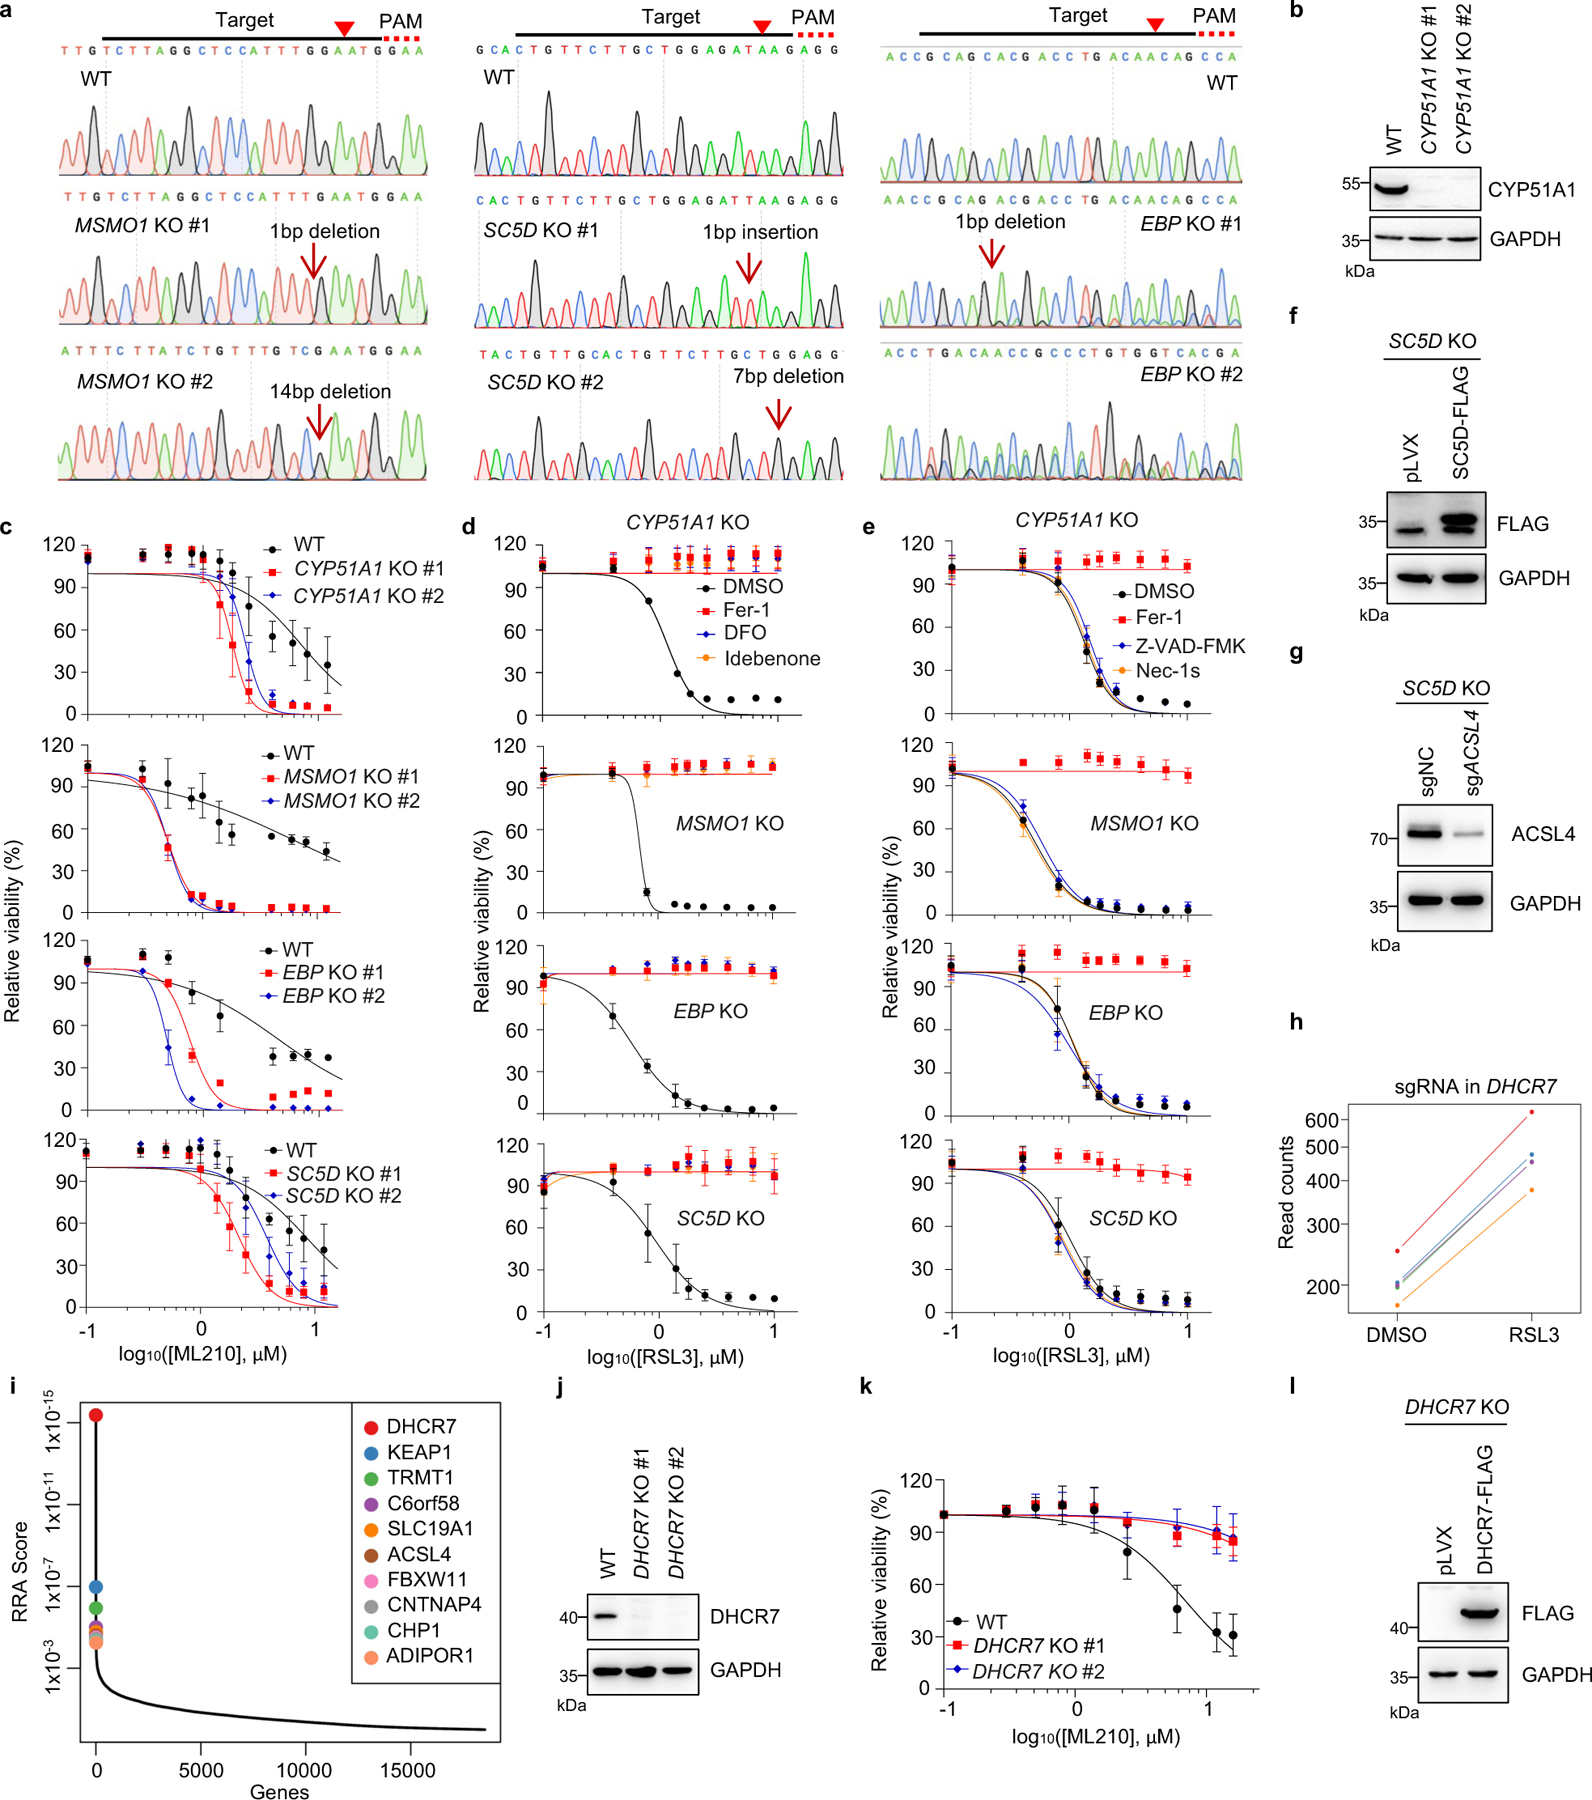
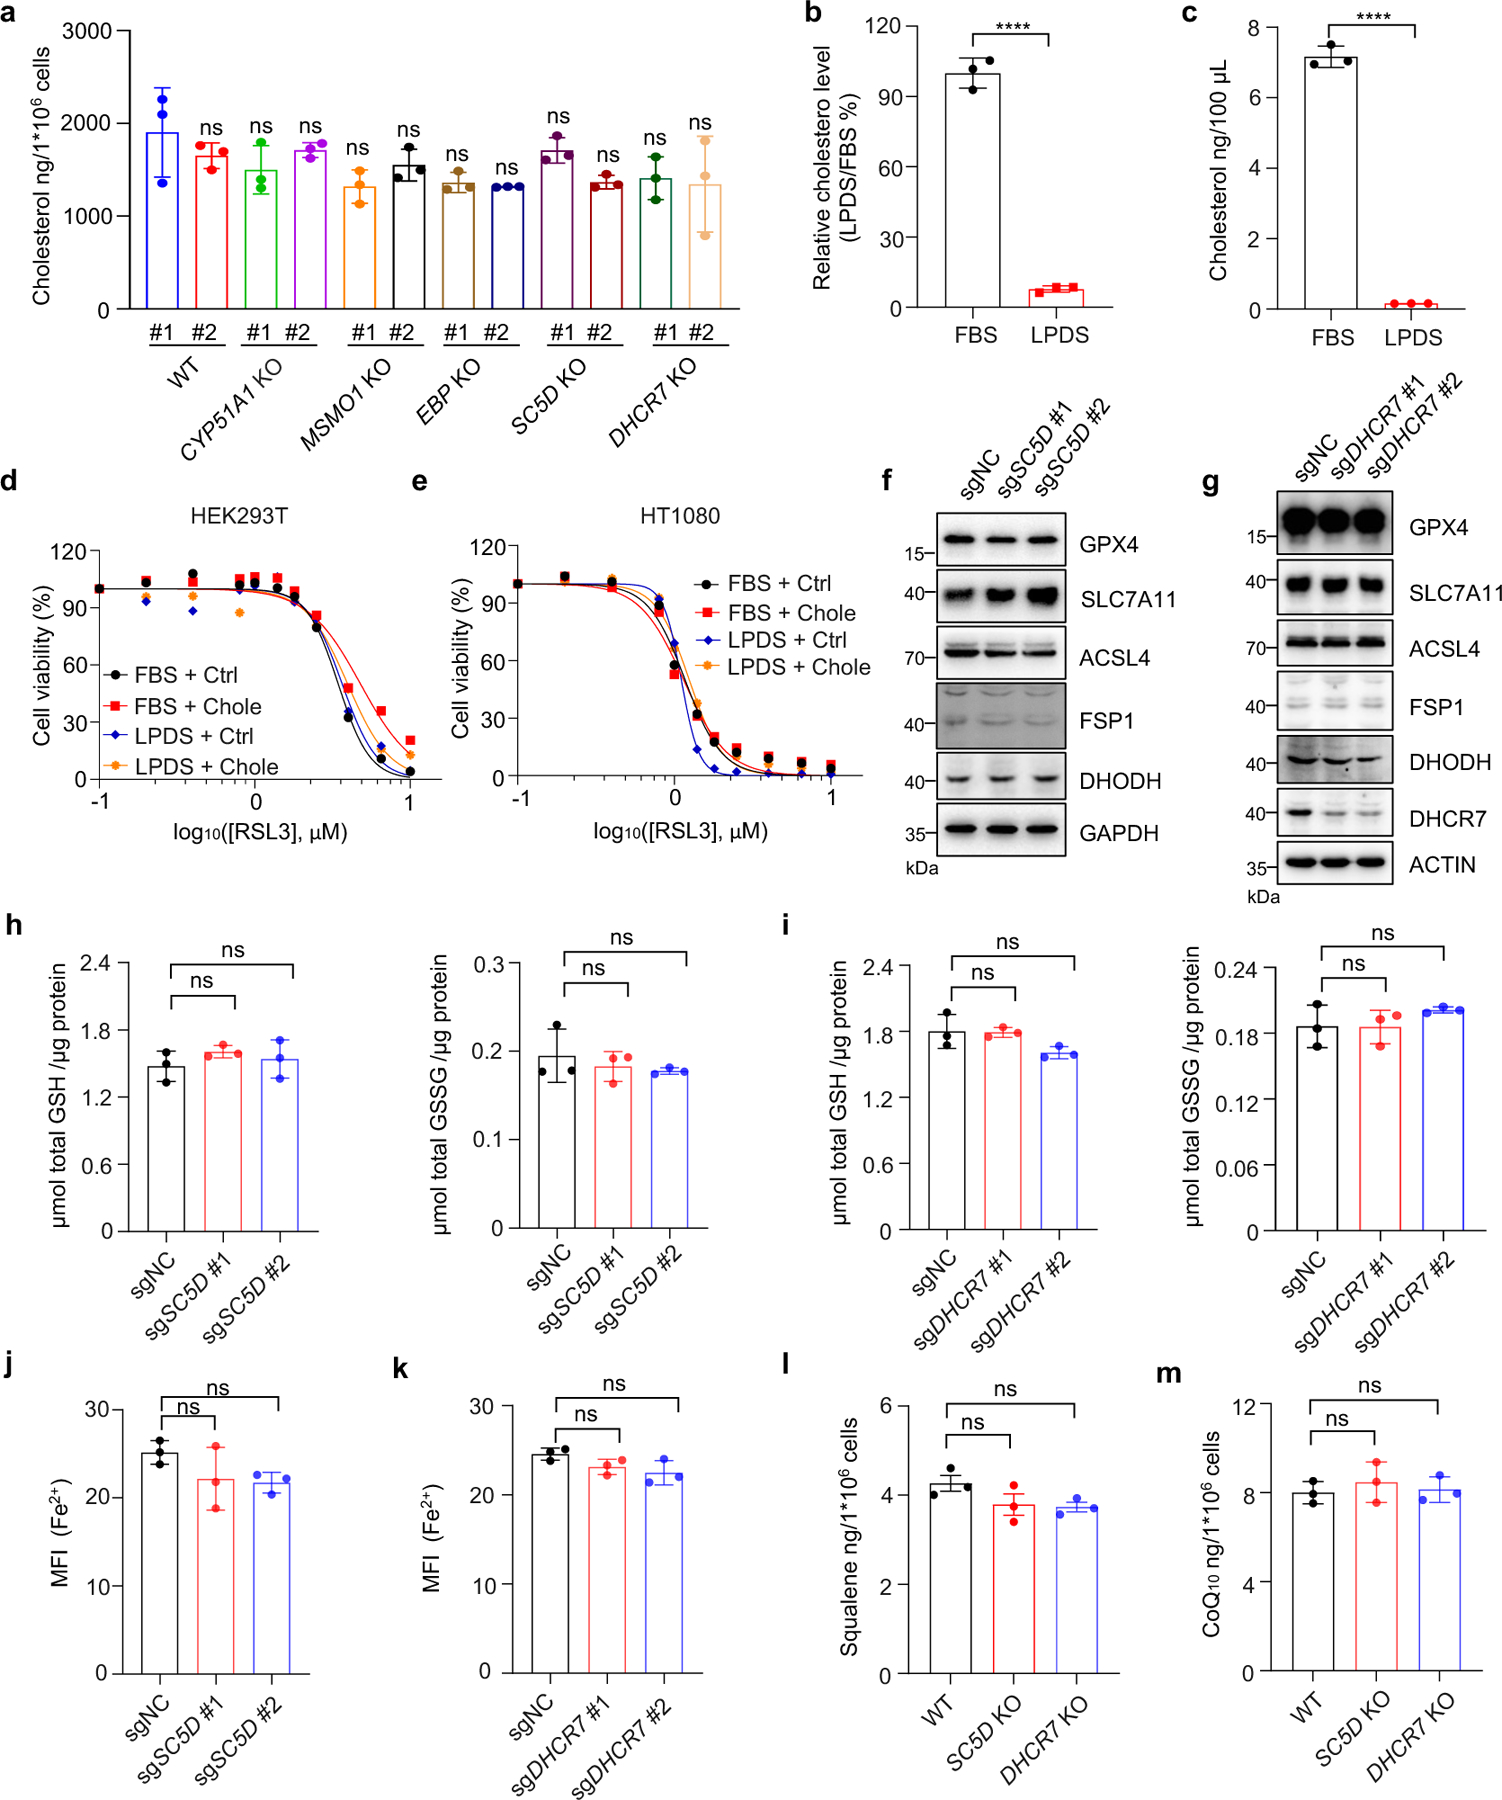
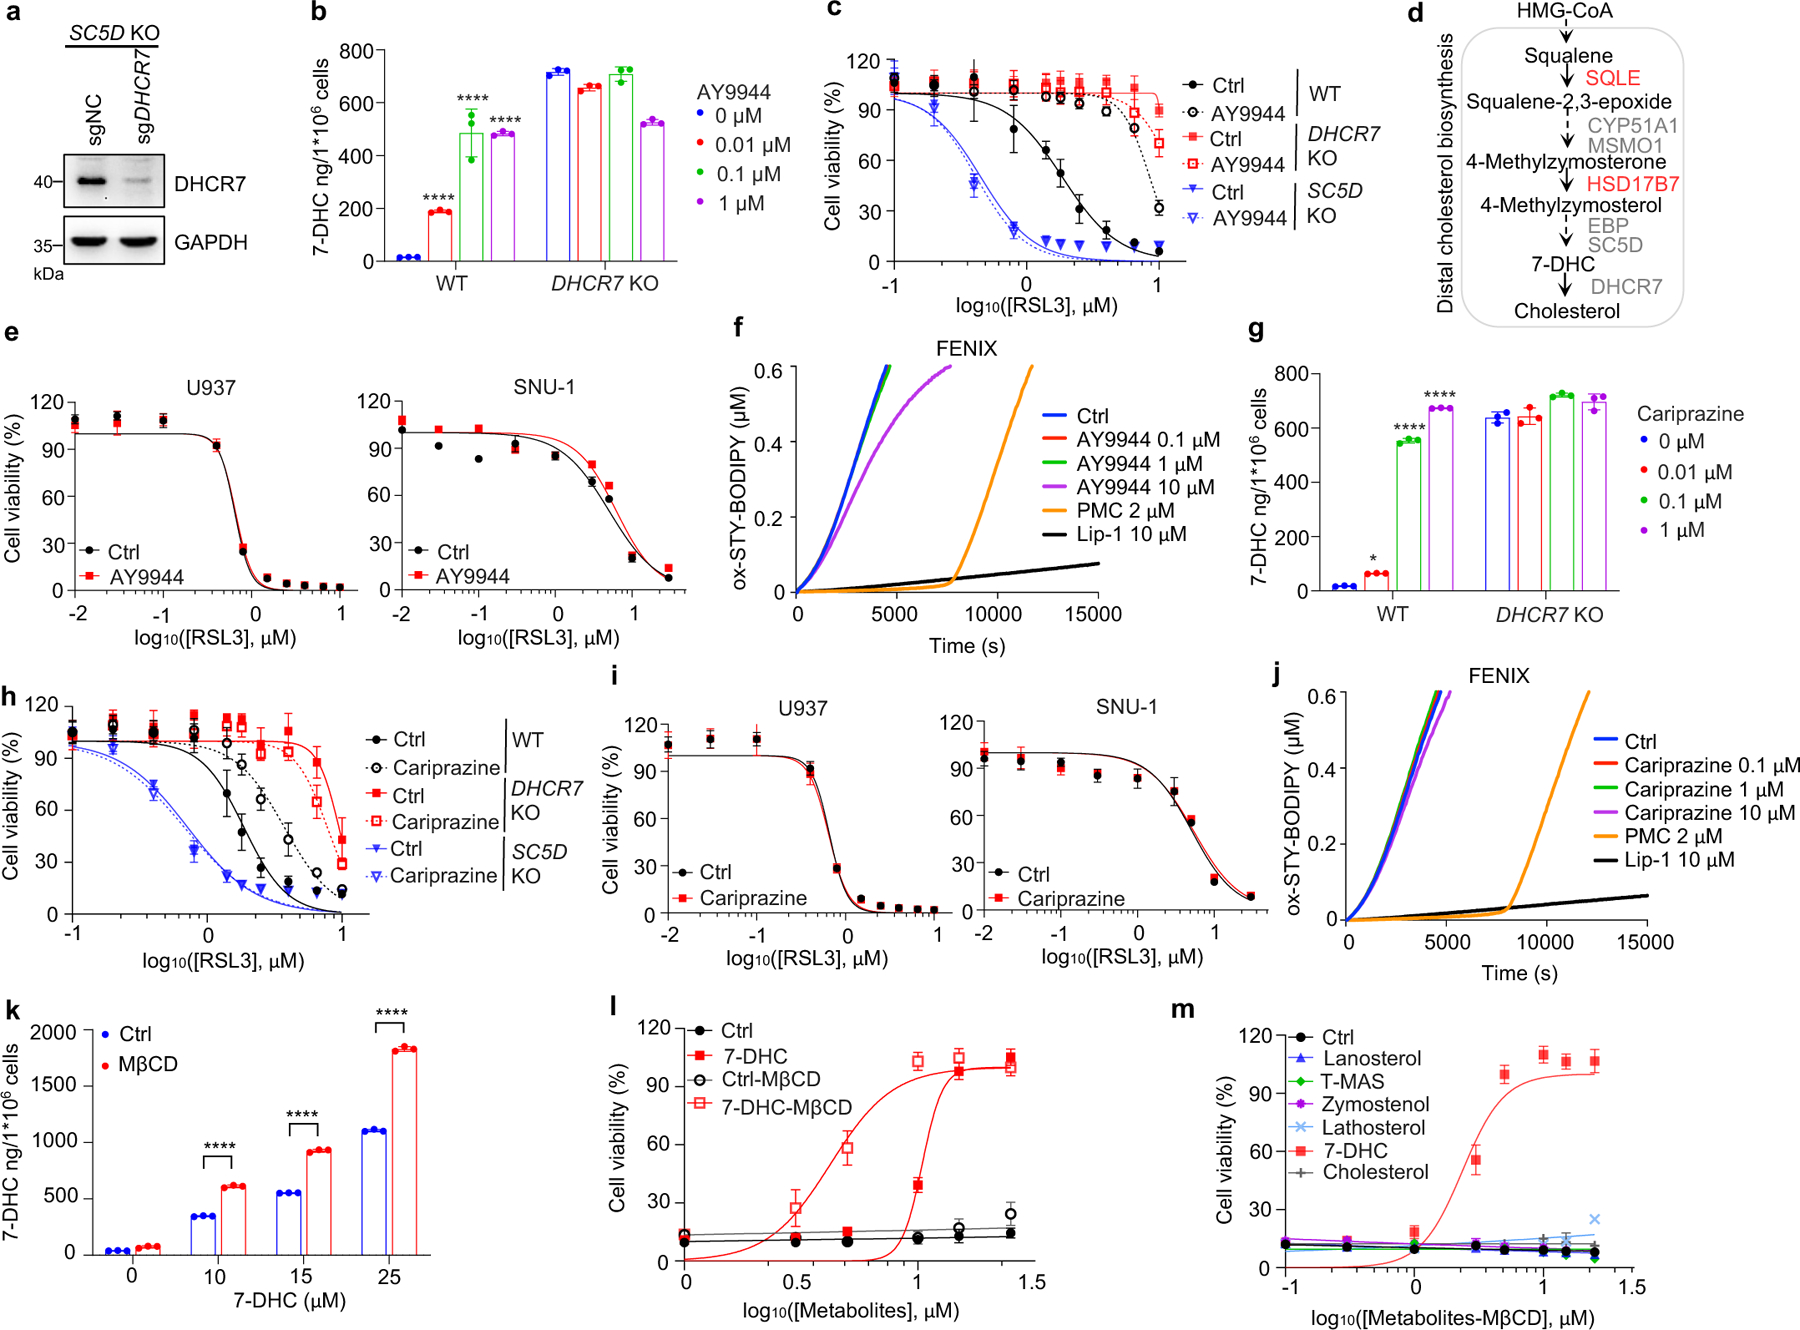
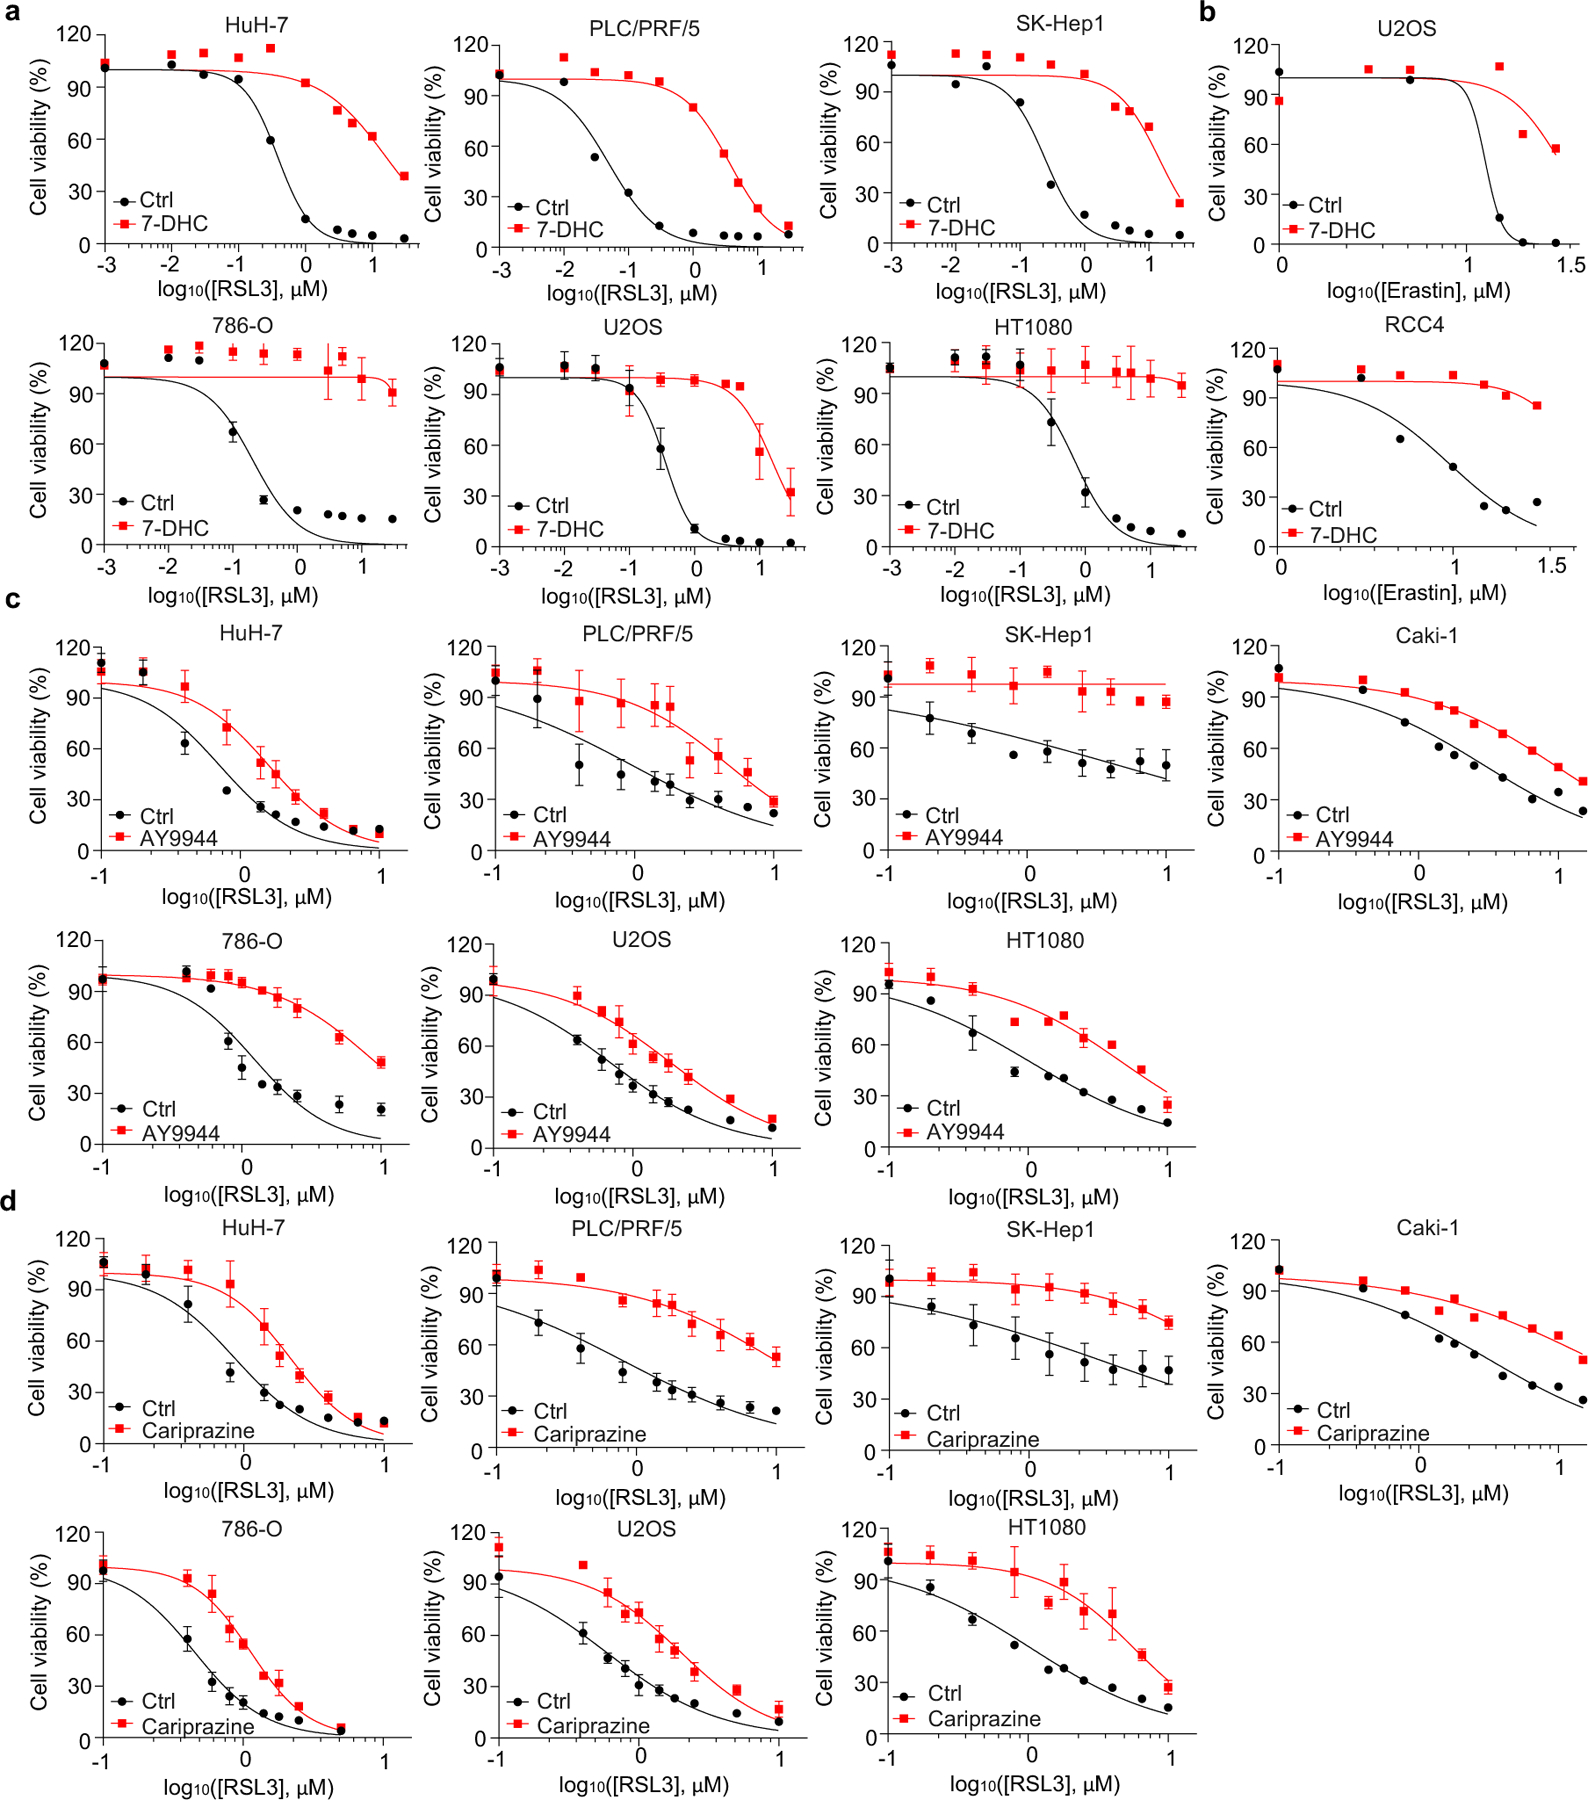
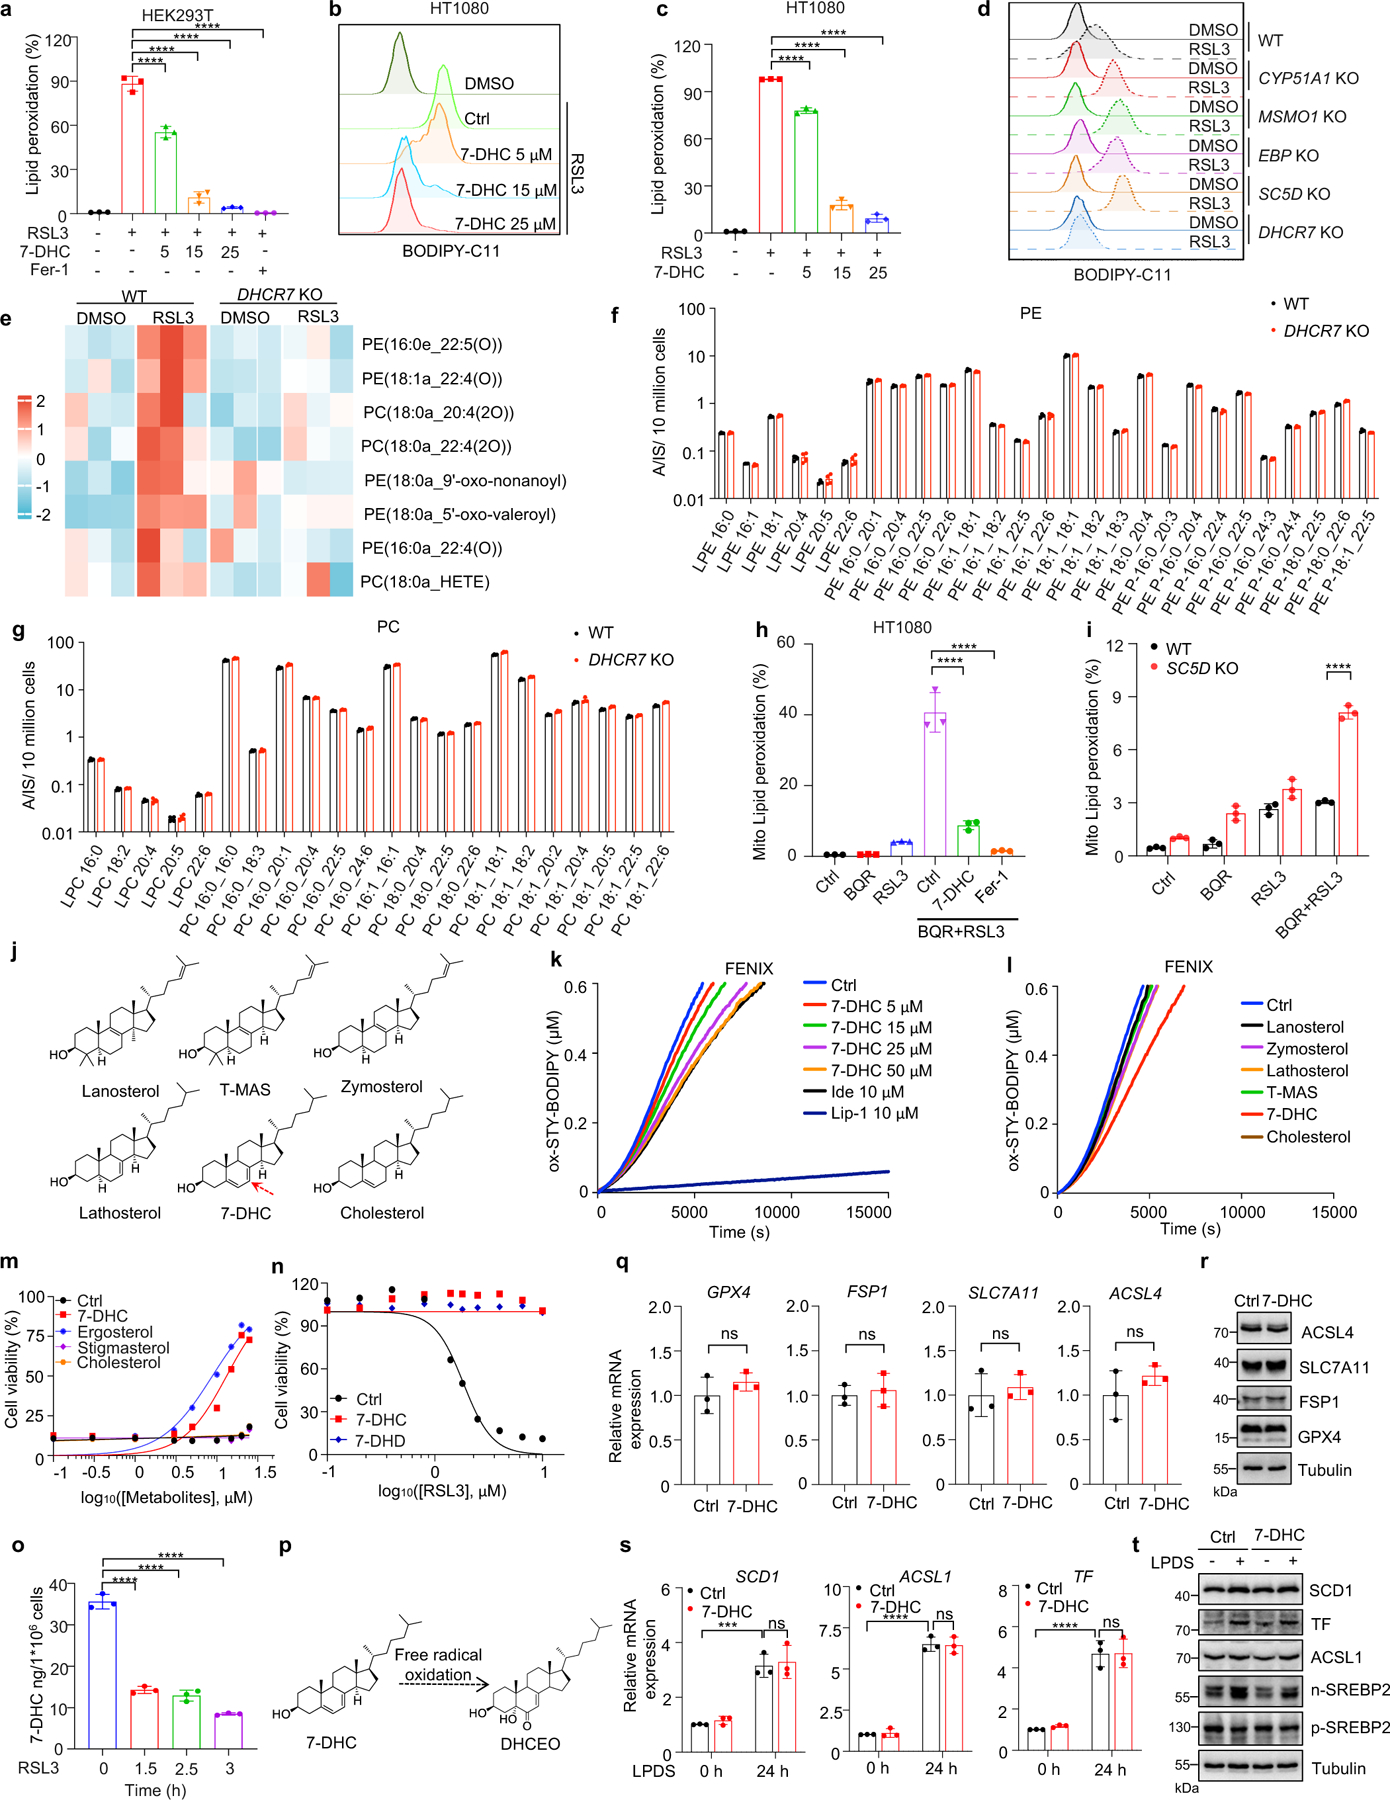
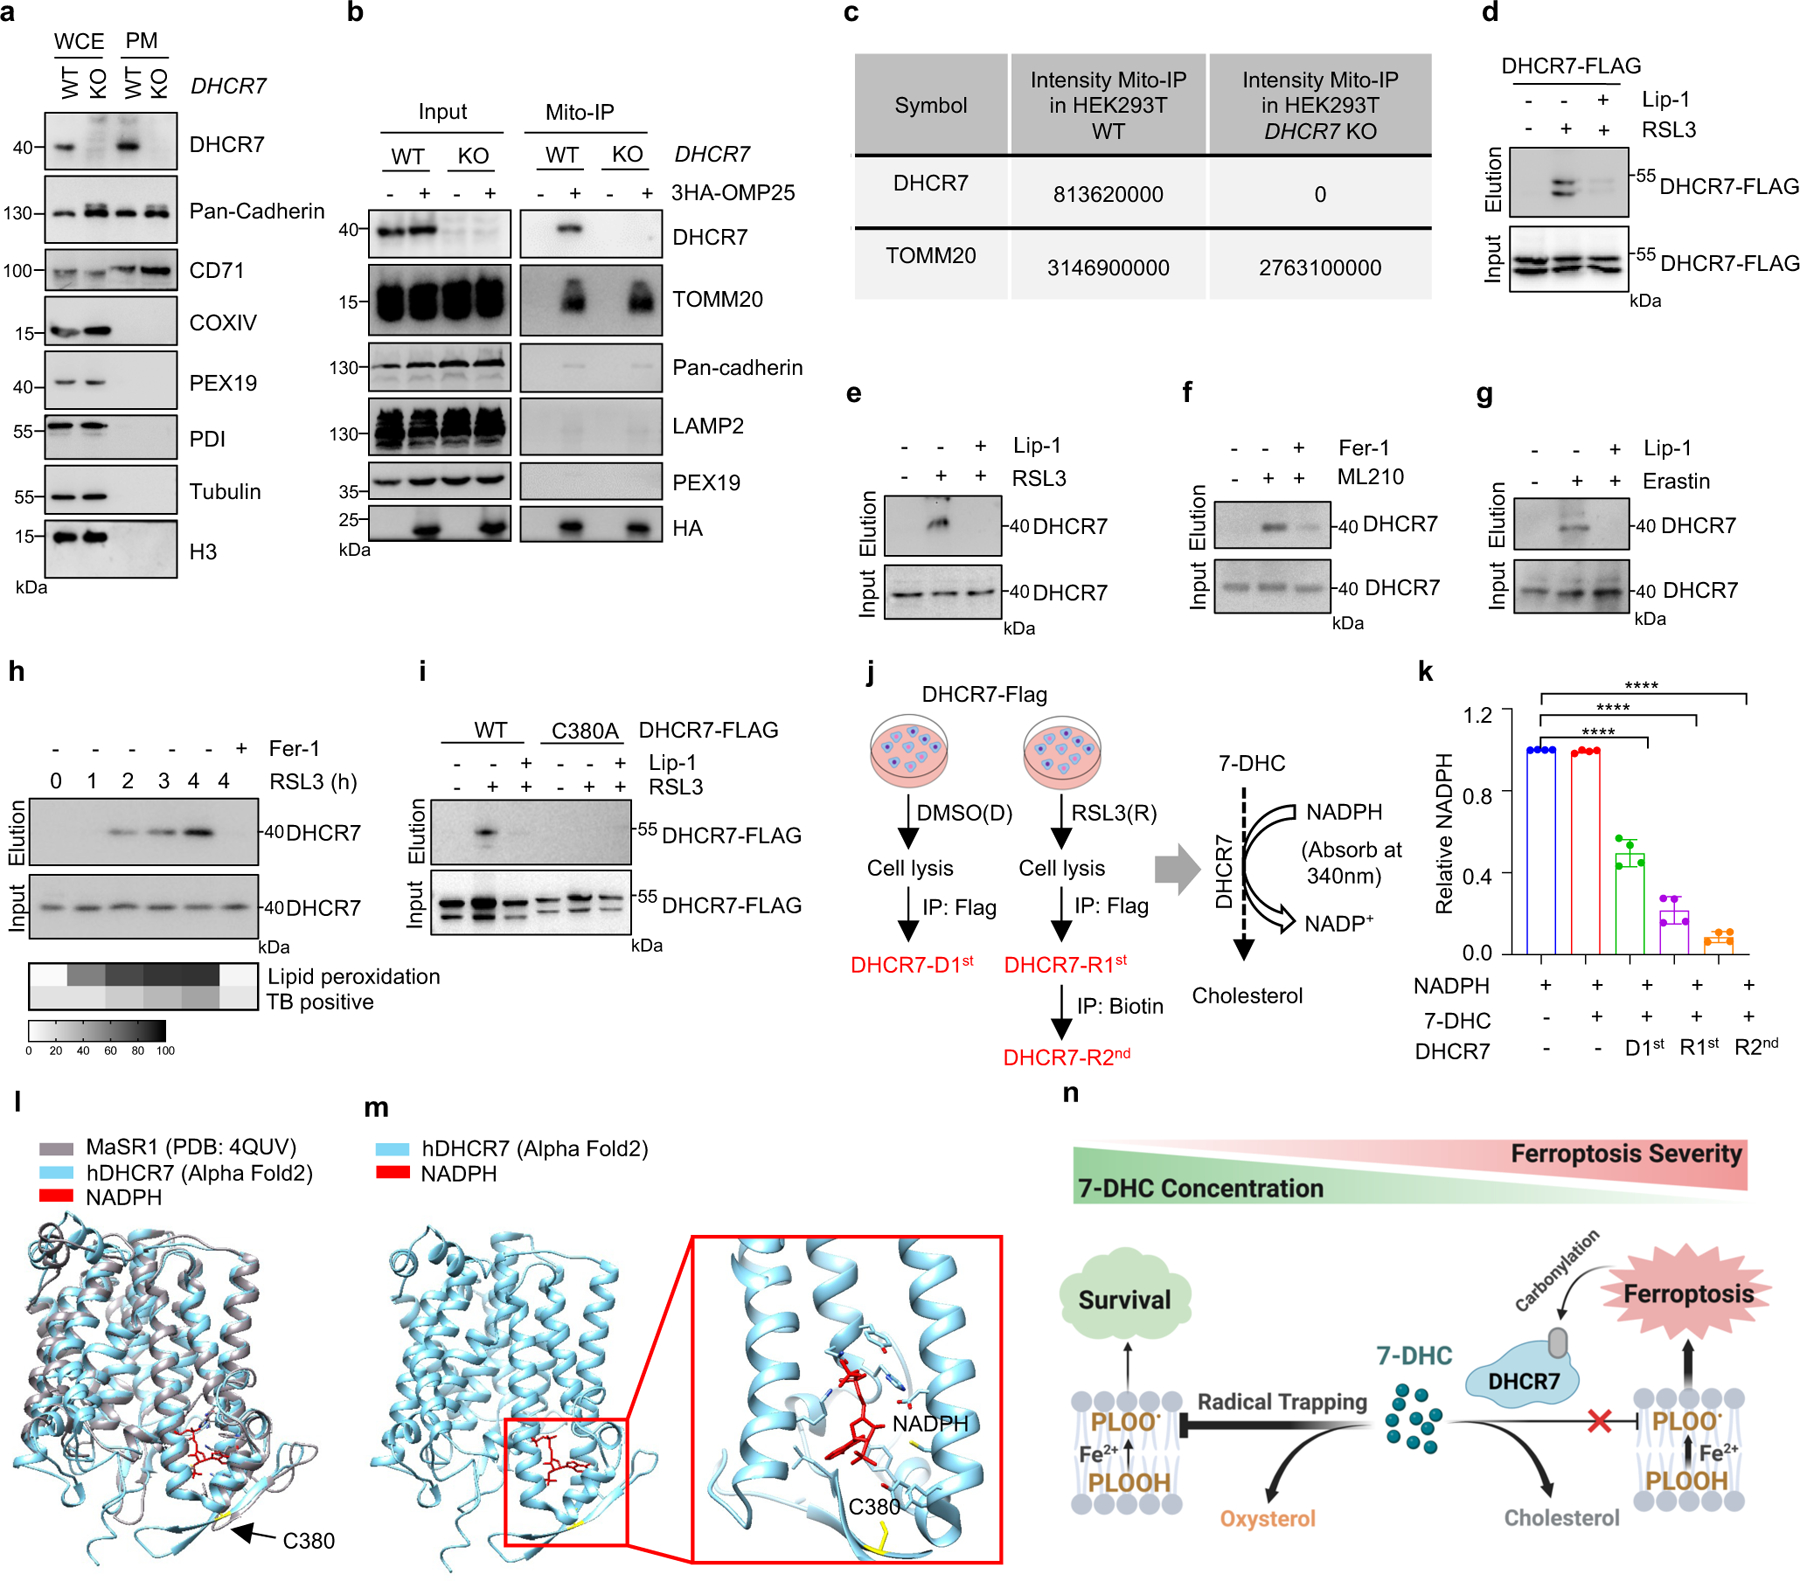
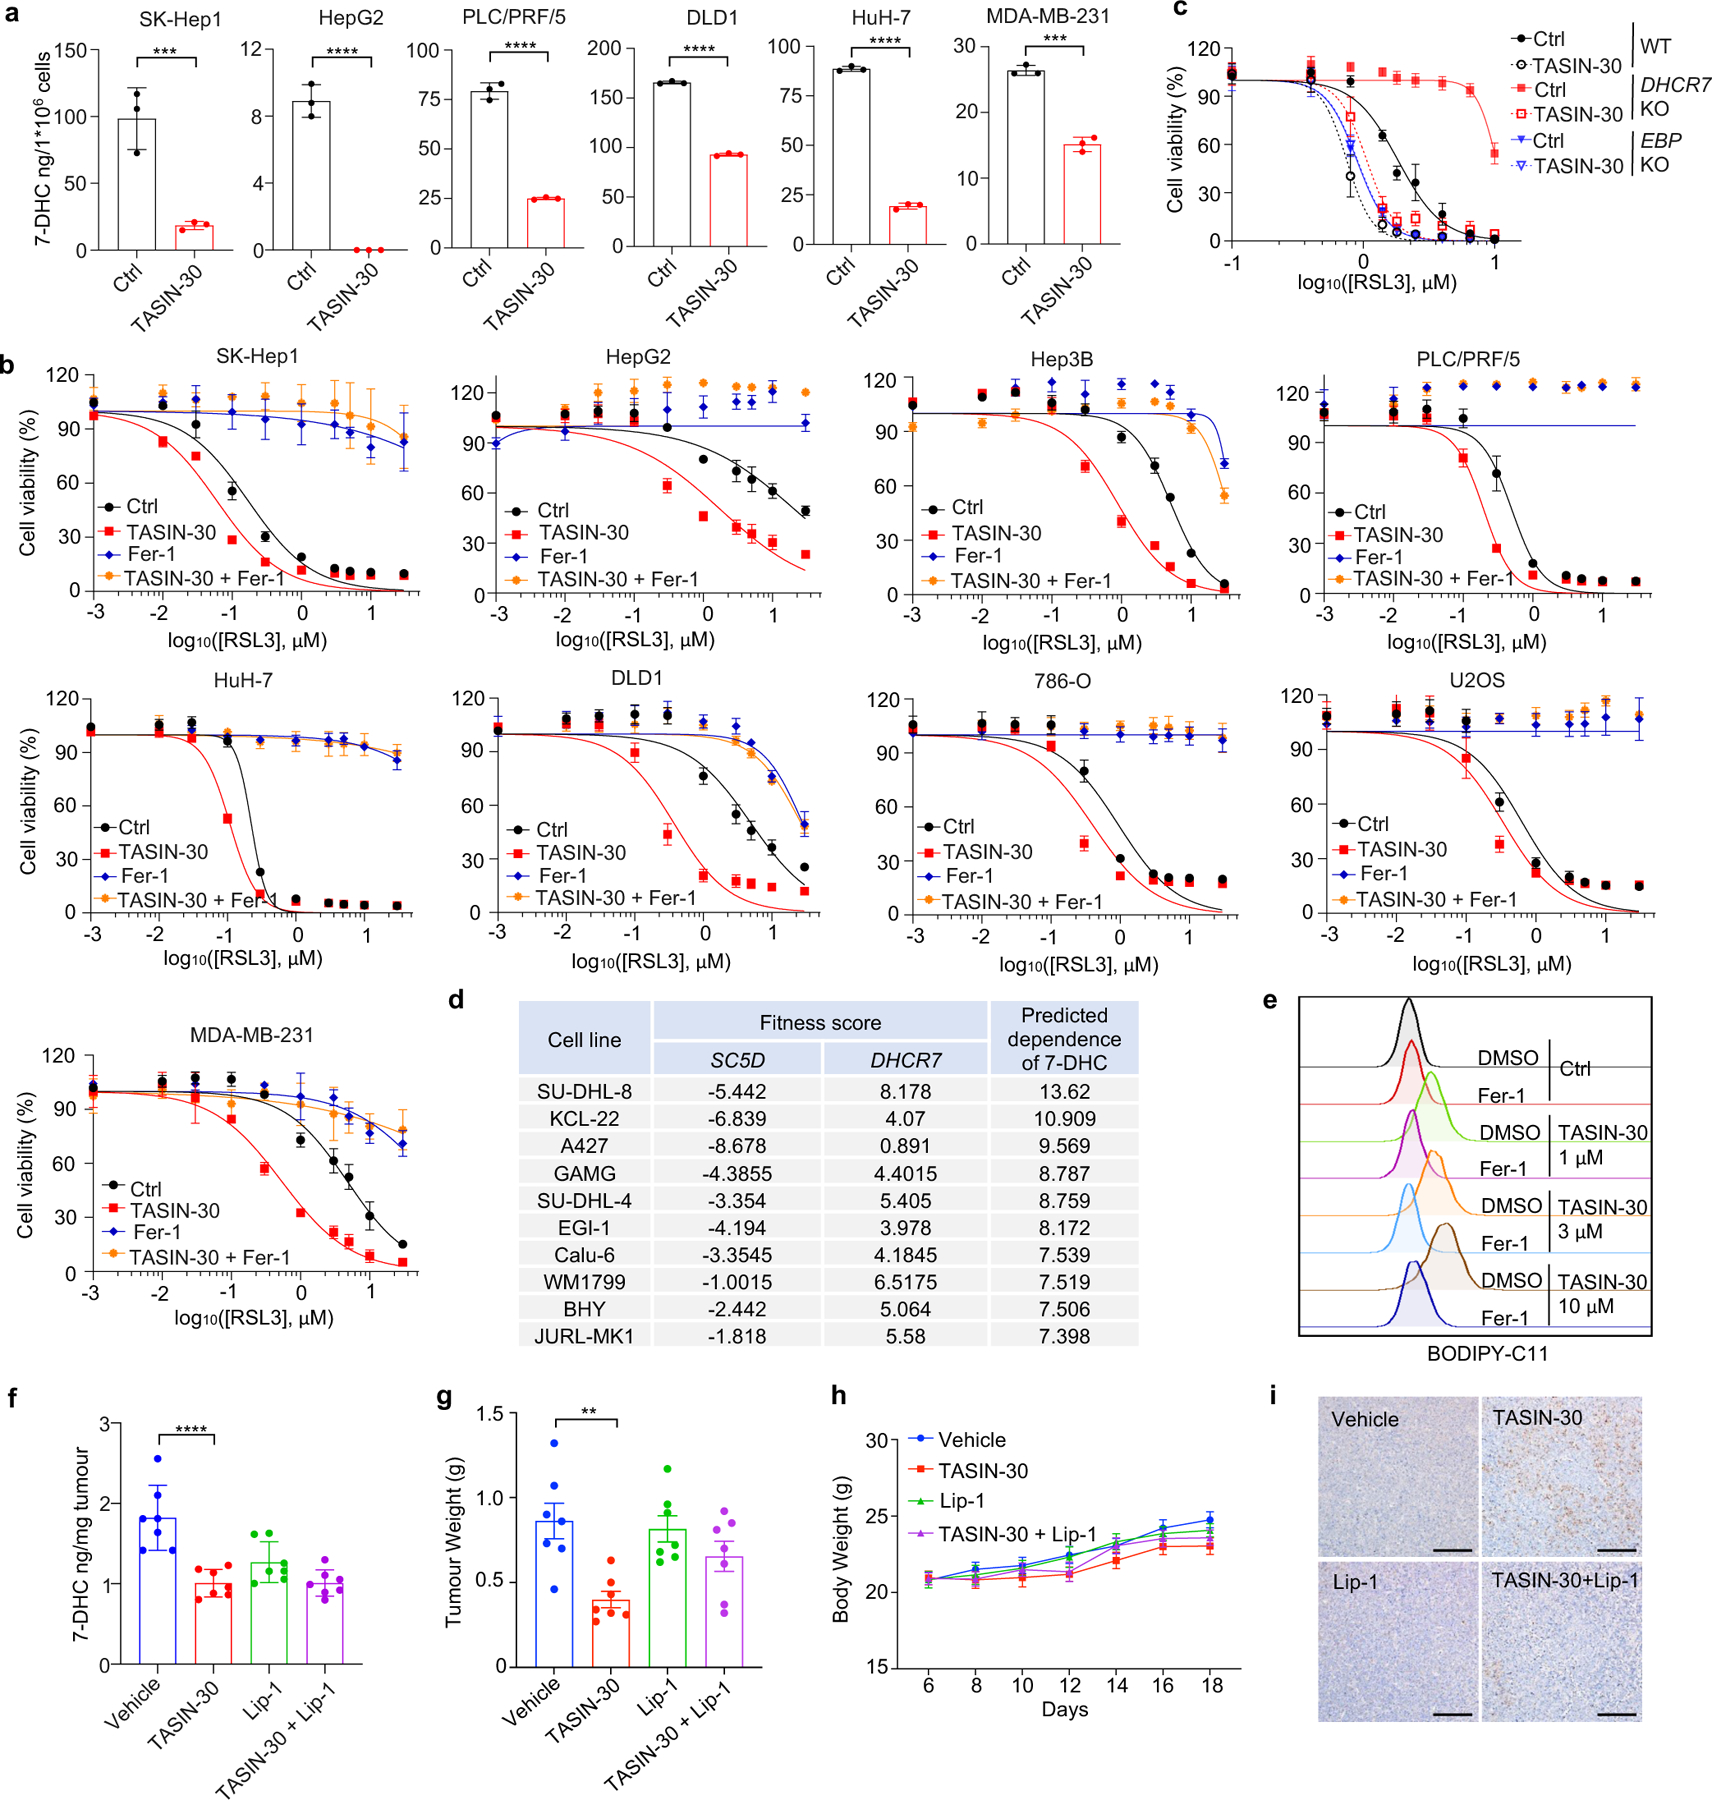
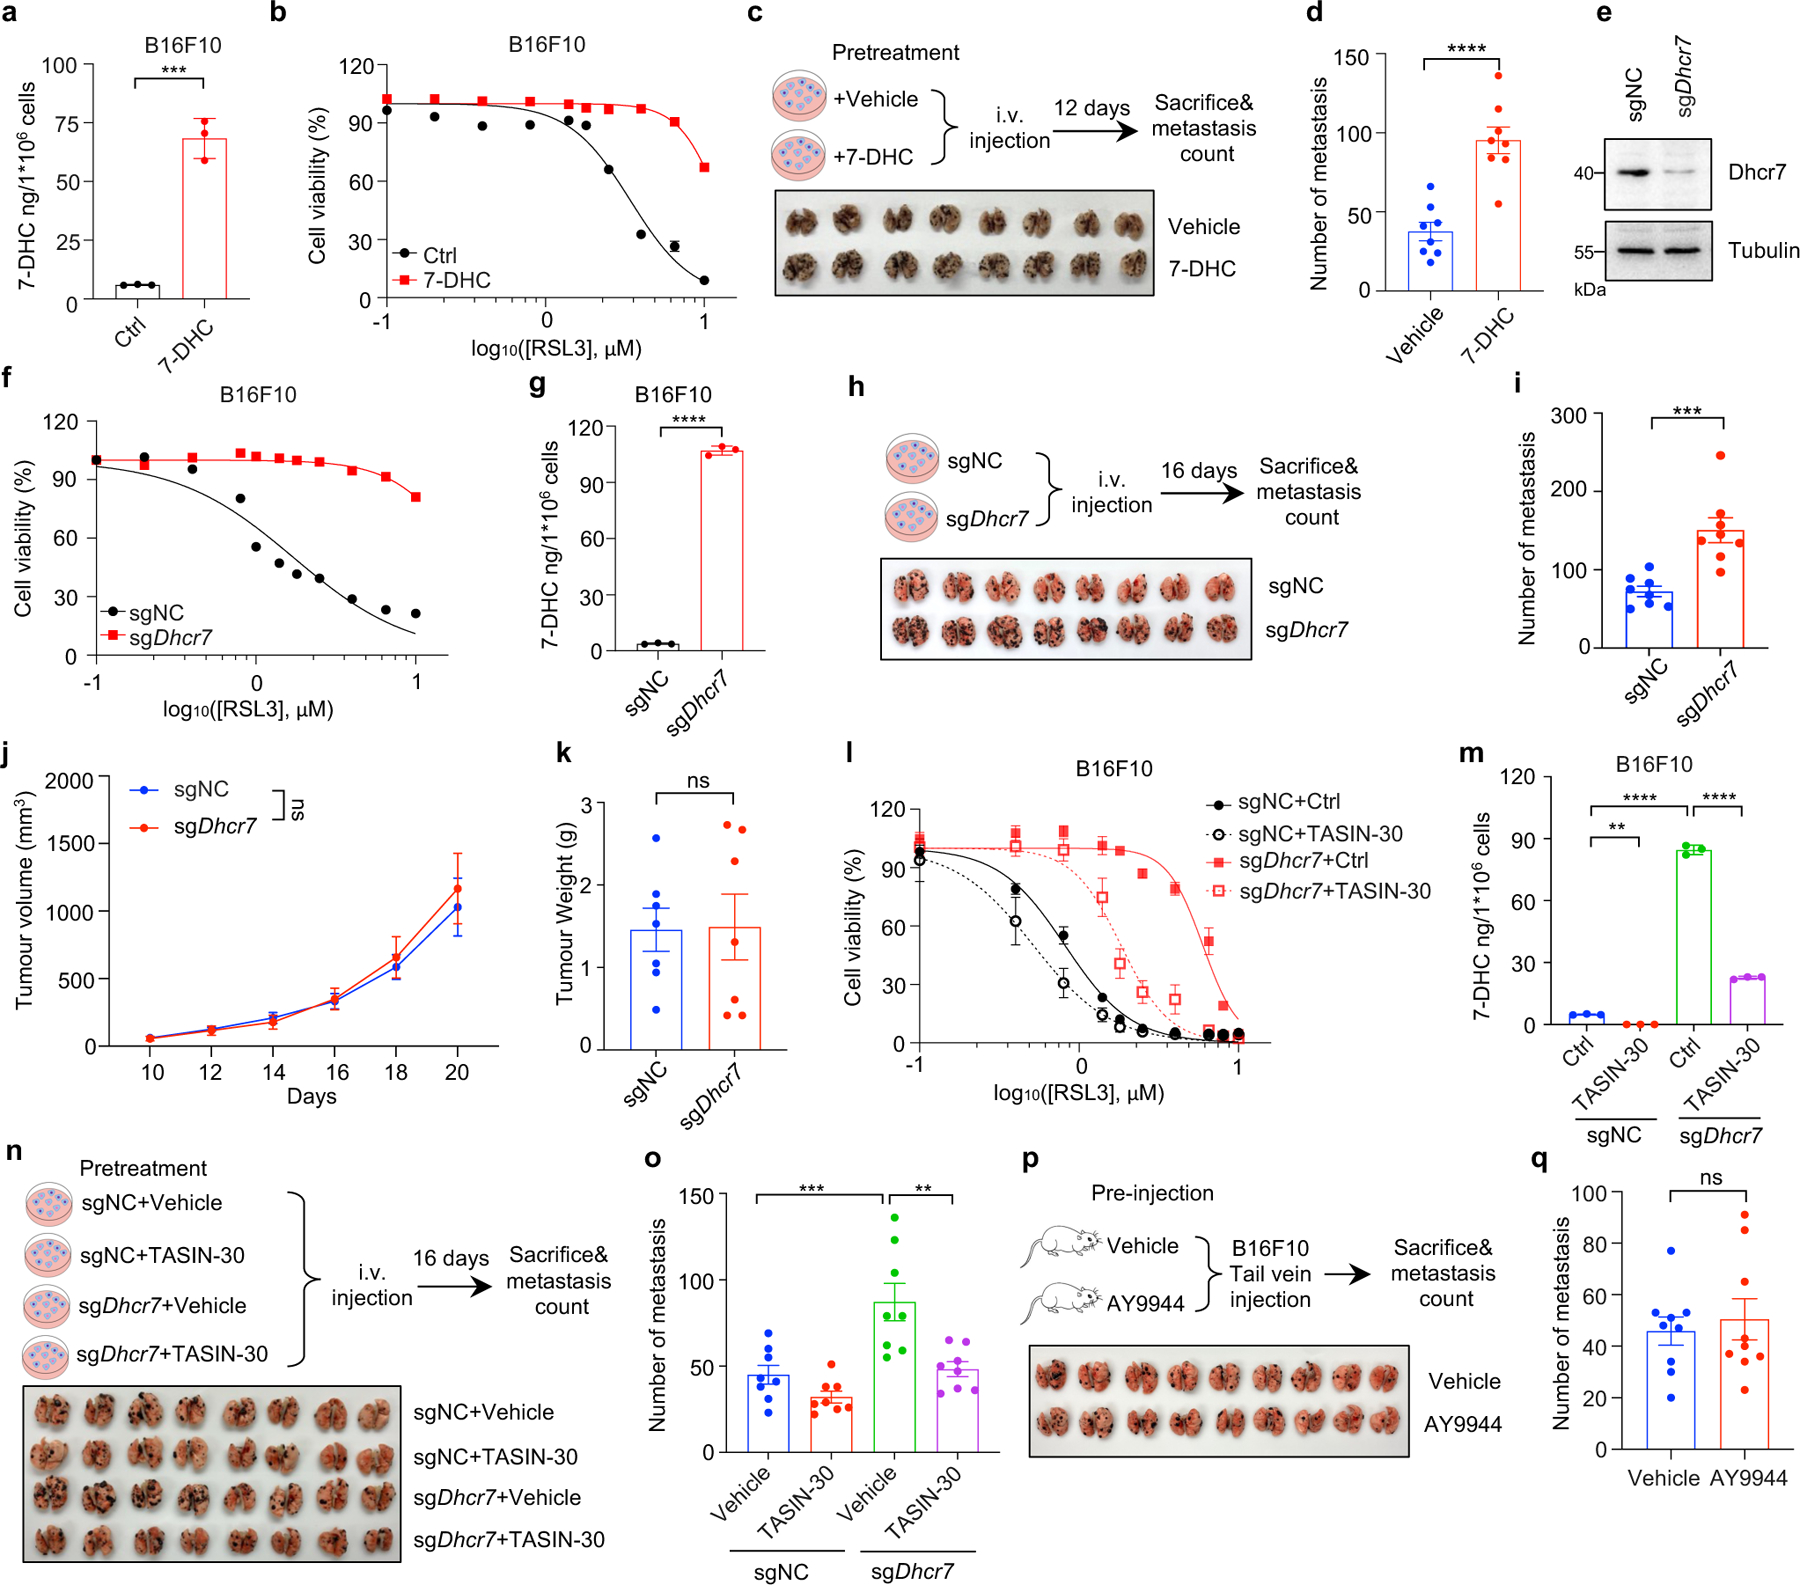
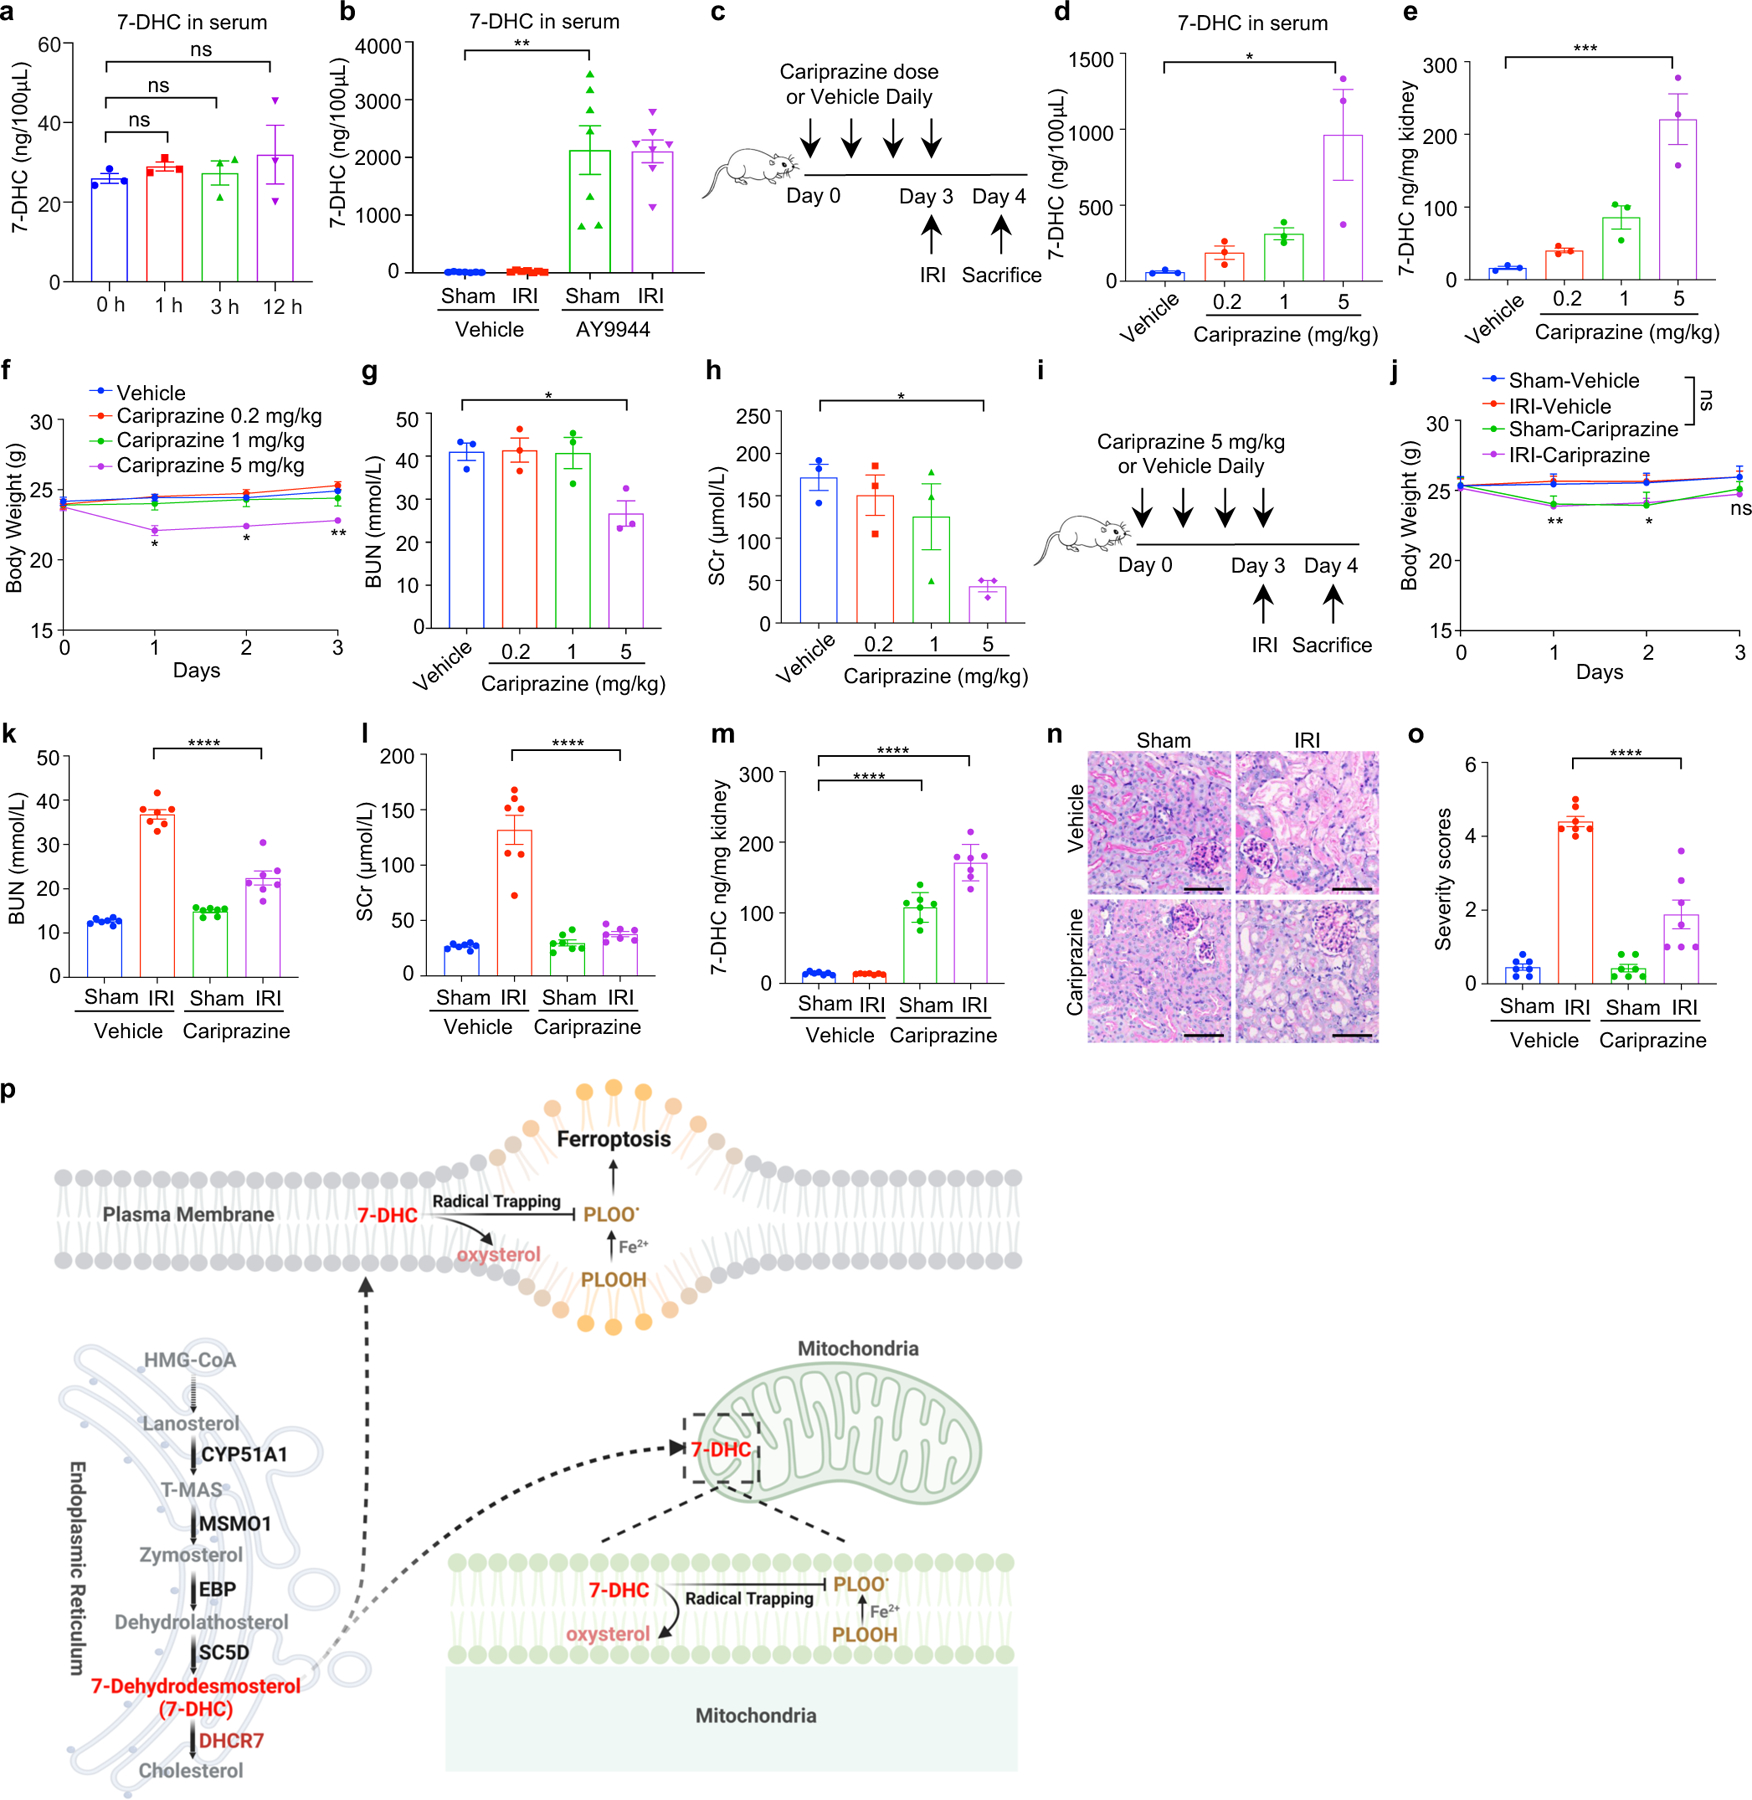
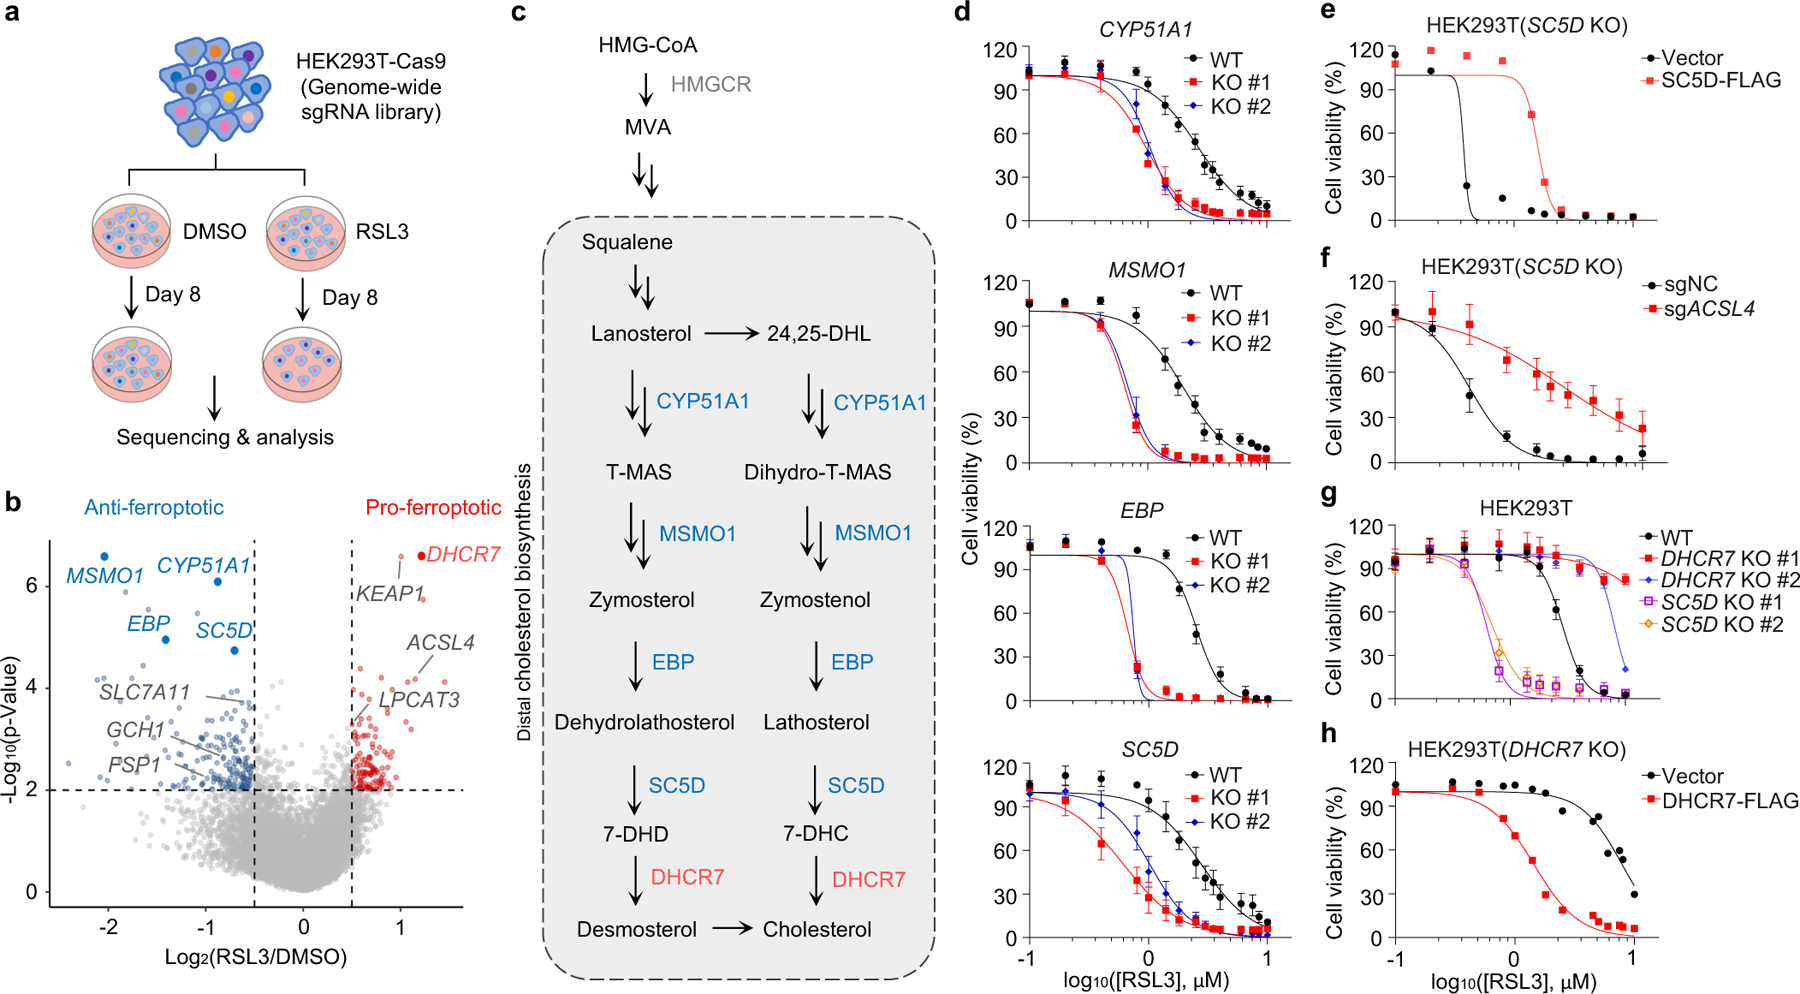
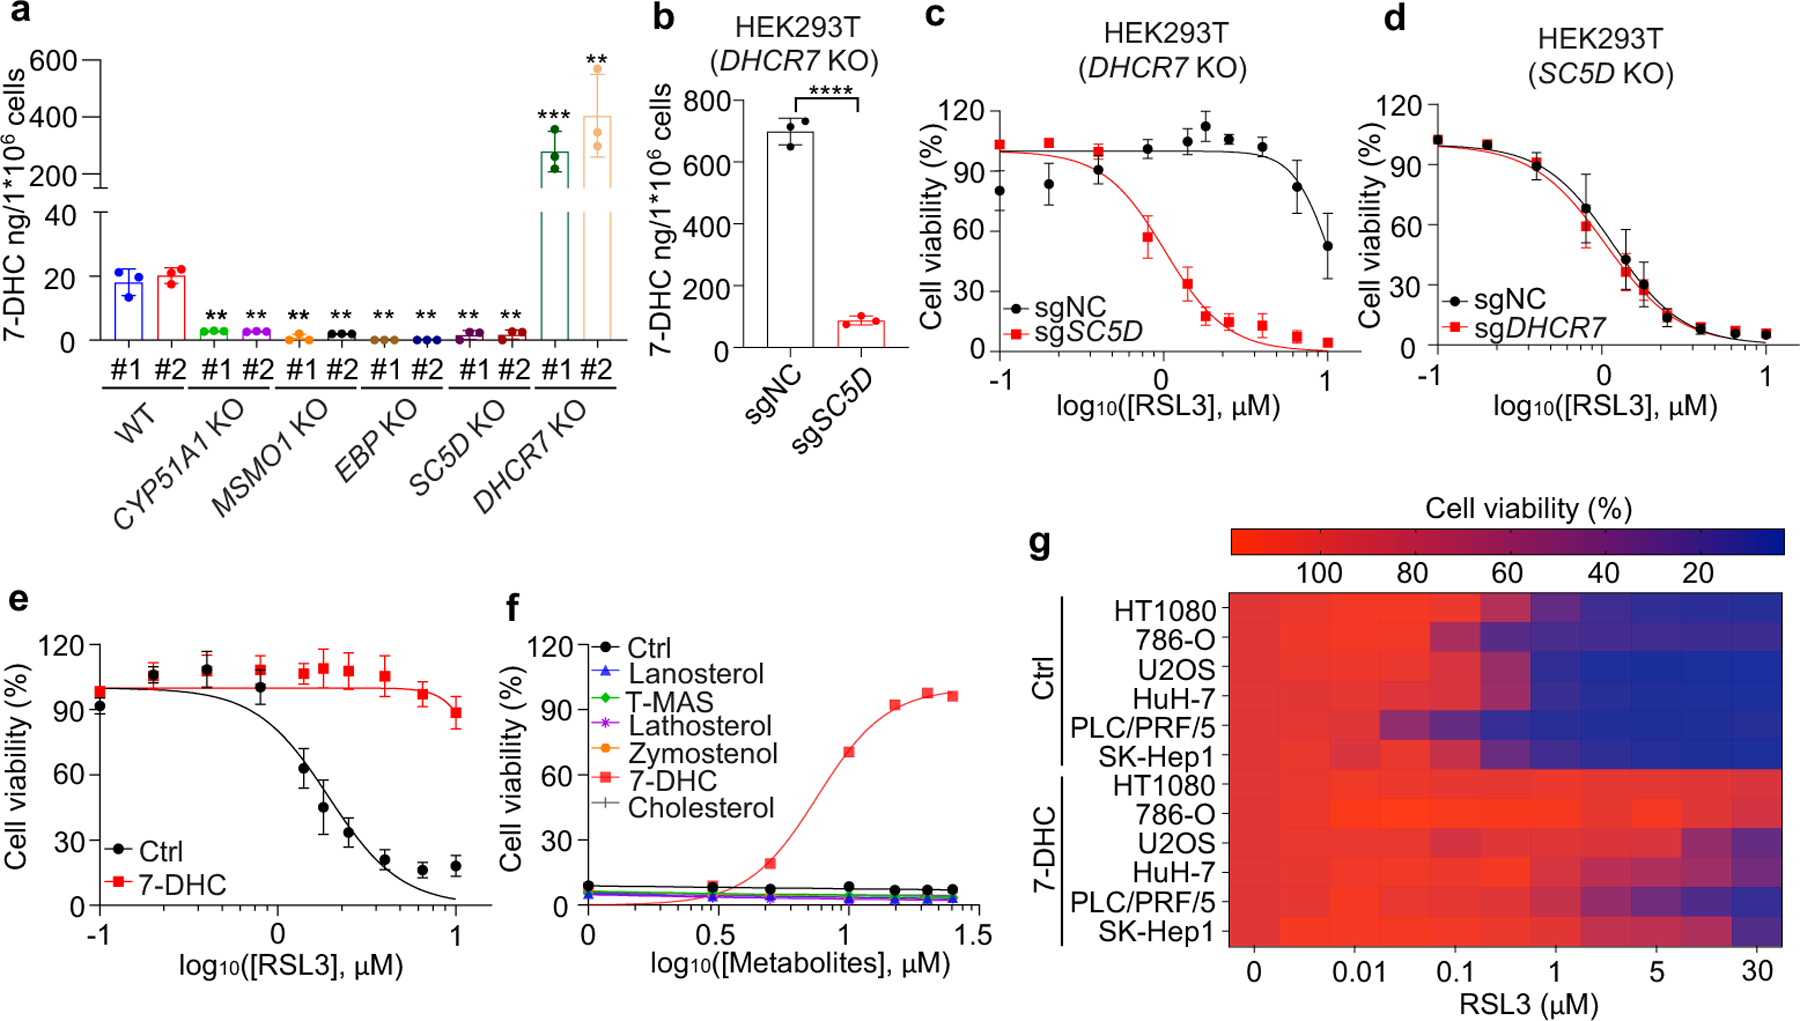
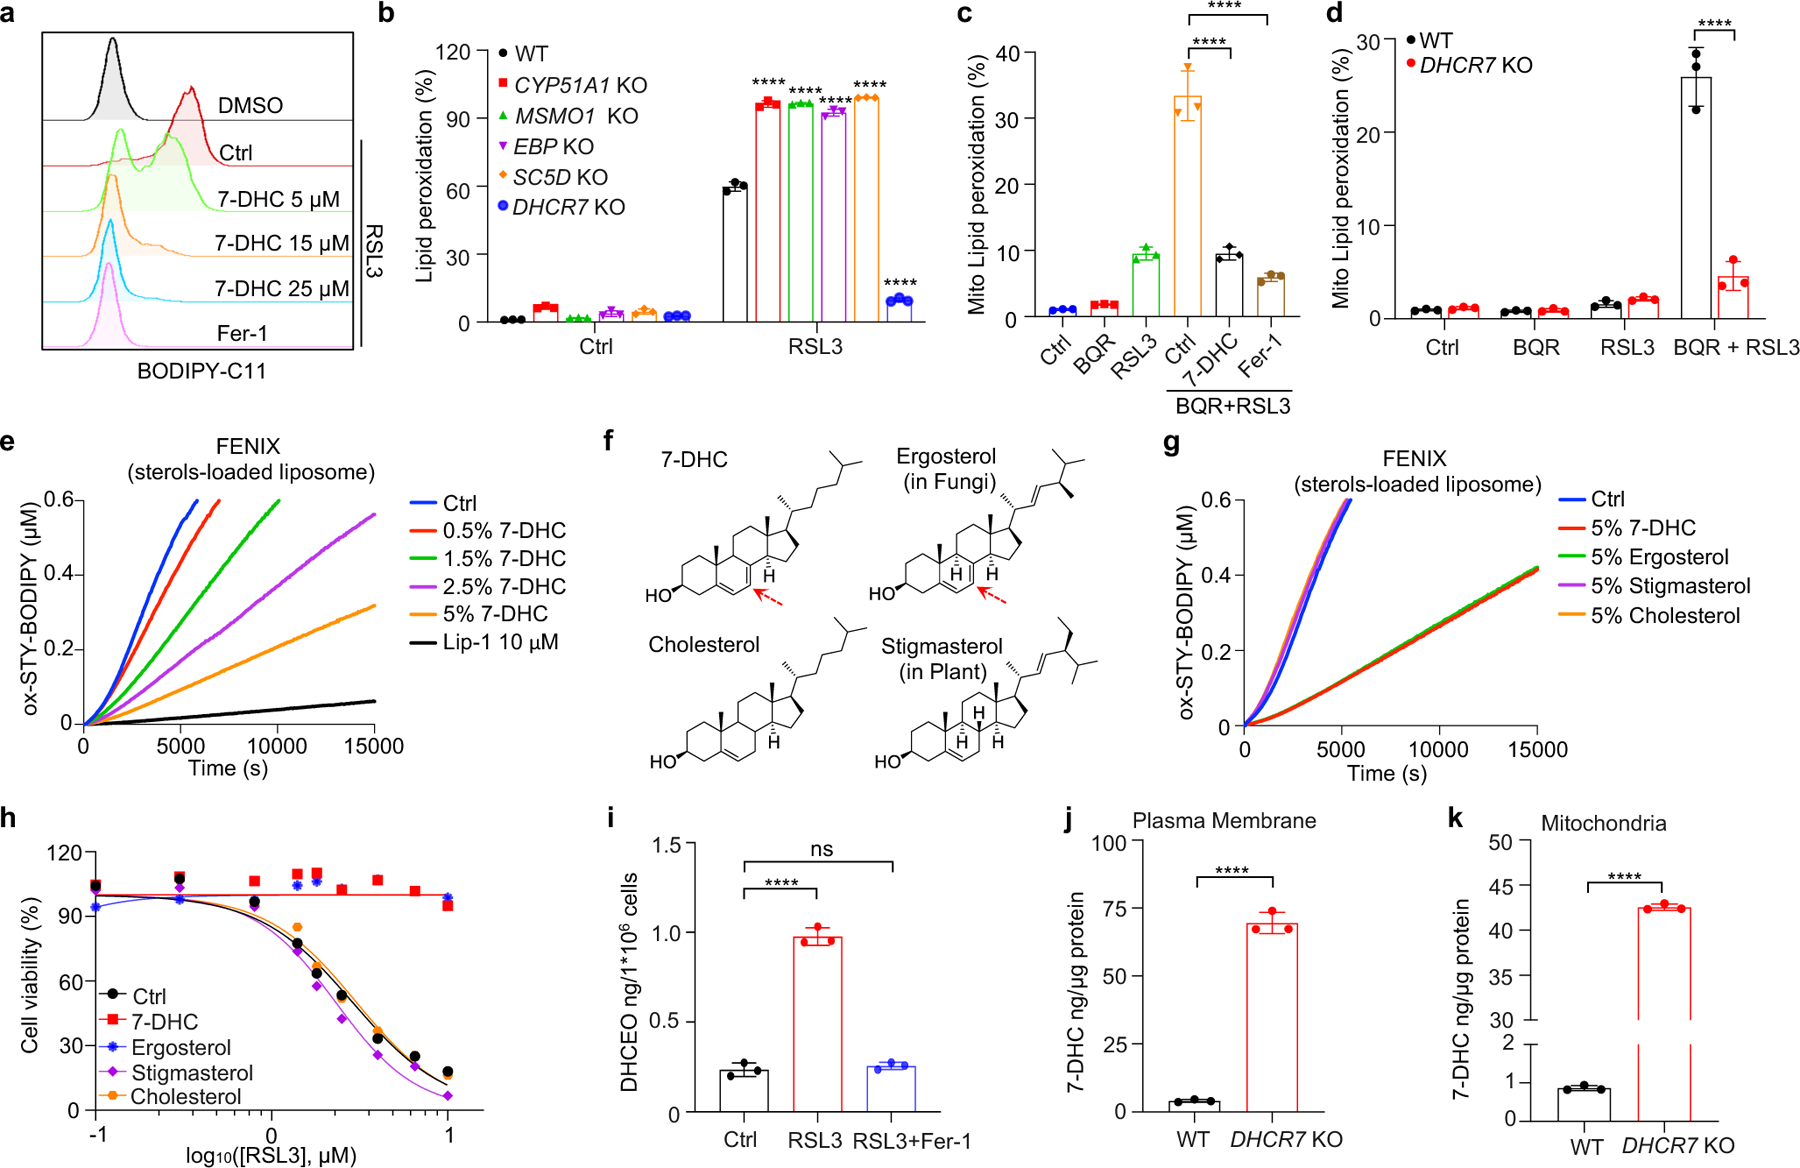
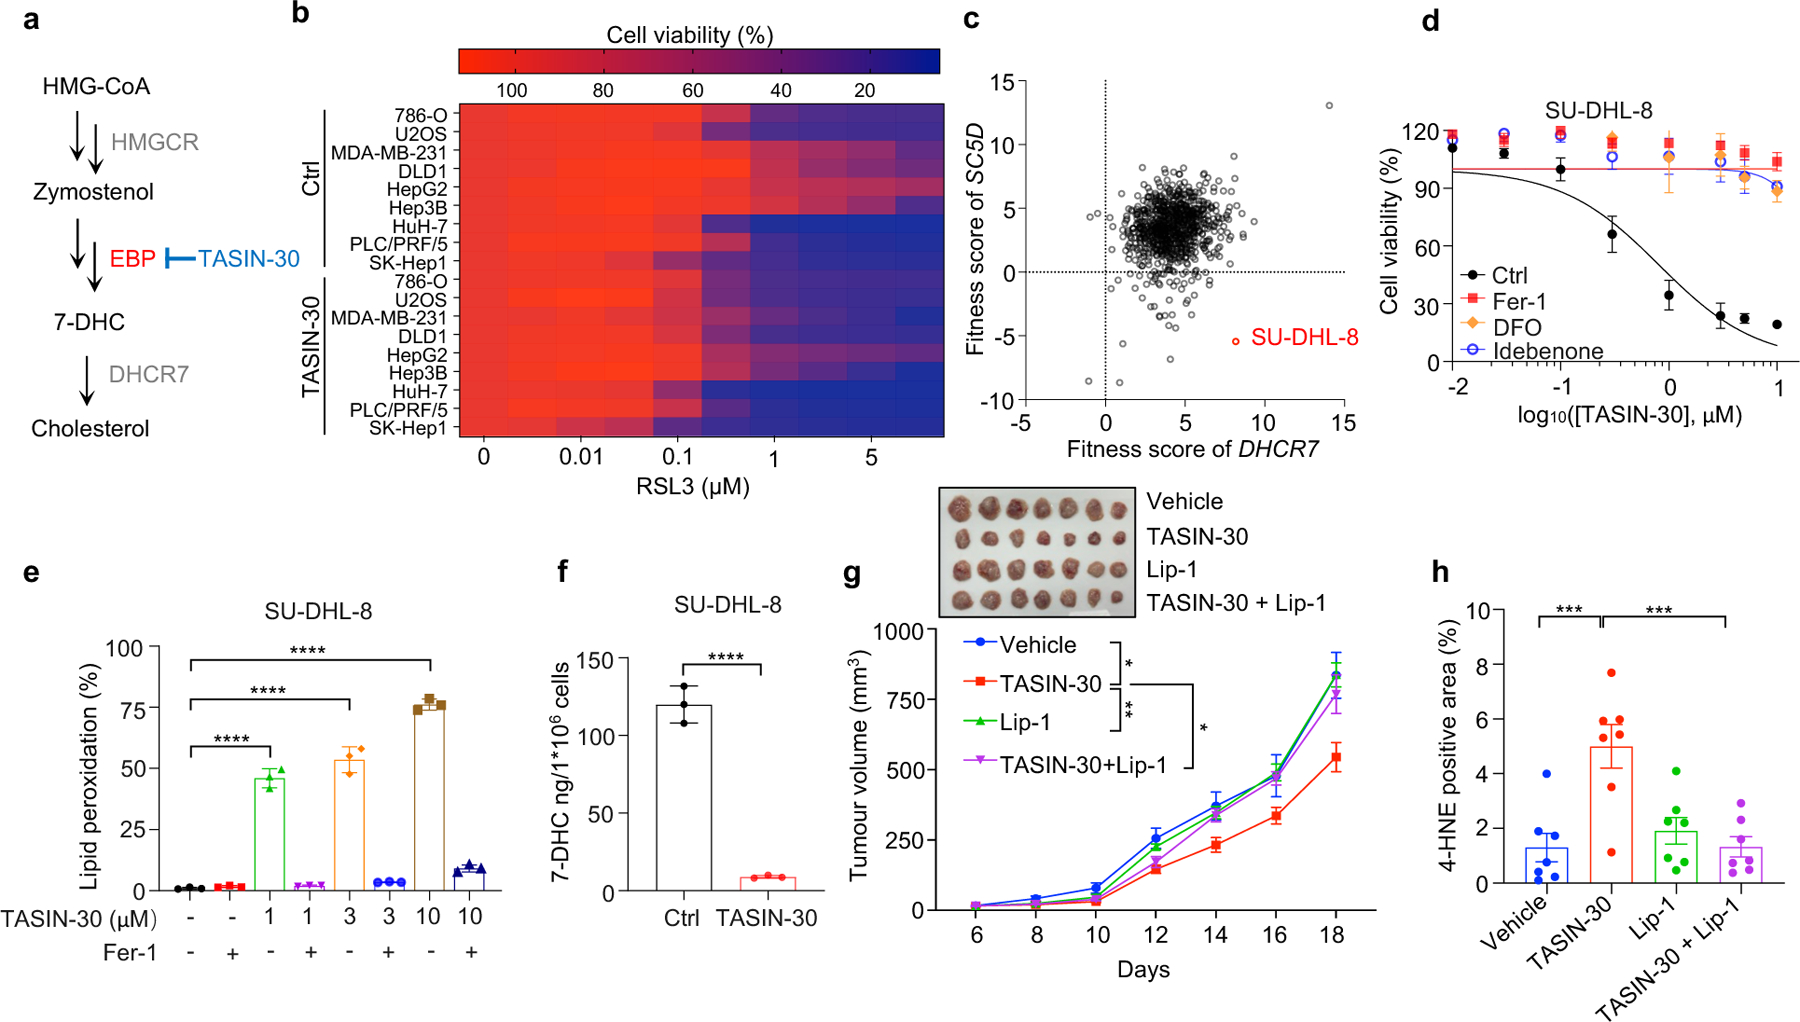
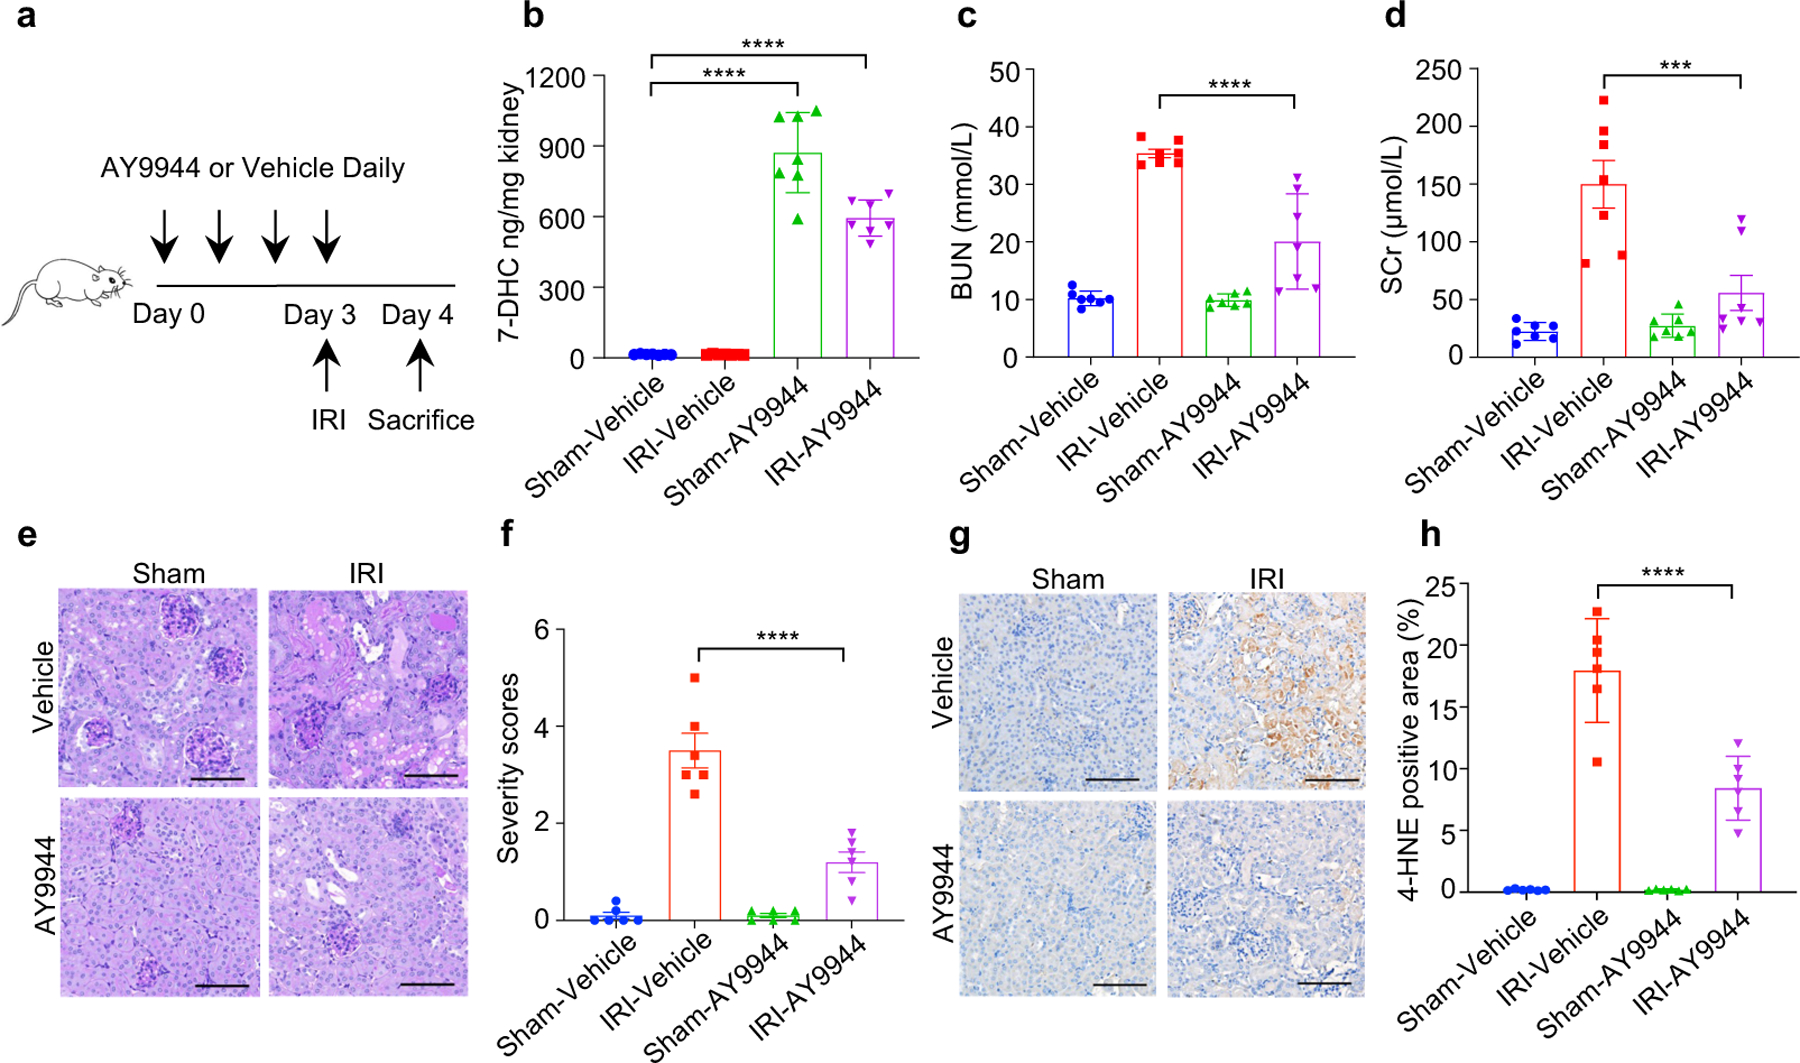
Ferroptosis, a form of regulated cell death that is driven by iron-dependent phospholipid peroxidation, has been implicated in multiple diseases, including cancer1-3, degenerative disorders4 and organ ischaemia-reperfusion injury (IRI)5,6. Here, using genome-wide CRISPR-Cas9 screening, we identified that the enzymes involved in distal cholesterol biosynthesis have pivotal yet opposing roles in regulating ferroptosis through dictating the level of 7-dehydrocholesterol (7-DHC)-an intermediate metabolite of distal cholesterol biosynthesis that is synthesized by sterol C5-desaturase (SC5D) and metabolized by 7-DHC reductase (DHCR7) for cholesterol synthesis. We found that the pathway components, including MSMO1, CYP51A1, EBP and SC5D, function as potential suppressors of ferroptosis, whereas DHCR7 functions as a pro-ferroptotic gene. Mechanistically, 7-DHC dictates ferroptosis surveillance by using the conjugated diene to exert its anti-phospholipid autoxidation function and shields plasma and mitochondria membranes from phospholipid autoxidation. Importantly, blocking the biosynthesis of endogenous 7-DHC by pharmacological targeting of EBP induces ferroptosis and inhibits tumour growth, whereas increasing the 7-DHC level by inhibiting DHCR7 effectively promotes cancer metastasis and attenuates the progression of kidney IRI, supporting a critical function of this axis in vivo. In conclusion, our data reveal a role of 7-DHC as a natural anti-ferroptotic metabolite and suggest that pharmacological manipulation of 7-DHC levels is a promising therapeutic strategy for cancer and IRI.


Conflict of interest statement

Competing interests X.J. is an inventor on patents related to autophagy and cell death and holds equity of and consults for Exarta Therapeutics and Lime Therapeutics. The other authors declare no competing interests.

Figures

Extended Data Fig. 1|
Extended Data Fig. 1|. Identification of distal CB pathway including CYP51A1, MSMO1, EBP and SC5D as ferroptosis suppressors.
a, Integrative analysis of pooled CRISPR genetic screening using MAGeCK and identification of top candidate genes that were assigned with values generated from negative selection (anti-ferroptotic) by modified robust ranking aggregation (α-RRA) analysis. b, The normalized read counts of sgRNAs by CYP51A1, MSMO1, EBP and SC5D, generated by the MAGeCK-test module. n=5 sgRNAs per gene. c, Schema of the cholesterol pathway. Top screen hits are shown as red (pro-ferroptotic) or blue (anti-ferroptotic). d, The protein-protein interaction network was constructed using the STRING database to identify the top screening hits. e, GO analysis (conducted by https://string-db.org) evaluates global functional category enrichment of gene lists and indicates pathway-level pattern enrichment of cholesterol synthesis from the 50 top scoring genes. FDR are p-values corrected for multiple testing using the Benjamini–Hochberg procedure. f, CTRP analysis (conducted with https://portals.broadinstitute.org/ctrp.v2.1/) shows that the expression levels of CYP51A1, MSMO1, EBP and SC5D, positively correlate with their resistance to ferroptosis induced by the compounds (i.e. RSL3, ML162, ML210 and Erastin) in cancer cells. Plotted values are z-scored Pearson’s correlation coefficients with minima and maxima of the distributions; line, median; box, 25th–75th percentile; whiskers, expansion of outlier compounds (red dots) according to the interquartile multiplier (as shown in right).
Extended Data Fig. 2|
Extended Data Fig. 2|. The distal cholesterol biosynthesis genes regulates ferroptosis.
a, Genotyping of subclones generated from HEK293T cells expressing sgRNAs targeting MSMO1, SC5D and EBP by Sanger sequencing. b, The protein level of CYP51A1 in CYP51A1 KO HEK293T cells was analyzed by Immunoblotting. c, Cell viability of WT and CYP51A1, MSMO1, EBP, SC5D KO HEK293T cells treated with ML210 for 8–10 h. d, e, Cell viability of WT and CYP51A1, MSMO1, EBP, SC5D KO HEK293T cells treated with RSL3 for 6–8 h following pretreatment of DMSO, Fer-1 (1 μM), DFO (20 μM) and Idebenone (10 μM) (d) or Fer-1 (1 μM), Z-VAD-FMK (20 μM) and Nec-1s (20 μM) (e). f, The protein level of SC5D-FLAG in SC5D KO HEK293T cells expressing vector and SC5D-FLAG was analyzed by Immunoblotting. g, The protein level of ACSL4 in SC5D KO HEK293T cells expressing sgRNAs targeting ACSL4 was analyzed by Immunoblotting. h, The normalized read counts of sgRNAs by DHCR7, generated by the MAGeCK-test module. n=5 sgRNAs. i, Integrative analysis of pooled CRISPR genetic screening using MAGeCK and identification of top candidate genes that were assigned with values generated from positive selection (pro-ferroptotic) by modified robust ranking aggregation (α-RRA) analysis. j, The protein level of DHCR7 in WT and DHCR7 KO HEK293T cells was detected by Immunoblotting. k, Cell viability of WT and DHCR7 KO HEK293T cells treated with ML210 for 8–10 h. l, The protein level of DHCR7-FLAG in DHCR7 KO HEK293T cells expressing vector and DHCR7-FLAG analyzed by Immunoblotting. For b-g, j-l, data are representative of three independent experiments. Data are mean ± s.d. of n=3 biological replicates.
Extended Data Fig. 3|
Extended Data Fig. 3|. Distal CB pathway regulates ferroptosis independent of cholesterol and known ferroptosis defense system.
a, Levels of cholesterol in WT and CYP51A1, MSMO1, EBP, SC5D, DHCR7 KO HEK293T cells. b, Relative concentration of cholesterol in FBS and LPDS measured by Amplex® Red Cholesterol Assay Kit. c, The concentrations of cholesterol in FBS and LPDS detected by LC-MS/MS. d, e, Cell viability in HEK293T (d) and HT1080 (e) cells treated with RSL3 for 6–8 h after pretreatment with or without cholesterol (25 μM) for 24 h in FBS- or LPDS-supplemented medium. n=2 biological replicates. f, g, The protein levels of GPX4, FSP1, DHODH, ACSL4 and SLC7A11 in WT SC5D KO (f) and DHCR7 KO (g) HEK293T cells detected by immunoblotting. h, i, GSH/GSSG level measurement in WT, SC5D KO (c) and DHCR7 KO (d) HEK293T cells. j, k, FACS analysis of Fe2+ using FerroOrange probe by measuring MFI values in WT, SC5D KO (j) and DHCR7 KO (k) HEK293T cells. l, m, Levels of squalene (l) and CoQ10 (m) in WT, SC5D KO and DHCR7 KO HEK293T cells. Data are representative of two (a-c, l, m) and three (d-k) independent experiments. Data are mean ± s.d. of n=3 biological replicates (a-c, h-m). Statistical analysis was performed using one-way ANOVA (a, h-m) or unpaired two-tailed t-tests (b and c); ****P < 0.0001; ns, not significant.
Extended Data Fig. 4|
Extended Data Fig. 4|. 7-DHC suppresses ferroptosis.
a, The protein level of DHCR7 in SC5D KO HEK293T cells expressing sgRNAs targeting DHCR7 detected by Immunoblotting. b, g, The concentration of 7-DHC in WT and DHCR7 KO HEK293T cells after treatment of indicated concentrations of AY9944 (b) or cariprazine (g) for 48 h. c, h, Cell viability of WT, DHCR7 KO and SC5D KO HEK293T cells treated with RSL3 for 8 h after pretreatment of AY9944 (100 nM) (c) or cariprazine (100 nM) (h) for 48 h. d, Schema of cholesterol biosynthesis pathway. e, i, Cell viability of U937 and SNU-1 cells treated with RSL3 for 18 h after pretreatment of AY9944 (100 nM) (e) or cariprazine (100 nM) (i) for 48 h. f, j, Representative autoxidation inhibited by indicated concentration of AY9944 (f) and cariprazine (j). k, Levels of 7-DHC in HEK293T cells after treatment of indicated dose of ethanol-dissolved 7-DHC or MβCD-coated 7-DHC for 24 h. l, Cell viability of HEK293T cells treated with RSL3 for 8 h after pretreatment of ethanol-dissolved 7-DHC(25 μM) or MβCD-coated 7-DHC (25 μM) for 24 h. m, Cell viability of HEK293T cells treated with RSL3 for 8 h after pretreatment of MβCD-coated sterols (25 μM) for 24 h. Data are representative of at least two (a-c and e-m) independent experiments. Data are mean ± s.d. of n=3 biological replicates (b, c, e, g-I and k-m). Statistical analysis was performed using two-way ANOVA (b, g and k); *P < 0.05, ****P < 0.0001, ns, not significant.
Extended Data Fig. 5|
Extended Data Fig. 5|. 7-DHC is a general suppressor of ferroptosis.
a, Cell viability of various cancer cell lines treated with indicated concentrations of RSL3 for 6–8 h after pretreatment of 7-DHC (25 μM) for 24 h. For HuH-7, PLC/PRF/5 and SK-Hep1, n=2 biological replicates and for 786-O, U2OS and HT1080, n=3 biological replicates. b, Cell viability of U2OS and RCC4 treated with indicated concentrations of Erastin for 16 h after pretreatment of 7-DHC (25 μM) for 24 h. n=2 biological replicates. c, d, Cell viability of various human cancer cell lines (human hepatocellular carcinoma cell lines HuH-7, PLC/PRF/5 and SK-Hep1; human kidney cancer cell lines Caki-1; human kidney cancer cell line 786-O; human osteosarcoma cell line U2OS; human fibrosarcoma cell line HT1080) treated with indicated concentrations of RSL3 for 8–12 h after pretreatment of AY9944 (100 nM) (c) or cariprazine (100 nM) (d) for 48 h in LPDS-supplemented medium. For Caki1, n=2 biological replicates and for the other cell lines, n=3 biological replicates. For a-d, data are representative of at least two independent experiments. Data are shown as the mean ± s.d. when n=3 biological replicates (a, c, d).
Extended Data Fig. 6|
Extended Data Fig. 6|. 7-DHC protects against phospholipid peroxidation.
a, Lipid peroxidation assessment of HEK293T treated with RSL3 (2.5 μM) for 2 h after pretreatment of 7-DHC and Fer-1. b, c, Lipid peroxidation assessment of HT1080 treated with RSL3 (1 μM) for 1.5 h after pretreatment of 7-DHC. d, Lipid peroxidation assessment of WT and CYP51A1, MSMO1, EBP, SC5D, DHCR7 KO HEK293T treated with RSL3 (2.5 μM) for 1 h. e. Heat map showing the representation of oxidized phospholipid in WT and DHCR7 KO HEK293T treated with or without RSL3 for 4 h. Each row represents z-score-normalized intensities of the detected lipid species. a, acyl; e, plasmanyl. f, g, Lipidomic profile of phosphatidylethanolamine (PE) (f) and phosphatidylcholine (PC) (g) of WT and DHCR7 KO HEK293T. h, Mitochondrial lipid peroxidation assessment of HT1080 treated with RSL3 (0.5 μM) and BQR (200 μM) for 2 h after pretreatment of 7-DHC (25 μM) and Fer-1 for 24 h. i, Mitochondrial lipid peroxidation assessment of WT and SC5D KO HEK293T treated with RSL3 (1 μM) and BQR (200 μM). j, Chemical structures of different sterols. Red arrows point to 5, 7-diene. k, Representative autoxidation inhibited by indicated concentrations of 7-DHC. l, Representative autoxidation inhibited by 50 μM indicated sterols. m, Cell viability of HEK293T treated with RSL3 (5 μM) for 8 h after pretreatment of indicated sterols for 24 h. n=2 biological replicates. n, Cell viability of HEK293T treated with RSL3 for 8 h after pretreatment of 7-DHC (25 μM) or 7-DHD (25 μM) for 24 h. n=2 biological replicates. o, Levels of 7-DHC in HEK293T treated with RSL3 (4.5 μM) for indicated time. p, Chemical structures of 7-DHC-derived oxysterol DHCEO. q, r, The relative mRNA level(q) and protein level(r) of GPX4, FSP1, SLC7A11 and ACSL4 in HEK293T treated with 7-DHC (25 μM) for 24 h. s, The relative mRNA levels of ACSL1, TF and SCD1 in HEK293T treated with 7-DHC (25 μM) for 24 h, then cultured in LPDS-supplemented medium with 7-DHC for 24 h. t, The protein levels of ACSL1, TF, SCD1, SREBP2 (p-SREBP2) and nuclear form of SREBP2 (n-SREBP2) in HEK293T. Cells were treated with 7-DHC (25 μM) or the ethanol control (Ctrl) for 24 h, then cultured in LPDS-supplemented medium with 7-DHC for 24 h. Data are representative of two (e, k, l) or three (a-d, h, i, m-t) independent experiments, one experiment (f, g). Data are mean ± s.d. of n=3 biological replicates (a-e, h, i, o-s), n=4 biological replicates (f, g). Statistical analysis was performed using one-way ANOVA (a, c, h, o, and q) or two-way ANOVA (i and s); ***P < 0.001, ****P < 0.0001.
Extended Data Fig. 7|
Extended Data Fig. 7|. Regulation of 7-DHC level during ferroptosis.
a, DHCR7 location in cell plasma membrane (PM) was detected by immunoblotting. b, Cells expressing vector or 3HA-OMP25 were performed mitochondria immunoprecipitation, DHCR7 was detected in mitochondria by immunoblotting. c, The captured mitochondria were used for LC/MS detection. Proteins identified by the mass spectrometry. d, Detection of DHCR7 carbonylation in HEK293T cells expressed DHCR7-FLAG after induced with RSL3 (6 μM) following treatment of Lip-1 (10 μM). e-g, m-APA labeled carbonylation of DHCR7 in HEK293T cells treated with RSL3 (6 μM) (e), ML210 (10 μM) (f) and in RCC4 treated with Erastin (10 μM) (g) following treatment of Lip-1 (10 μM) or Fer-1 (1 μM). h, m-APA labeled carbonylation of DHCR7 in HEK293T cells treated with RSL3 (5 μM) for indicated time. Level of lipid peroxidation and cell death (TB positive, TB: Trypan Blue) from indicated time points are depicted below in grey scale. i, m-APA selectively labeled carbonylation on C380 of HEK293T cells treated with RSL3 (4 μM). j, Schema of DHCR7 and carbonylated DHCR7 enrichment and the enzyme activity detection by NADPH-dependent reduction. DHCR7 from DMSO (DHCR7-D1st) or RSL3 (DHCR7-R1st) treatment group were enriched by Flag IP. Carbonylated DHCR7 (DHCR7-R2nd) were enriched from DHCR7-R1st by biotin IP. k, Relative DHCR7 enzyme activity detected by the reduction of NADPH. l, m, A structural comparison between the crystal structure of the delta-14 sterol reductase from M. alcaliphilum (grey) and the human DHCR7 structure predicted by AlphaFold2 (cyan), the same residues are found at the NAPDH-binding pocket (red). n, Proposed model of regulation of 7-DHC level during ferroptosis. Image created with BioRender. For a-i, data are representative of at least two independent experiments. For k, data are mean ± s.d. of n=4 biological replicates from two independent experiments. Statistical analysis was performed using one-way ANOVA (k), ***P < 0.001.
Extended Data Fig. 8|
Extended Data Fig. 8|. Targeting 7-DHC biosynthesis regulates cancer cell sensitivity to ferroptosis.
a, Levels of 7-DHC in various cancer cell lines treated with TASIN-30 (10 μM) for 8 h. b, Cell viability of various cancer cell lines treated with indicated concentrations of RSL3 for 8–10 h (SK-Hep1, HuH-7, PLC/PRF/5, U2OS and 786-O) or 18–24 h (HepG2, Hep3B, DLD1 and MDA-MB-231) following pretreatment of TASIN-30 (10 μM), Fer-1 (1 μM) or TASIN-30 (10 μM) plus Fer-1 (1 μM) for 4 h. c, Cell viability of WT, DHCR7 KO and EBP KO HEK293T cells treated with RSL3 for 8 h after pretreatment of TASIN-30 for 4 h. d, The fitness score of SC5D and DHCR7 in top 10 cell lines ranked by predicted dependence of 7-DHC. The predicted dependence of 7-DHC score is calculated by fitness score of DHCR7 minus fitness score of SC5D. e, Lipid peroxidation assessment of SU-DHL-8 cells treated with indicated concentrations of TASIN-30 for 16 h with pretreatment of Fer-1. f, Levels of 7-DHC in tumour tissue of SU-DHL-8 xenografts with indicated treatments. n=7 in each group. g, Tumour weight of SU-DHL-8 xenografts with indicated treatments over time. n=7 in each group. h, Body weight of SU-DHL-8 xenografts with indicated treatments over time. n=7 in each group. Data plotted are mean ± s.e.m. i, Representative immunohistochemical staining of 4-HNE in tumour tissue of SU-DHL-8 xenografts with indicated treatments. Representative images of 7 different samples from a single experiment are shown. Scale bar, 50 μm. For (a-c and e), data are representative of three independent experiments (b) or two independent experiments (a, c, e), and data are mean ± s.d. of n=3. For f-i, data are representative of two independent experiments (g, h) and one experiment (f, i), data plotted are mean ± s.e.m. and statistical analysis was performed using two-way ANOVA; **P < 0.01, ****P < 0.0001. Statistical analysis was performed using unpaired two-tailed t-test (a); ***P < 0.001, ****P < 0.0001.
Extended Data Fig. 9|
Extended Data Fig. 9|. 7-DHC promotes metastasis.
a, Levels of 7-DHC in B16F10 treated with 7-DHC (25 μM) for 24 h. b, Cell viability of B16F10 with treatment of RSL3 for 6–8 h following pretreatment of 7-DHC (25 μM) for 24 h. n=2 biological replicates. c, d, Image (c) and quantification (d) of B16F10 metastatic tumours in lungs with cells pretreated 7-DHC (25 μM) for 24 h. n=8 in each group. e, The protein level of Dhcr7 in sgNC and sgDhcr7 B16F10. f, Cell viability of sgNC and sgDhcr7 B16F10 treated with RSL3 for 6–8 h. n=2 biological replicates. g, Levels of 7-DHC in sgNC and sgDhcr7 B16F10. h, i, Image (h) and quantification (i) of sgNC and sgDhcr7 B16F10 metastatic tumours. n=8 in each group. j, k, Tumour volume (j) and tumour weight (k) of sgNC and sgDhcr7 B16F10 subcutaneous tumour. n=7 in each group,. l, Cell viability of sgNC and sgDhcr7 B16F10 treated with RSL3 for 10–12 h following pretreatment of TASIN-30 (10 μM) for 24 h. m, Levels of 7-DHC in sgNC and sgDhcr7 B16F10 treated with TASIN-30 (10 μM) for 24 h. n, o, Image (n) and quantification (o) of metastatic tumours of sgNC and sgDhcr7 B16F10 pretreated TASIN-30 (10 μM) for 24h. n=8 in each group. p, q, Image (p) and quantification (q) of metastatic tumours of B16F10 in mice pre-injected with vehicle or AY9944 (25 mg/kg) via i.p. once daily for four times prior to i.v. of B16F10. n=9 in each group. For a-q, data are representative of two independent experiments. Data are mean ± s.d. of n=3 biological replicates (a, g, i, m) for cell experiments and mean ± s.e.m for animal experiments, statistical analysis was performed using unpaired two-tailed t-test (a, d, g, i, k and q) or two-way ANOVA (m and o); **P < 0.01, ***P < 0.001, ****P < 0.0001, ns, not significant.
Extended Data Fig. 10 |
Extended Data Fig. 10 |. Cariprazine protects IRI in vivo.
a, Levels of 7-DHC in serum of mice intraperitoneal injected of 7-DHC after indicated time. n=3 in each group. b, Levels of 7-DHC in serum of mice kidney IRI model with pretreatment of AY9944. n=7 in each group. c, Workflow of mice kidney IRI model with pretreatment of indicated dose of cariprazine via intraperitoneal injection once daily for four times before IRI. d, e, Levels of 7-DHC in serum (d) and kidneys (e) of mice kidney IRI model with pretreatment of indicated dose of cariprazine. f, Body weight of IRI model mice with indicated treatments over time. g, h, The concentration of BUN (g) and SCr (h) of mice IRI model. i, Workflow of IRI model with pretreatment of cariprazine at the dose of 5mg/kg via intraperitoneal injection once daily for four times before IRI. j, Body weight of IRI model mice with indicated treatment over time. k, l, The concentration of BUN (k) and SCr (l) of mice kidney IRI model with indicated treatment over time. m, Levels of 7-DHC in kidneys of mice IRI model with pretreatment of cariprazine. n, o, Representative PAS staining (n) and quantification of renal damage (o) from mice IRI model. Scale bar, 100 μm. For d-h, n=3 in each group, and for i-o, n=7 in each group. For (a and d-o), data plotted are mean ± s.e.m. from one experiment. For b, data are representative of two independent experiments and data plotted are mean ± s.e.m. Statistical analysis was performed using one-way ANOVA (a, d-h) and two-way ANOVA (b, j-m, o), *P < 0.05, **P < 0.01 ***P < 0.001, ****P < 0.0001, ns, not significant. p, Working model of 7-DHC. 7-dehydrocholesterol (7-DHC) protects cells from lipid peroxidation on both plasma membrane and mitochondria via diverting the peroxidation pathway from phospholipids, thus mitigating ferroptosis. PLOOH, phospholipid hydroperoxide; PLOO·, phospholipid hydroperoxyl radical. Image created with BioRender.
Fig. 1|
Fig. 1|. The genes involved in distal cholesterol synthesis differentially regulate ferroptosis.
a, CRISPR screening workflow for identification of ferroptosis regulators. b, Volcano plot of top-ranked genes identified in RSL3-treated HEK293T-Cas9 cells. Genes that meet the cutoff criteria (P<0.01 and LFC>0.5 or <-0.5) are indicated as follows: genes (grey) represent known ferroptosis regulators and genes (blue and red) are involved in cholesterol biosynthesis. The p-Value and LFC are generated by the MAGeCK-test module using modified robust ranking aggregation (α-RRA) analysis. Top screen hits are shown in red (pro-ferroptotic) or blue (anti-ferroptotic). c, Schema of distal cholesterol biosynthesis pathway. d, Cell viability of HEK293T cells expressing sgRNAs targeting negative control (WT), CYP51A1 (CYP51A1 KO), MSMO1 (MSMO1 KO), EBP (EBP KO), or SC5D (SC5D KO), after treatment of indicated concentrations of RSL3 for 6–8 h. e, Cell viability of SC5D KO HEK293T cells expressing vector or SC5D cDNA after treatment of RSL3 for 6–8 h. f, Cell viability of SC5D KO HEK293T cells expressing sgRNAs targeting negative control or ACSL4 after treatment of RSL3 for 6–8 h. g, Cell viability of HEK293T cells expressing sgRNAs targeting negative control, DHCR7 (DHCR7 KO), or SC5D (SC5D KO) after treatment of RSL3 for 6–8 h. h, Cell viability of DHCR7 KO HEK293T cells expressing vector or DHCR7 cDNA after treatment of RSL3 for 10–12 h. Data are mean ± s.d. of n=3 biological replicates (d, f, g). For d-h, n=3 biological replicates (d, f, g) and n=2 biological replicates (e, h) are representative of three independent experiments.
Fig. 2|
Fig. 2|. 7-DHC suppresses ferroptosis.
a, Levels of 7-DHC in WT and CYP51A1, MSMO1, EBP, SC5D, DHCR7 KO HEK293T cells b, Levels of 7-DHC in DHCR7 KO HEK293T cells expressing sgRNAs targeting negative control (sgNC) and SC5D (sgSC5D). c, Cell viability of DHCR7 KO HEK293T cells expressing sgRNAs targeting negative control (sgNC) and SC5D (sgSC5D) treated with RSL3 for 6–8 h. d, Cell viability of SC5D KO HEK293T cells expressing sgRNAs targeting negative control (sgNC) and DHCR7 (sgDHCR7) treated with RSL3 for 6–8 h. e, Cell viability of HEK293T cells treated with RSL3 for 6–8 h after pretreatment of 7-DHC (25 μM) for 24 h. f, Cell viability of HEK293T cells treated with RSL3 (5 μM) for 8 h after pretreatment of indicated concentrations of different sterols for 24 h. n=2 biological replicates. g, Heat map (data summarized from Extended Data Fig. 5a) depicting the dose-dependent toxicity of RSL3 in various human cancer cell lines, 7-DHC treatment vs. the ethanol control (Ctrl). Data are representative of two (a, b) and three (c-g) independent experiments. Data are mean ± s.d. of n=3 biological replicates (a-e), statistical analysis was performed using one-way analysis of variance (ANOVA) (a) or unpaired two-tailed t-tests (b); **P < 0.01; ***P < 0.001; ****P < 0.0001
Fig. 3|
Fig. 3|. 7-DHC shields plasma and mitochondria membranes from autoxidation.
a, Lipid peroxidation assessment of HEK293T cells treated with RSL3 (2.5 μM) for 2 h with pretreatment of indicated concentrations of 7-DHC or Fer-1 (1 μM) for 24 h. b, Lipid peroxidation assessment of WT and CYP51A1, MSMO1, EBP, SC5D, DHCR7 KO HEK293T treated with RSL3 (2.5 μM) for 1 h. c. Mitochondrial lipid peroxidation assessment of HEK293T cells treated with RSL3 (1 μM) and BQR (200 μM) for 1 h with pretreatment of 7-DHC (25 μM) or Fer-1 (1 μM) for 24 h. d, Mitochondrial lipid peroxidation assessment of WT and DHCR7 KO HEK293T cells treated with RSL3 (1 μM) and BQR (200 μM). e, Representative autoxidation of STY-BODIPY (1 μM) and EggPC liposome containing indicated percentage of 7-DHC respectively. f, Chemical structures of 7-DHC, ergosterol, cholesterol and stigmasterol. Red arrows point to 5, 7-diene. g, Representative autoxidation of STY-BODIPY (1 μM) and EggPC liposome containing 5% 7-DHC, 5% ergosterol, 5% stigmasterol and 5% cholesterol respectively. h, Cell viability of HEK293T cells treated with RSL3 for 6–8 h after pretreatment of 7-DHC (25 μM), ergosterol (25 μM), stigmasterol (25 μM) or cholesterol (25 μM) for 24 h. n=2. i, Levels of DHCEO in HEK293T cells treated with RSL3 (5 μM) or plus Fer-1(1 μM) for 4 h. j, k, The concentration of 7-DHC of plasma membrane (j) and mitochondria (k) in WT and DHCR7 KO HEK293T cells. Data are representative of two (e, g, j, k) and three (a-d, and h, i) independent experiments. Data are mean ± s.d. of n=3 biological replicates (a-d and i-k). Statistical analysis was performed using two-way ANOVA (b and d) or one-way ANOVA (c and i) or unpaird two-tailed t-tests (j and k); ****P < 0.0001, ns, not significant.
Fig. 4|
Fig. 4|. Targeting 7-DHC biosynthesis regulates cancer cell sensitivity to ferroptosis.
a, Schema of cholesterol biosynthesis pathway. TASIN-30 is an inhibitor of EBP. b, Heat map (data summarized from Extended Data Fig. 8b) depicting the dose-dependent toxicity of RSL3 in various human cancer cell lines (human kidney cancer cell line 786-O; human osteosarcoma cell line U2OS; human breast cancer cell line MDA-MB-231; human colon cancer cell line DLD1; human hepatocellular carcinoma cell lines HepG2, Hep3B, HuH-7, PLC/PRF/5 and SK-Hep1), TASIN-30 treatment vs. the DMSO control (Ctrl). c, The fitness scores of SC5D and DHCR7 in 810 cancer cell lines were explored by Project Score Database. Fitness score is a quantitative evaluation of the cell viability effect elicited by CRISPR-Cas9-mediated cell inactivation. d, Cell viability of SU-DHL-8 cells treated with indicated concentrations of TASIN-30 for 24 h after pretreatment of Fer-1 (1 μM), DFO (5 μM) or Idebenone (5 μM). e, Lipid peroxidation assessment of SU-DHL-8 cells treated with indicated concentrations of TASIN-30 for 16 h with pretreatment of Fer-1 (1 μM). f, Levels of 7-DHC in SU-DHL-8 cells treated with TASIN-30 (3 μM) for 24 h, both cells were cultured with Fer-1 (1 μM). g, Tumour growth rates of SU-DHL-8 xenografts with indicated treatments over time. n=7 in each group. h, Quantification of immunohistochemical 4-HNE staining in SU-DHL-8 xenografts with indicated treatments. n=7 in each group. Data are representative of three (b, d, e) and two (f, g) independent experiments. For d-f, data are mean ± s.d. of n=3 biological replicates, statistical analysis was performed one-way ANOVA (e and f). For g, h, data plotted are mean ± s.e.m., statistical analysis was performed two-way ANOVA (g and h) ;*P < 0.05, **P < 0.01, ***P < 0.001, ****P < 0.0001.
Fig. 5|
Fig. 5|. 7-DHC attenuates ischemia-reperfusion injury in vivo.
a, Workflow of kidney ischemia–reperfusion injury (IRI) model with pretreatment of AY9944 via intraperitoneal injection once daily for four times before IRI at the dose of 25 mg/kg. b, Levels of 7-DHC in kidneys of mice IRI model. n=7 in each group. c, d, The concentration of blood urea nitrogen (BUN) (c) and serum creatinine (SCr) (d) of mice kidney IRI model. n=7 in each group. e, f, Representative PAS staining (e) and quantification of renal damage (f) from mice kidney IRI model. n=6 in each group. Scale bar, 100 μm. g, h, Representative immunohistochemical staining (g) and quantification (h) of 4-HNE in kidneys from mice IRI model. n=6 in each group. Scale bar, 100 μm. For b-h, data are representative of two independent experiments and data plotted are mean ± s.e.m., statistical analysis was performed two-way ANOVA, ***P < 0.001, ****P < 0.0001.

References

    1. Dixon SJ et al. Ferroptosis: an iron-dependent form of nonapoptotic cell death. Cell 149, 1060–1072, doi:10.1016/j.cell.2012.03.042 (2012). - DOI - PMC - PubMed
    1. Viswanathan VS et al. Dependency of a therapy-resistant state of cancer cells on a lipid peroxidase pathway. Nature 547, 453–457, doi:10.1038/nature23007 (2017). - DOI - PMC - PubMed
    1. Hangauer MJ et al. Drug-tolerant persister cancer cells are vulnerable to GPX4 inhibition. Nature 551, 247–250, doi:10.1038/nature24297 (2017). - DOI - PMC - PubMed
    1. Chen L, Hambright WS, Na R & Ran Q Ablation of the Ferroptosis Inhibitor Glutathione Peroxidase 4 in Neurons Results in Rapid Motor Neuron Degeneration and Paralysis. J Biol Chem 290, 28097–28106, doi:10.1074/jbc.M115.680090 (2015). - DOI - PMC - PubMed
    1. Linkermann A et al. Synchronized renal tubular cell death involves ferroptosis. Proc Natl Acad Sci U S A 111, 16836–16841, doi:10.1073/pnas.1415518111 (2014). - DOI - PMC - PubMed

LinkOut - more resources