. 2024 Feb;56(2):355-369.
doi: 10.1038/s12276-024-01159-5. Epub 2024 Feb 1.

Targeting the m6A RNA methyltransferase METTL3 attenuates the development of kidney fibrosis

Affiliations

Targeting the m6A RNA methyltransferase METTL3 attenuates the development of kidney fibrosis

Hae Rim Jung et al. Exp Mol Med. 2024 Feb.

Abstract

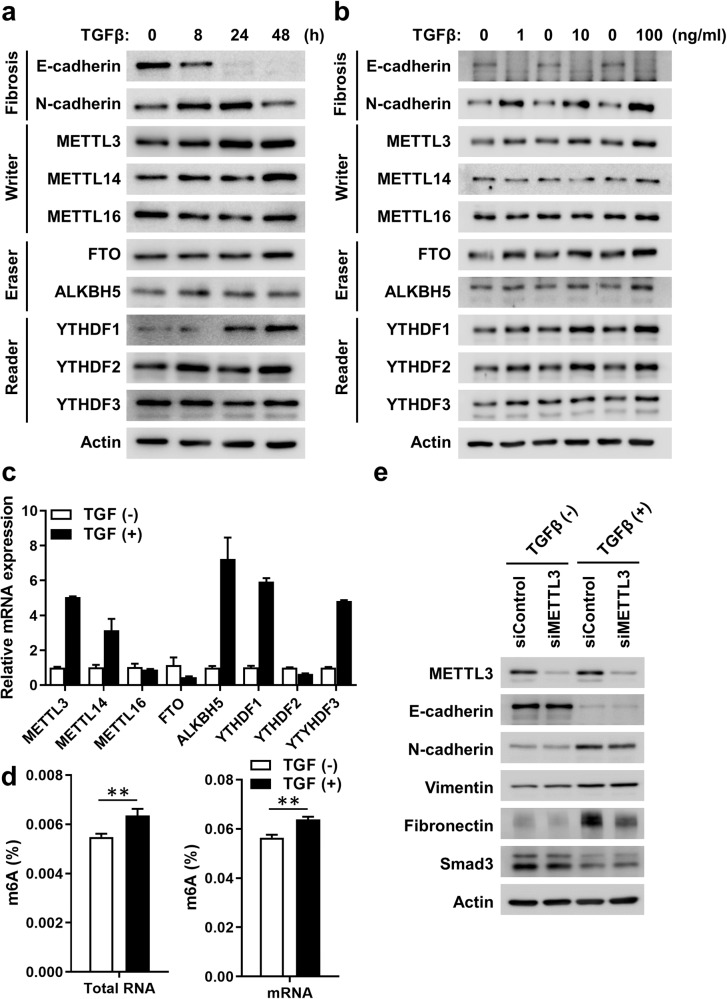
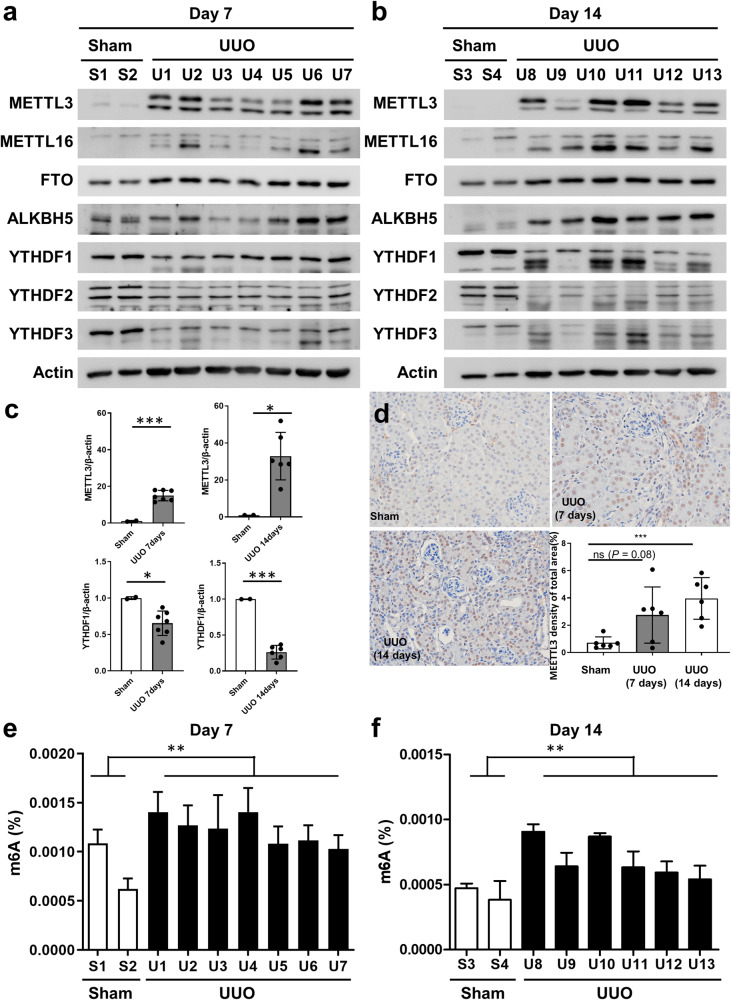
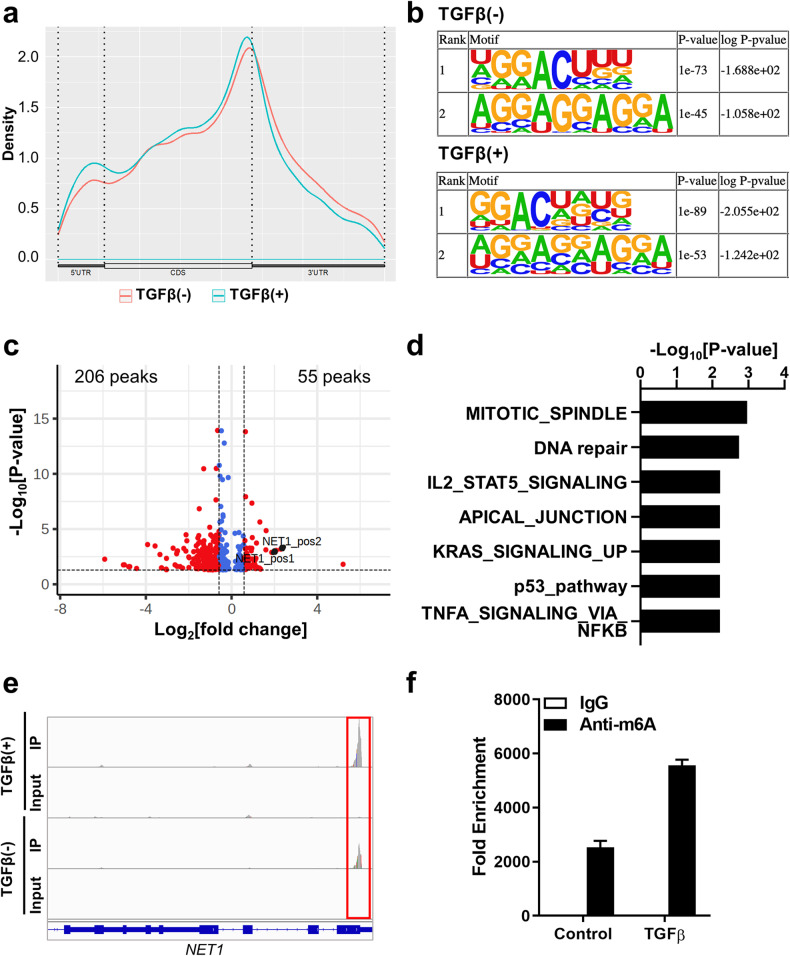
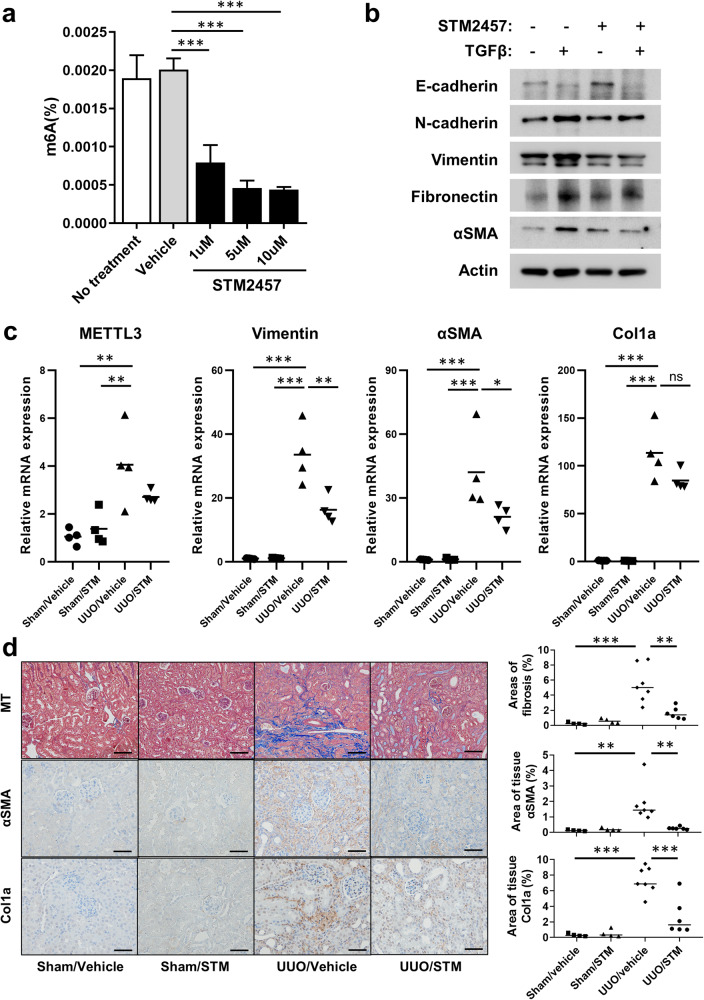
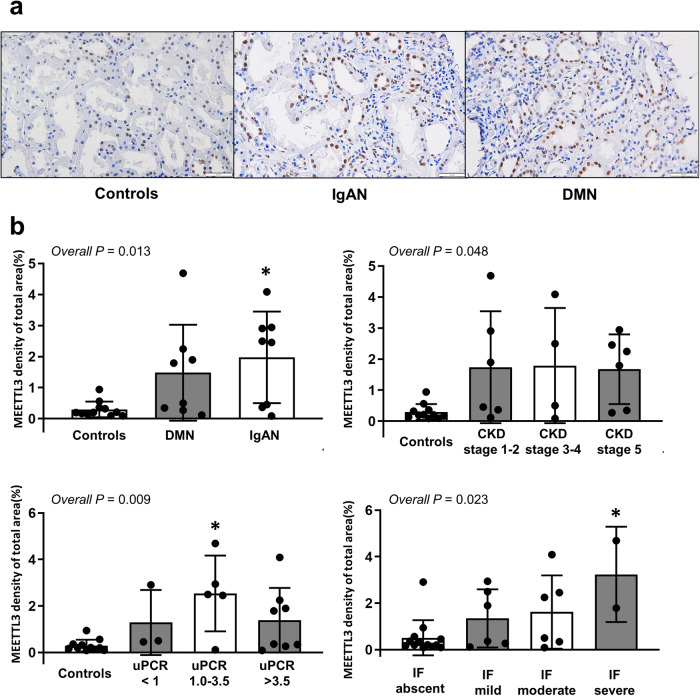
Kidney fibrosis is a major mechanism underlying chronic kidney disease (CKD). N6-methyladenosine (m6A) RNA methylation is associated with organ fibrosis. We investigated m6A profile alterations and the inhibitory effect of RNA methylation in kidney fibrosis in vitro (TGF-β-treated HK-2 cells) and in vivo (unilateral ureteral obstruction [UUO] mouse model). METTL3-mediated signaling was inhibited using siRNA in vitro or the METTL3-specific inhibitor STM2457 in vivo and in vitro. In HK-2 cells, METTL3 protein levels increased in a dose- and time-dependent manner along with an increase in the cellular m6A levels. In the UUO model, METTL3 expression and m6A levels were significantly increased. Transcriptomic and m6A profiling demonstrated that epithelial-to-mesenchymal transition- and inflammation-related pathways were significantly associated with RNA m6A methylation. Genetic and pharmacologic inhibition of METTL3 in HK-2 cells decreased TGF-β-induced fibrotic marker expression. STM2457-induced inhibition of METTL3 attenuated the degree of kidney fibrosis in vivo. Furthermore, METTL3 protein expression was significantly increased in the tissues of CKD patients with diabetic or IgA nephropathy. Therefore, targeting alterations in RNA methylation could be a potential therapeutic strategy for treating kidney fibrosis.


Conflict of interest statement

The authors declare no competing interests.

Figures

Fig. 1
Fig. 1. TGF-β increased N6-methyladenosine (m6A) RNA methylation in renal tubular epithelial cells.
a Western blot of HK-2 cells for fibrosis-related and m6A RNA methylation writer, eraser, and reader proteins after TGF-β challenge (10 ng/mL) at baseline and at 8, 24, and 48 h. b Western blot of fibrosis-related and RNA methylation proteins in HK-2 cells with TGF-β challenge (1, 10, and 100 ng/mL) for 48 h. c Messenger RNA levels of RNA methylation-related markers with or without TGF-β challenge (10 ng/mL for 48 h) analyzed using real-time PCR. d m6A RNA methylation levels after TGF-β challenge (10 ng/mL for 48 h) estimated using enzyme-linked immunosorbent assays for RNA m6A. An independent unpaired t test was used for comparisons between two groups. **P < 0.01. e Effect of METTL3 knockdown on TGF-β-mediated gene expression of fibrosis-related genes. After METTL3 was inhibited using siMETTL3, HK-2 cells were challenged with TGF-β (10 ng/mL for 48 h).
Fig. 2
Fig. 2. The levels of N6-methyladenosine (m6A) RNA methylation increased in a unilateral ureteral obstruction (UUO) mouse model.
a, b Western blot for fibrosis-related and m6A RNA methylation writer, eraser, and reader proteins in 7-day (a) and 14-day (b) UUO-induced mouse models. c Densitometric measurement of western blots for METTL3 and YTHDF1 in 7-day and 14-day UUO-induced mouse models. d Immunohistochemical staining for METTL3 in 7-day and 14-day UUO-induced mouse models. e, f m6A RNA methylation levels in 7-day (e) and 14-day (f) UUO-induced mouse models estimated using an enzyme-linked immunosorbent assay for RNA m6A. Comparisons of means between two and three groups were analyzed using independent t tests and ANOVA with post hoc Tukey tests, respectively. nsP > 0.05, *P < 0.05, **P < 0.01, ***P < 0.001.
Fig. 3
Fig. 3. Transcriptomic effect of METTL3 knockdown on TGF-β-mediated epithelial-mesenchymal transition in renal tubular epithelial cells.
a Top 40 differentially expressed genes following METTL3 knockdown in TGF-β-treated HK-2 cells. After transfection of siRNA targeting the 3’ UTR of METTL3 and METTL3-overexpressing vectors resistant to siRNA, HK-2 cells were treated with TGF-β (10 ng/mL for 48 h), and their transcriptome was analyzed using RNA sequencing. Heatmap demonstrating the top 40 differentially expressed genes (P < 0.05, |fold change| ≥1.5) sorted by fold change. Each row represents a gene, and each column represents a sample. Red and green indicate expression levels above and below the median of each gene across the samples, respectively. b Network representation of enriched Gene Ontology (GO) biological processes (analyzed by ClueGO; P < 0.05) using 372 differentially expressed genes following treatment with METTL3 siRNA (P < 0.05, |fold change| ≥1.5). The node size represents the term enrichment significance. The nodes are linked based on their kappa score ( ≥ 0.4), where the term labels with the most genes per group are shown. c Gene set enrichment analysis (GSEA) for Gene Ontology biological process (GOBP) gene sets using RNA sequencing data for TGF-β-treated (10 ng/mL for 48 h) HK-2 cells with the control and METTL3 siRNAs. The left panel shows the enriched GOBP gene sets (P < 0.02) in the control siRNA-treated cells compared with the METTL3 siRNA-treated cells. The right panel shows the enrichment plots for representative GOBP gene sets. On the x axis, the genes are ranked from the most upregulated to the most downregulated between the control siRNA-treated cells (left end; positively correlated) and the METTL3 siRNA-treated cells (right end; negatively correlated). The y axis shows a running enrichment score for METTL3 siRNA treatment. d GSEA for WikiPathways gene sets using RNA sequencing data for the TGF-β-treated (10 ng/mL for 48 h) HK-2 cells with the control and METTL3 siRNAs. The left panel shows the enriched WikiPathways gene sets (P < 0.05) in the control siRNA-treated cells compared with the METTL3 siRNA-treated cells. The right panel shows the enrichment plots for representative WikiPathways gene sets. On the x axis, the genes are ranked from the most upregulated to the most downregulated between the control siRNA-treated cells (left end; positively correlated) and the METTL3 siRNA-treated cells (right end; negatively correlated). The y axis shows a running enrichment score for METTL3 siRNA treatment.
Fig. 4
Fig. 4. Profile of N6-methyladenosine (m6A) RNA methylation in in vitro kidney fibrosis models.
a M6A peak distribution across the mRNA transcripts, including 5′ untranslated regions (5′ UTR), coding DNA sequence (CDS), and 3′ UTR. The RNA m6A profile was analyzed using methylated RNA immunoprecipitation sequencing (MeRIP-seq). b Enriched consensus m6A motifs were identified from the MeRIP-Seq analysis in the control and TGF-β-treated (10 ng/mL for 48 h) HK-2 cells. c Volcano plot for differentially methylated peaks in transcript levels from the MeRIP-Seq analysis between the control and TGF-β-treated HK-2 cells ([fold change] >3/2 or <2/3, P < 0.05). The x axis represents fold changes in the TGF-β-treated cells compared with the control cells. d Significantly enriched hallmark gene sets (P < 0.01) in 261 genes with differentially methylated m6A peaks between the control and TGF-β-treated HK-2 cells. e The Integrative Genomics Viewer (IGV) tool revealed the m6A peak distribution in NET1 from the MeRIP-Seq analysis in the control (TGF-β [-]) and TGF-β-treated (TGF-β [+]) HK-2 cells. f M6A methylation levels of the NET1 transcript in the control and TGF-β-treated HK-2 cells estimated using MeRIP-qPCR.
Fig. 5
Fig. 5. NET1 regulates TGF-β-induced epithelial-to-mesenchymal transition (EMT).
a, b mRNA (a) and protein (b) levels of NET1 after TGF-β treatment (10 ng/mL for 48 h) estimated using real-time PCR and western blot, respectively. c, d RNA stability of NET1 after treatment with TGF-β or the METTL3 inhibitor STM2457. Effect of TGF-β (c) or STM2457 (d) on NET1 RNA stability evaluated by actinomycin D treatment (5 μg/mL) and real-time PCR for NET1 transcript at the indicated times. e, f The effect of NET1 on TGF-β-induced EMT. Effects of NET1 knockdown using siRNA on the expression of EMT markers after TGF-β treatment (10 ng/mL for 48 h), as evaluated using real-time PCR (e) and western blot analysis (f).
Fig. 6
Fig. 6. Profile of N6-methyladenosine (m6A) RNA methylation in in vivo kidney fibrosis models.
a M6A peak distribution across the mRNA transcripts, including 5′ untranslated regions (5′ UTR), coding DNA sequence (CDS), and 3′ UTR. The RNA m6A profile was analyzed using methylated RNA immunoprecipitation sequencing (MeRIP-seq) using kidney tissues from control and unilateral ureteral obstruction (UUO)-induced model mice. b Enriched consensus m6A motifs were identified from the MeRIP-Seq analysis in the control and UUO-induced mice. c Volcano plot for differentially methylated peaks in transcript levels from the MeRIP-seq analysis between the control and UUO-induced mice ([fold change] >3/2 or <2/3, P < 0.05). The x axis represents fold changes in the UUO-induced mice compared with the control mice. d Significantly enriched hallmark gene sets (P < 0.01) in 472 genes with increased m6A peaks (fold change >2) in the UUO-induced mice compared with the control mice. e The Integrative Genomics Viewer (IGV) tool revealed the m6A peak distribution in the NET1 gene from the MeRIP-Seq analysis in the control and UUO-induced mice. f M6A methylation levels of the NET1 transcript in the control and UUO model mice estimated using MeRIP-qPCR.
Fig. 7
Fig. 7. Effects of METTL3 inhibition on kidney fibrosis models.
a Total RNA N6-methyladenosine (m6A) levels in HK-2 cells after treatment with the METTL3 inhibitor STM2457 (1, 5, and 10 μM for 24 h). b Western blot of fibrosis-related proteins in the HK-2 cells challenged with TGF-β (10 ng/mL for 48 h) with or without STM2457 (5 μM for 48 h). c RT‒PCR results for METTL3 and other fibrosis-related proteins in the 14-day UUO-induced mouse model. d Masson’s trichome stain (MT) and immunohistochemical staining results in the 14-day UUO-induced mouse model after treatment with STM2457 (50 mg/kg, daily). Comparisons of means between two and three or more groups were analyzed using independent t tests and ANOVA with post hoc Tukey tests, respectively. Scale bar: MT 100 μm (×200), αSMA/Col1a 50 μm (×400). nsP > 0.05, *P < 0.05, **P < 0.01, ***P < 0.001.
Fig. 8
Fig. 8. Tissue expression of METTL3 in patients with chronic kidney disease (CKD).
a Representative METTL3 immunohistochemical staining results in kidney tissues from CKD patients with IgA nephropathy and diabetic nephropathy and control patients. Scale bar: 50 μm (×400). b Measurement of the METTL3-positive area according to disease type, CKD stage, proteinuria levels, and degrees of interstitial fibrosis. DMN diabetic nephropathy, IgAN IgA nephropathy, IF interstitial fibrosis, uPCR urinary protein-to-creatinine ratio (g/g). Comparisons of means among three or more groups were performed using an independent ANOVA with a post hoc Tukey’s test. *P < 0.05.

References

    1. GBD. Global, regional, and national burden of chronic kidney disease, 1990-2017: a systematic analysis for the Global Burden of Disease Study 2017. Lancet. 2020;395:709–733. doi: 10.1016/S0140-6736(20)30045-3. - DOI - PMC - PubMed
    1. Hill NR, et al. Global prevalence of chronic kidney disease—a systematic review and meta-analysis. PLoS ONE. 2016;11:e0158765. doi: 10.1371/journal.pone.0158765. - DOI - PMC - PubMed
    1. Chen TK, Knicely DH, Grams ME. Chronic kidney disease diagnosis and management: a review. J. Am. Med. Assoc. 2019;322:1294–1304. doi: 10.1001/jama.2019.14745. - DOI - PMC - PubMed
    1. Wang C, et al. An update on renal fibrosis: from mechanisms to therapeutic strategies with a focus on extracellular vesicles. Kidney Res. Clin. Pract. 2023;42:174–187. doi: 10.23876/j.krcp.22.159. - DOI - PMC - PubMed
    1. Chuang PY, Menon MC, He JC. Molecular targets for treatment of kidney fibrosis. J. Mol. Med. 2013;91:549–559. doi: 10.1007/s00109-012-0983-z. - DOI - PMC - PubMed