. 2024 Jan 31;16(1):20.
doi: 10.1186/s13073-024-01287-7.

Integrative analysis of spatial and single-cell transcriptome data from human pancreatic cancer reveals an intermediate cancer cell population associated with poor prognosis

Affiliations

Integrative analysis of spatial and single-cell transcriptome data from human pancreatic cancer reveals an intermediate cancer cell population associated with poor prognosis

Seongryong Kim et al. Genome Med. .

Abstract

Background: Recent studies using single-cell transcriptomic analysis have reported several distinct clusters of neoplastic epithelial cells and cancer-associated fibroblasts in the pancreatic cancer tumor microenvironment. However, their molecular characteristics and biological significance have not been clearly elucidated due to intra- and inter-tumoral heterogeneity.

Methods: We performed single-cell RNA sequencing using enriched non-immune cell populations from 17 pancreatic tumor tissues (16 pancreatic cancer and one high-grade dysplasia) and generated paired spatial transcriptomic data from seven patient samples.

Results: We identified five distinct functional subclusters of pancreatic cancer cells and six distinct cancer-associated fibroblast subclusters. We deeply profiled their characteristics, and we found that these subclusters successfully deconvoluted most of the features suggested in bulk transcriptome analysis of pancreatic cancer. Among those subclusters, we identified a novel cancer cell subcluster, Ep_VGLL1, showing intermediate characteristics between the extremities of basal-like and classical dichotomy, despite its prognostic value. Molecular features of Ep_VGLL1 suggest its transitional properties between basal-like and classical subtypes, which is supported by spatial transcriptomic data.

Conclusions: This integrative analysis not only provides a comprehensive landscape of pancreatic cancer and fibroblast population, but also suggests a novel insight to the dynamic states of pancreatic cancer cells and unveils potential therapeutic targets.

Keywords: Cancer-associated fibroblasts; Molecular subtype of pancreatic cancer; Pancreatic cancer; Pancreatic cancer cells; Transitional cell state.


Conflict of interest statement

The authors declare that they have no competing interests.

Figures
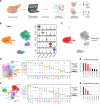
Fig. 1
Fig. 1
Single-cell transcriptomic landscape of epithelial cells and fibroblasts in pancreatic cancer. A Experimental workflow and data preprocessing steps. B UMAP projection of five major cell populations identified in the CD45-negative cell population of pancreatic cancer. C Predicted copy number alterations across the major cell populations. D UMAP projection of epithelial cell subclusters with their specific markers. E Relative abundance of epithelial subclusters in the proliferating population. Enrichment scores were calculated by dividing each subcluster’s fraction in the proliferating epithelial population (Ep_CDK1) by the fraction in the non-proliferating population. Bar colors indicate the significances tested by proportion z-tests: red (significant enrichment), black (significant depletion). F Fibroblast-stellate cell subclusters with their specific markers. G Relative abundances of fibroblast-stellate subclusters in the proliferating population as in E
Fig. 2
Fig. 2
Population-based clustering identifies pathological and molecular subtypes of pancreatic cancer. A Bar plots and heatmaps displaying the subcluster composition and clinical information of the patients included in this study. B Heatmap representation of the hierarchical clusters of pancreatic cancer patients. C PCA plot of the patient hierarchical clusters. The hierarchical clustering and PCA were based on the composition data for the cancer cell population and CAF population. D Bar plot representing the fraction of samples pathologically diagnosed as IPMN or PDAC across the patient clusters. E Pathological stages of the patients in each patient subcluster. F Proportions of cancer cell clusters showing differential patterns in their fraction across the patient clusters. G Heatmap showing the average expression of signature genes in pancreatic cancer subtypes (IPMN—adenocarcinoma, classical—basal-like, NMF signatures). H,I Shannon Diversity Index was calculated in (H) the cancer cell population and (I) the CAF. Whiskers indicate minimum and maximum values, and values exceeding 1.5 × IQR (interquartile range) are noted as outliers
Fig. 3
Fig. 3
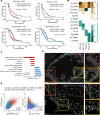
Identification of subpopulations with prognostic values. A Kaplan–Meier survival curves representing the overall survival of patients included in ICGC (PACA-CA) and TCGA (PAAD), stratified by the expression level of the Ep_KRT6A signature and Ep_VGLL1 signature. P-values were determined by log-rank tests. B Prognostic values of cluster-specific markers in two public cohorts. Colors indicate log-transformed P-values, and P-values were determined by log-rank tests comparing high- and low- expression groups. Dark green color indicates favorable prognosis in the high-expression group, whereas brown color indicates worse prognosis in the high-expression group compared to the low-expression group. C Results from the pathway enrichment analysis conducted on the DEGs comparing Ep_VGLL1 and Ep_KRT6A. For the DEG analysis, the Wilcoxon rank-sum test was used for statistical testing with adjusted P-value cut-off 0.05. D Scatter plots showing the correlation between EMT scores and Ep_KRT6A or Ep_VGLL1 scores across pancreatic cancer cells. EMT scores were calculated using the EMT signature gene set and subcluster scores calculated by the expression of subcluster-specific genes. E RNA in situ hybridization images from human pancreatic cancer tissue. Green, red, and blue colors indicate KRT19, VGLL1, and KRT6B, respectively. Orange and yellow boxes highlight KRT6B and VGLL1 expressing tumor epithelial cells, respectively
Fig. 4
Fig. 4
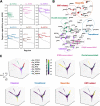
Transcription factor network regulating pancreatic cancer cell clusters. A Specific transcription factor activities across cancer cell clusters. The top five transcription factors showing specific activities for each cancer cell cluster are shown. B Transcription factor network in the pancreatic epithelial cell population. Edge widths are proportional to the correlation coefficients between the transcription factor pairs. Node colors indicate the cancer cell clusters associated with, and the size is proportional to the significance of the association. C 3D Diffusion maps based on the transcription factor activities. The activities of transcription factors in each TF cluster were averaged into a single score and projected onto the 3D diffusion map
Fig. 5
Fig. 5
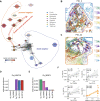
Ep_VGLL1 represents the transitional cancer cell population in PDAC progression. A Average inferred transcription factor activities of KLF5 and SOX4 across the epithelial cell clusters in pancreatic cancer. B Average expression of SMAD4 and GATA6 in epithelial cell clusters. C Wnt signaling network in the epithelial cell population. D,E Scatter plots showing the average (D) Wnt dependency and Wnt independency scores and (E) S100A4 and OCLN expression across the epithelial cell clusters. F Expression of epithelial subcluster markers in FOLFIRINOX-treated pancreatic cancer tumor spheroid cells. The tumor spheroid cells were derived from six different patients and the expression data downloaded from a previous study [9]. Whiskers indicate minimum and maximum values, and values exceeding 1.5 × IQR (interquartile range) are noted as outliers
Fig. 6
Fig. 6
Spatial deconvolution of human PDAC tissue. A Predicted cellular abundances in spatial transcriptome data from a PDAC patient sample (PID_22). Major global cell types, major epithelial, and fibroblast subclusters are shown. B,C Subcluster compositions of (B) cancer cell and (C) fibroblast populations in PDAC patient samples. D,E Scatter plots depicting subcluster compositions of (D) cancer cell and (E) fibroblast populations from scRNA-seq and paired spatial data. Each dot represents the proportions of each subcluster in a patient, where the proportion from scRNA-seq data is plotted on the x-axis, and the proportion from the paired spatial data is plotted on the y-axis. Pearson’s r-value and P-value for the correlation coefficient are depicted on the upper left side of each plot. F Pairwise cosine similarities of cancer cell and fibroblast subcluster compositions
Fig. 7
Fig. 7
Identification of niches in human PDAC tissue. A Neighborhood graph representing neighborhood enrichment of cell types. Edges represent average neighborhood enrichment scores (observed-to-expected ratio) between the cell types, and only the bidirectional enrichments were depicted in this graph as edges. Dot sizes are proportional to the estimated abundances (log scale), and the colors represent average cancer cell abundances in each cell type’s neighborhood. B,C Representative images of deconvoluted spatial transcriptome data from two PDAC patients, colored with the abundances of three major cancer cell subclusters and two major fibroblast subclusters of PDAC. Orange dashed lines indicate cancer proximal niches, while blue dashed lines indicate cancer distal niches and the red dashed lines indicate putative cancer progression axis. D,E Average estimated abundances of the two major fibroblast subclusters, (D) Fb_LRRC15 and (E) Fb_SFRP1, in each epithelial subcluster’s neighborhood. F Correlation between the fraction of Fb_LRRC15 in the fibroblast population and the fraction of major cancer cell clusters in scRNA-seq data. Pearson’s r-value and p-value are denoted on the upper left corner of each plot

References

    1. Siegel RL, Miller KD, Fuchs HE, Jemal A. Cancer Statistics, 2021. CA Cancer J Clin. 2021;71:7–33. doi: 10.3322/caac.21654. - DOI - PubMed
    1. Rahib L, Wehner MR, Matrisian LM, Nead KT. Estimated Projection of US Cancer Incidence and Death to 2040. JAMA Netw Open. 2021;4:e214708. doi: 10.1001/jamanetworkopen.2021.4708. - DOI - PMC - PubMed
    1. Conroy T, Desseigne F, Ychou M, Bouché O, Guimbaud R, Bécouarn Y, et al. FOLFIRINOX versus gemcitabine for metastatic pancreatic cancer. N Engl J Med. 2011;364:1817–1825. doi: 10.1056/NEJMoa1011923. - DOI - PubMed
    1. National Comprehensive Cancer Network. Pancreatic Adenocarcinoma (Version 2.2021). Available from: https://www.nccn.org/professionals/physician_gls/pdf/pancreatic.pdf. [cited 2021 Feb 25].
    1. Von Hoff DD, Ervin T, Arena FP, Chiorean EG, Infante J, Moore M, et al. Increased survival in pancreatic cancer with nab-paclitaxel plus gemcitabine. N Engl J Med. 2013;369:1691–1703. doi: 10.1056/NEJMoa1304369. - DOI - PMC - PubMed

Publication types