. 2024 Jan 31;16(1):19.
doi: 10.1186/s13073-024-01291-x.

Age-dependent genes in adipose stem and precursor cells affect regulation of fat cell differentiation and link aging to obesity via cellular and genetic interactions

Affiliations

Age-dependent genes in adipose stem and precursor cells affect regulation of fat cell differentiation and link aging to obesity via cellular and genetic interactions

Asha Kar et al. Genome Med. .

Abstract

Background: Age and obesity are dominant risk factors for several common cardiometabolic disorders, and both are known to impair adipose tissue function. However, the underlying cellular and genetic factors linking aging and obesity on adipose tissue function have remained elusive. Adipose stem and precursor cells (ASPCs) are an understudied, yet crucial adipose cell type due to their deterministic adipocyte differentiation potential, which impacts the capacity to store fat in a metabolically healthy manner.

Methods: We integrated subcutaneous adipose tissue (SAT) bulk (n=435) and large single-nucleus RNA sequencing (n=105) data with the UK Biobank (UKB) (n=391,701) data to study age-obesity interactions originating from ASPCs by performing cell-type decomposition, differential expression testing, cell-cell communication analyses, and construction of polygenic risk scores for body mass index (BMI).

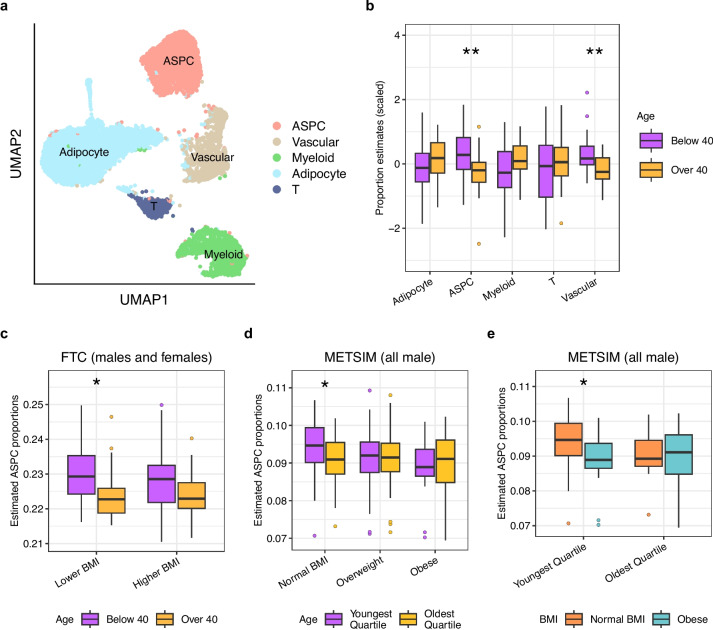
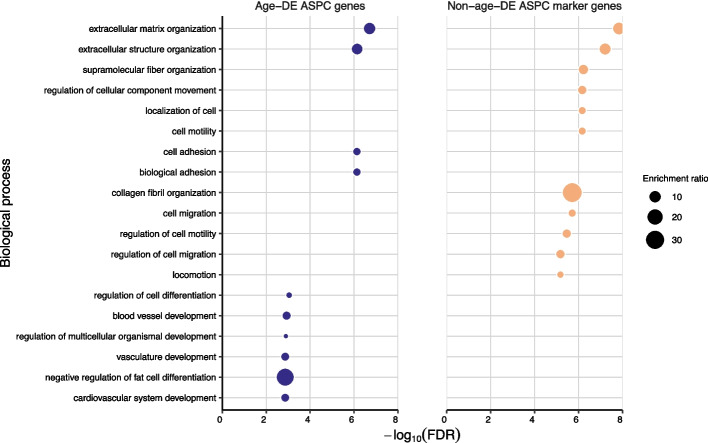
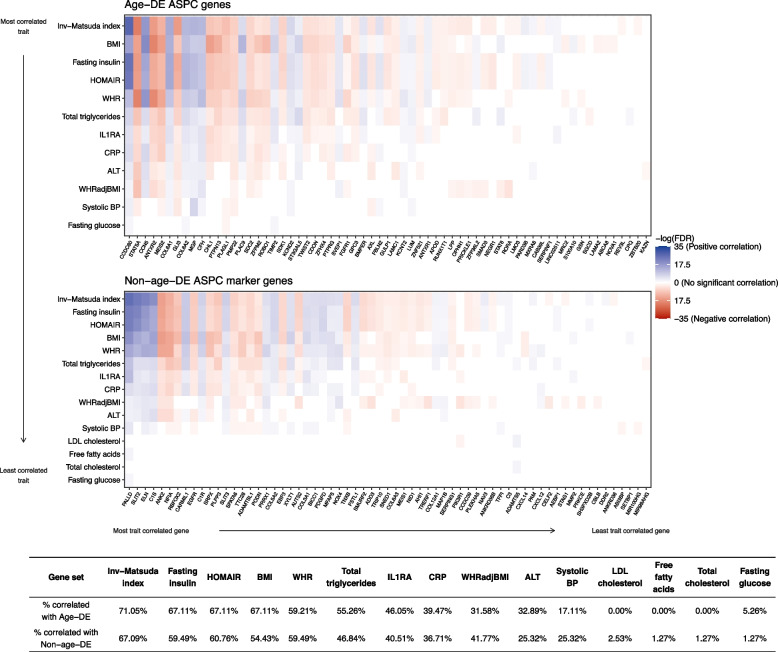
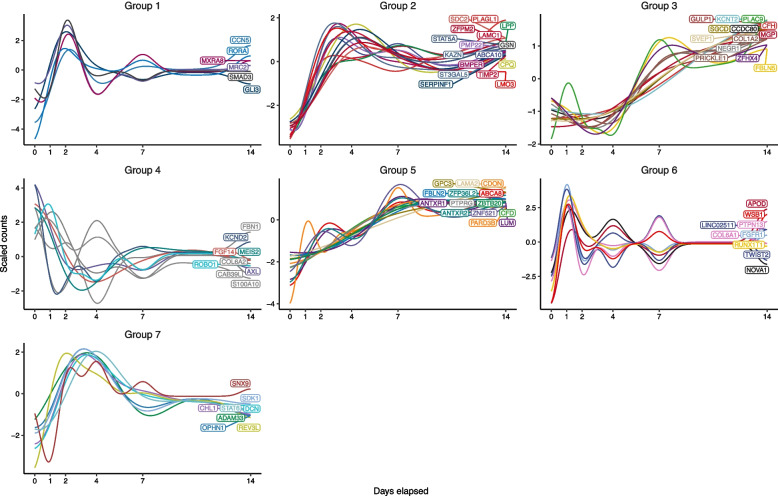
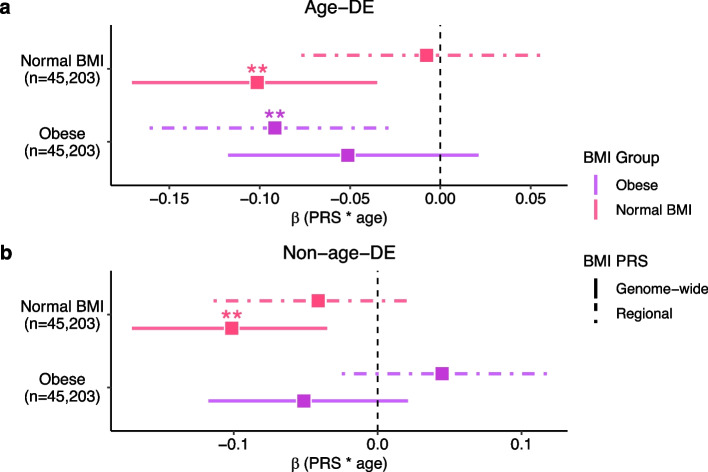
Results: We found that the SAT ASPC proportions significantly decrease with age in an obesity-dependent way consistently in two independent cohorts, both showing that the age dependency of ASPC proportions is abolished by obesity. We further identified 76 genes (72 SAT ASPC marker genes and 4 transcription factors regulating ASPC marker genes) that are differentially expressed by age in SAT and functionally enriched for developmental processes and adipocyte differentiation (i.e., adipogenesis). The 76 age-perturbed ASPC genes include multiple negative regulators of adipogenesis, such as RORA, SMAD3, TWIST2, and ZNF521, form tight clusters of longitudinally co-expressed genes during human adipogenesis, and show age-based differences in cellular interactions between ASPCs and adipose cell types. Finally, our genetic data demonstrate that cis-regional variants of these genes interact with age as predictors of BMI in an obesity-dependent way in the large UKB, while no such gene-age interaction on BMI is observed with non-age-dependent ASPC marker genes, thus independently confirming our cellular ASPC results at the biobank level.

Conclusions: Overall, we discover that obesity prematurely induces a decrease in ASPC proportions and identify 76 developmentally important ASPC genes that implicate altered negative regulation of fat cell differentiation as a mechanism for aging and directly link aging to obesity via significant cellular and genetic interactions.

Keywords: Adipose stem and precursor cells (ASPCs); Aging; Gene-age interactions; Obesity; Polygenic risk score (PRS).


Conflict of interest statement

The authors declare that they have no competing interests.

Figures

Fig. 1
Fig. 1
Comparisons of SAT cell-type proportion estimates by age and BMI status indicate that ASPC proportions decrease with age, and this difference is abolished by obesity. a Uniform Manifold Approximation and Projection (UMAP) visualization of 12,564 nuclei from SAT samples of 6 individuals from the Finnish Twin Cohort (FTC), colored by cell type. We assigned clusters to 5 major adipose cell types. b Boxplots comparing the centered and scaled SAT cell-type proportion estimates in bulk SAT RNA-seq from FTC between unrelated individuals below (n=28) and above 40 years of age (n=22) show a significant difference in ASPC proportions by age. The 40-year cutpoint was selected due to the bimodal distribution of age in FTC (see “Methods”). We randomly selected one individual per monozygotic (MZ) twin pair to ensure the individuals were unrelated. c Boxplots separate BMI-discordant MZ twin pairs from FTC into a lower BMI group consisting of the lower BMI twin per pair and higher BMI group with the higher BMI twin. Within each group, we compared ASPC proportions by age (nlower BMI below 40=28, nhigher BMI below 40=28, nlower BMI over 40=22, nhigher BMI over 40=22). d Boxplots separate normal BMI (BMI<25), overweight (25BMI<30), and obese (BMI30) individuals from the METSIM cohort and compare SAT ASPC proportions between those with age below the 25th percentile of age (nnormal BMI=27, noverweight=46, nobese=19) and above the 75th percentile of age (nnormal BMI=21, noverweight=34, nobese=18) in each group. e Boxplots separate the individuals from METSIM with age below the 25th percentile of age (nnormal BMI=27, nobese=19) and above the 75th percentile of age (nnormal BMI=21, nobese=18) and compare SAT ASPC proportions between normal BMI (BMI<25) and obese (BMI30) individuals in each age group. b–e Asterisks denote a significant difference in cell-type proportions between younger and older individuals as assessed by a Wilcoxon test. Significance thresholds for p-values: *p <0.05, **p <0.01, and ***p <0.001
Fig. 2
Fig. 2
The 76 age-DE SAT ASPC genes show differences in functional pathways compared to the 79 non-age-DE ASPC marker genes. Dot plots compare the top 10 most significantly (FDR<0.05) enriched biological pathways for the 76 age-DE SAT ASPC genes (colored blue) and top 79 non-age-DE ASPC marker genes (colored orange). Each dot represents a significantly enriched pathway, where the size of dot represents the enrichment ratio. The remaining pathways of the 76 age-DE ASPC genes and 79 non-age-DE ASPC marker genes are shown in Additional file 3: Table S11 and S12, respectively
Fig. 3
Fig. 3
Age-DE SAT ASPC genes and non-age-DE ASPC marker genes show association patterns with many metabolic traits. Heatmaps compare the associations between the bulk expression of individuals genes in METSIM (n=335) and all tested metabolic phenotypes, for the 76 age-DE SAT ASPC genes (top) and 79 non-age-DE (bottom) ASPC marker genes. Traits and genes are both shown in decreasing order of number of significant correlations, as assessed by a Wilcoxon rank sum test. For each gene, we colored significantly associated traits (FDR<0.05) by directionality of the association, where a positive log2 fold change in gene expression represents a positive association. Red indicates a positive correlation, blue indicates a negative correlation, and genes colored black showed no significant correlations. Genes and outcomes which had no significant associations (FDR<0.05) were omitted. Below the heatmaps, we tabulate the proportions of genes per gene set that show significant associations with each metabolic trait
Fig. 4
Fig. 4
Longitudinal expression profiles of the age-DE SAT ASPC genes discover seven temporally co-expressed gene subgroups during adipogenesis. Plots of gene expression against time show the scaled predicted gene counts against the number of days elapsed since the start of the human SAT preadipocyte differentiation experiment. The predicted counts of each gene and gene groupings were obtained using DPGP, which fitted Gaussian models to each gene and performed clustering on the temporal expression data
Fig. 5
Fig. 5
Age and the regional BMI polygenic risk score (PRS) comprising the local cis variants of the age-DE SAT ASPC genes interact negatively on BMI in obese individuals. Forest plots compare the 95% confidence intervals for the standardized estimated coefficient (β) of the age and BMI PRS interaction term in the linear model BMI ~ age + PRS + PRS × age between the genome-wide PRS, which includes all variants in the genome and a regional PRS, which includes the variants in the cis-regions of the (a) age-DE SAT ASPC genes and (b) non-age-DE ASPC marker genes. We separated the normal BMI (BMI<25) (n=45,203) and obese (BMI30) (n=45,203) individuals in UKB, and within each BMI group, evaluated the interaction term between age and the regional and genome-wide BMI PRSs. Each dot represents the mean estimate, and the horizontal bars denote the 95% confidence intervals of the estimate. Asterisks indicate that the age and PRS interaction term is significant in the model, as assessed by a Wald-test. Significance thresholds for p-values: *p <0.05, **p <0.01, and ***p <0.001

References

    1. Oh J, Lee YD, Wagers AJ. Stem cell aging: mechanisms, regulators and therapeutic opportunities. Nat Med. 2014;20:870–80. doi: 10.1038/nm.3651. - DOI - PMC - PubMed
    1. Viñuela A, Brown AA, Buil A, Tsai P-C, Davies MN, Bell JT, et al. Age-dependent changes in mean and variance of gene expression across tissues in a twin cohort. Hum Mol Genet. 2018;27:732–41. doi: 10.1093/hmg/ddx424. - DOI - PMC - PubMed
    1. Glass D, Viñuela A, Davies MN, Ramasamy A, Parts L, Knowles D, et al. Gene expression changes with age in skin, adipose tissue, blood and brain. Genome Biol. 2013;14:R75. doi: 10.1186/gb-2013-14-7-r75. - DOI - PMC - PubMed
    1. Cartwright MJ, Tchkonia T, Kirkland JL. Aging in adipocytes: potential impact of inherent, depot-specific mechanisms. Exp Gerontol. 2007;42:463–71. doi: 10.1016/j.exger.2007.03.003. - DOI - PMC - PubMed
    1. Tchkonia T, Morbeck DE, Von Zglinicki T, Van Deursen J, Lustgarten J, Scrable H, et al. Fat tissue, aging, and cellular senescence. Aging Cell. 2010;9:667–84. doi: 10.1111/j.1474-9726.2010.00608.x. - DOI - PMC - PubMed

Publication types

Substances