. 2024 Apr 18;33(9):802-817.
doi: 10.1093/hmg/ddae013.

Excessive tubulin glutamylation leads to progressive cone-rod dystrophy and loss of outer segment integrity

Affiliations

Excessive tubulin glutamylation leads to progressive cone-rod dystrophy and loss of outer segment integrity

Rawaa Aljammal et al. Hum Mol Genet. .

Abstract

Mutations in Cytosolic Carboxypeptidase-like Protein 5 (CCP5) are associated with vision loss in humans. To decipher the mechanisms behind CCP5-associated blindness, we generated a novel mouse model lacking CCP5. In this model, we found that increased tubulin glutamylation led to progressive cone-rod dystrophy, with cones showing a more pronounced and earlier functional loss than rod photoreceptors. The observed functional reduction was not due to cell death, levels, or the mislocalization of major phototransduction proteins. Instead, the increased tubulin glutamylation caused shortened photoreceptor axonemes and the formation of numerous abnormal membranous whorls that disrupted the integrity of photoreceptor outer segments (OS). Ultimately, excessive tubulin glutamylation led to the progressive loss of photoreceptors, affecting cones more severely than rods. Our results highlight the importance of maintaining tubulin glutamylation for normal photoreceptor function. Furthermore, we demonstrate that murine cone photoreceptors are more sensitive to disrupted tubulin glutamylation levels than rods, suggesting an essential role for axoneme in the structural integrity of the cone outer segment. This study provides valuable insights into the mechanisms of photoreceptor diseases linked to excessive tubulin glutamylation.

Keywords: blindness; photoreceptors; protein posttranslational modification; retinal degeneration; tubulin modification.


Figures

Figure 1
Figure 1
Generation of Ccp5 knockout mouse model. A: Schematic showing the design used to generate Ccp5 null mouse. A1: Illustrates exon/intron arrangement in the Ccp5 wildtype allele, including sequences marking the beginning and the end of the CCP5 protein. A2: Depicts the Ccp5 knockout allele, with two guide RNAs (illustrated as scissors) that mediate the editing of Ccp5 by CRISPR-Cas 9 to remove part of exon two and exon 3, creating a premature stop codon (red asterisk). The predicted truncated protein is shown on the right. B: Validation of Ccp5 deletion by reverse transcriptase polymerase chain reaction (RT-PCR) followed by agarose gel electrophoresis. B1: Illustration showing the locations of the primers used in the RT-PCR. Ccp5, FCcp5-RCcp5-S primers flanking the exons 2 and 3, FCcp5-RCcp5 primers in the regions deleted in the knockout. B2: Agarose gels showing the PCR products amplified by primer pairs FCcp5-RCcp5-S and FCcp5-RCcp5. C1: Ccp1, another member of the cytosolic carboxypeptidase family, serves as a control. Illustration showing the position of primers, FCcp1 and RCcp1 in the C-terminal of Ccp1. C2: Agarose gels showing the PCR products amplified by the primer pair, FCcp1 and RCcp1. Amino acid residues (aa), base pairs (bp). For all figures in this article, wildtype littermate controls are indicated by ‘+/+’ and Ccp5 knockout by ‘−/−.’
Figure 2
Figure 2
Exclusive increase in tubulin glutamylation in Ccp5 knockout mouse model. A1: Immunoblot of retinal lysates stained for various posttranslational modifications by glutamyl groups with specific antibodies indicated on the right. α-tubulin staining serves as a control. A2/A3: Densitometric analysis of the proteins normalized to α-tubulin and total protein, respectively. B1: Immunoblot of immunoprecipitated retinal lysates; the lysates were immunoprecipitated (IP) with either control IgGs or GT335. The IP was followed by immunoblotting (IB) using antibodies against α-tubulin and β-tubulin. B2: Densitometric analysis of the proteins shown in B1 normalized to total protein. C1: Immunoblot of retinal lysates stained for known tubulin posttranslational modifications indicated on the right. The molecular weights are indicated on the left in kilodaltons (kDa), the retinae were collected at P30, equal amounts of the retinal extracts (2 μg) were immunoblotted, P-value: *<0.05. Antibodies used: GT335 recognizes the branching point of glutamylated proteins; B3 identifies two or more glutamates at the branching point; polyE for polyglutamylation; Detyr. tubulin recognizes detyrosinated α-tubulin; Δ2 tubulin is against tubulin where the last two amino acid residues are removed; Gly-tubulin recognizes glycated tubulin; Acetyl. tubulin recognizes acetylation at Lysine 40 in α-tubulin. C2: Densitometric analysis of the proteins shown in C1 normalized to α-Tubulin.
Figure 3
Figure 3
Photoreceptor dysfunction in Ccp5 knockout mice at P20. A: Scotopic ERG recorded at P20 in dark-adapted mice. A1: Sensitivity curves for scotopic a-wave at different light intensities. A2, A3: Representative scotopic ERG traces recorded at the light intensity of 0.382 cd.s.m−2 and 0.0241 cd.s.m−2, respectively. B: Photopic ERG recorded at P20 in light-adapted mice. B1: Sensitivity curves for photopic a-wave at various flash luminances, B2: Representative photopic traces recorded at the light intensity of 7.6 cd.s.m−2. (n = 4), unpaired two-tailed t-test applied; P-value: **<0.005.
Figure 4
Figure 4
Decline in photoreceptor function in Ccp5 knockout animals at P200. A: Scotopic ERG recorded in dark-adapted mice at P200. A1: Sensitivity curves of scotopic a-wave at different light intensities. A2, A3: Representative scotopic traces recorded at the light intensity of 0.382 cd.s.m−2 and 0.0241 cd.s.m−2, respectively. B: Photopic ERG recorded in light-adapted mice at P200. B1: Sensitivity curves of photopic a-wave at various flash luminances, B2: Representative photopic traces recorded at the light intensity of 7.6 cd.s.m−2. (n = 4), unpaired two-tailed t-test applied; P-value: ****<0.00005.
Figure 5
Figure 5
Photoreceptor degeneration in the absence of CCP5. A1: Retinal section obtained from mice at P20 stained with Hematoxylin and eosin (H&E). A2: Spider plot depicting the number of photoreceptor nuclei at P20. B1: Retinal section obtained from mice at P200 stained with H&E. B2: Spider plot depicting the number of photoreceptor nuclei at P200. The number of nuclei was counted at locations indicated relative to the optic disk (OD) on a vertical line. Outer nuclear layer (ONL), inner nuclear layer (INL), and ganglion cell layer (GCL) scale bar is 20 μm. (n = 3), unpaired two-tailed t-test applied; P-value: ***<0.0005, *<0.05, n.s. non-significant.
Figure 6
Figure 6
Loss of cone photoreceptors in retina lacking CCP5. Representative images of flat-mounted retina stained with peanut agglutinin. A, B: Retina from mice at P20 and P200, respectively. A1, B1: Dorsal region of the retina. A2, B2: Ventral region of the retina. A3, B3: Quantification of cone photoreceptors in the dorsal and ventral regions of the retina. Cone density is shown in the Y axis. Scale bar is 20 μm, (n = 3), unpaired two-tailed t-test applied; P-value: ****<0.00005, ***<0.0005, n.s. non-significant.
Figure 7
Figure 7
Levels of major phototransduction proteins are unaffected in the CCP5 knockout mouse model. A1, A2: Western blot for cone and rod proteins, respectively, at P20 (n = 5). A3: Densitometric analysis of the proteins shown in A1 and A2, normalized to total protein levels. B1, B2: Western blot for cone and rod proteins, respectively, at P200 (n = 3). B3: Densitometric analysis of the proteins shown in B1 and B2, normalized to PKCα. Equal amounts of the retinal lysates (20 μg) were loaded on the SDS-PAGE gel, followed by immunoblotting with antibodies, as indicated on the right. PDE6α′ cone phosphodiesterase-6 α, PDE6β: Rod phosphodiesterase-6 β, GαT2: Cone transducin α subunit, GαT1: Rod transducin α subunit, ARR4: Cone Arrestin, ARR1: Rod Arrestin. GAPDH: Glyceraldehyde-3-phosphate dehydrogenase, PKCα: Protein Kinase α, unpaired two-tailed t-test applied; P-value: **<0.005.
Figure 8
Figure 8
Normal localization of the phototransduction proteins without CCP5. A: Immunohistochemistry (IHC) images of P20 retinal cross-sections stained for various photoreceptor-resident proteins, as indicated in the fig. B: IHC images of P200 retinal cross-sections stained for photoreceptor-resident proteins. (n = 3). Scale bar: 20 μm. PNA: Peanut Agglutinin, DAPI: 4′,6-diamidino-2-phenylindole, PDE6α’: Cone PDE6α subunit, HSP60: Heat Shock Protein 60, GαT1: Rod Transducin α subunit.
Figure 9
Figure 9
Disorganized photoreceptor outer segments in Ccp5 knockout mice. A1, B1: Representative images showing the photoreceptor layer and the retinal pigmented epithelium (RPE) in wildtype (+/+) and Ccp5 knockout (−/−) mice at P20, and P200, respectively. Scale bar: 50 μm. A2, B2: Images representing the ultrastructure of the photoreceptor outer segment in wildtype (+/+) mice at P20 and P200, respectively. A3, B3: Images showing disorganized photoreceptor whorls in Ccp5 knockout (−/−) mice at P20 and P200, respectively. (n = 5), scale bar: 5 μm.
Figure 10
Figure 10
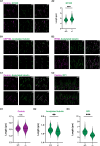
Shortened photoreceptor axoneme in Ccp5 knockout mice. A1: Representative SIM images of photoreceptor cilia labeled with the acetylated tubulin (magenta) and GT335 (green). A2: Violin plot representing the length distribution of cilia labeled with GT335 [n = 100 (+/+), 89 (−/−)]. B1/B2: SIM images showing photoreceptor cilia stained with the acetylated tubulin (green) and centrosomal protein 164 (CEP164, magenta-B1), and intraflagellar transport protein (IFT88, magenta-B2). C1/C2: Photoreceptor cilia stained with centrin (magenta), acetylated tubulin (green-C1), and retinitis pigmentosa 1 (RP1, green-C2) D: Violin plot illustrating the length distribution of: D1: proximal axoneme stained with acetylated tubulin [n = 100 (+/+), 89 (−/−)], D2: connecting cilia stained with centrin and D3: distal axoneme stained with RP1 [n = 240 (+/+), 200 (−/−)]. Scale bar is 0. 2 μm; statistical significance was determined using an unpaired two-tailed t-test; P-value: ***<0.0005, **<0.005, n.s. not significant.

References

    1. Walaas SI, Greengard P. Protein phosphorylation and neuronal function. Pharmacol Rev 1991;43:299–349. - PubMed
    1. Xu L, Nagai Y, Kajihara Y. et al. The regulation of Rab GTPases by phosphorylation. Biomol Ther 2021;11:1340. - PMC - PubMed
    1. Edde B, Rossier J, Le Caer JP. et al. Posttranslational glutamylation of alpha-tubulin. Science 1990;247:83–5. - PubMed
    1. Janke C, Rogowski K, van DijkJ. Polyglutamylation: a fine-regulator of protein function? 'Protein modifications: beyond the usual suspects' review series. EMBO Rep 2008;9:636–41. - PMC - PubMed
    1. McKenna ED, Sarbanes SL, Cummings SW. et al. The tubulin code, from molecules to health and disease. Annu Rev Cell Dev Biol 2023;39:331–61. - PubMed

Publication types